Seen from Space 2019
Heavy rainfall and flood in northern Kyushu area in late August 2019
[August 29, 2019 released / August 30, 2019 updated]
Heavy rainfall occurred in northern Kyushu area in late August 2019. Japan Meteorological Agency (JMA) announced heavy rain emergency warning for municipalities in Saga Pref., Fukuoka Pref., and Nagasaki Pref. on August 28, 2019.
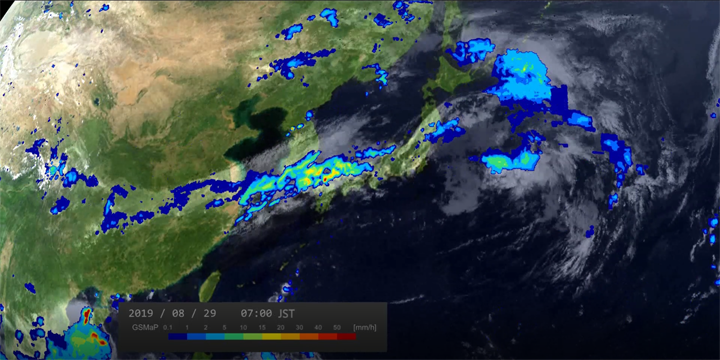
Figure 1 shows accumulated rainfall by the Global Satellite Mapping of Precipitation (GSMaP) during August 24, 2019 23:00 - August 28 22:00(Here after all represents UTC).
Regarding this heavy rainfall and related flood, Dual-frequency Precipitation Radar(DPR)onboard Global Precipitation Measurement (GPM) core observatory observed three-dimensional structure of rainfall at 22:45 on August 28. Also, Phased Array type L-band Synthetic Aperture Radar-2(PALSAR-2)onboard Advanced Land Observing Satellite-2 "DAICHI-2" (ALOS-2) observed around Saga Pref. at 03:11 on August 28 based on the request from Ministry of Land, Infrastructure, Transport and Tourism (MLIT), and the data was provided to disaster prevention organizations.
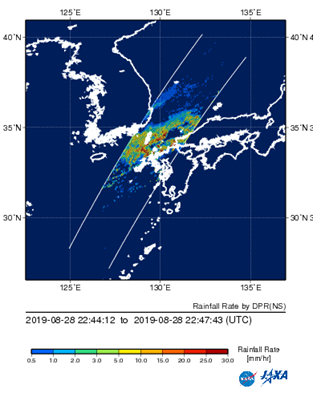
Figure 2. Land surface distribution of rainfall observed by GPM/DPR at 22:45 on August 28.
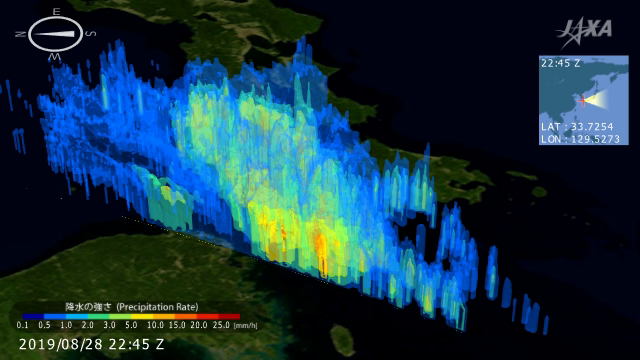
Figures 2 and 3 are the image and the animation showing heavy rainfall in northern Kyushu observed by DPR onboard GPM at 22:45 on August 28. We can find that rainfall reaches as high as 14 km in active convective rain area. Currently, GPM/DPR is the only satellite which can measure three-dimensional rainfall with high accuracy from space. The observation is helpful for our daily life through utilization of weather forecast by JMA.
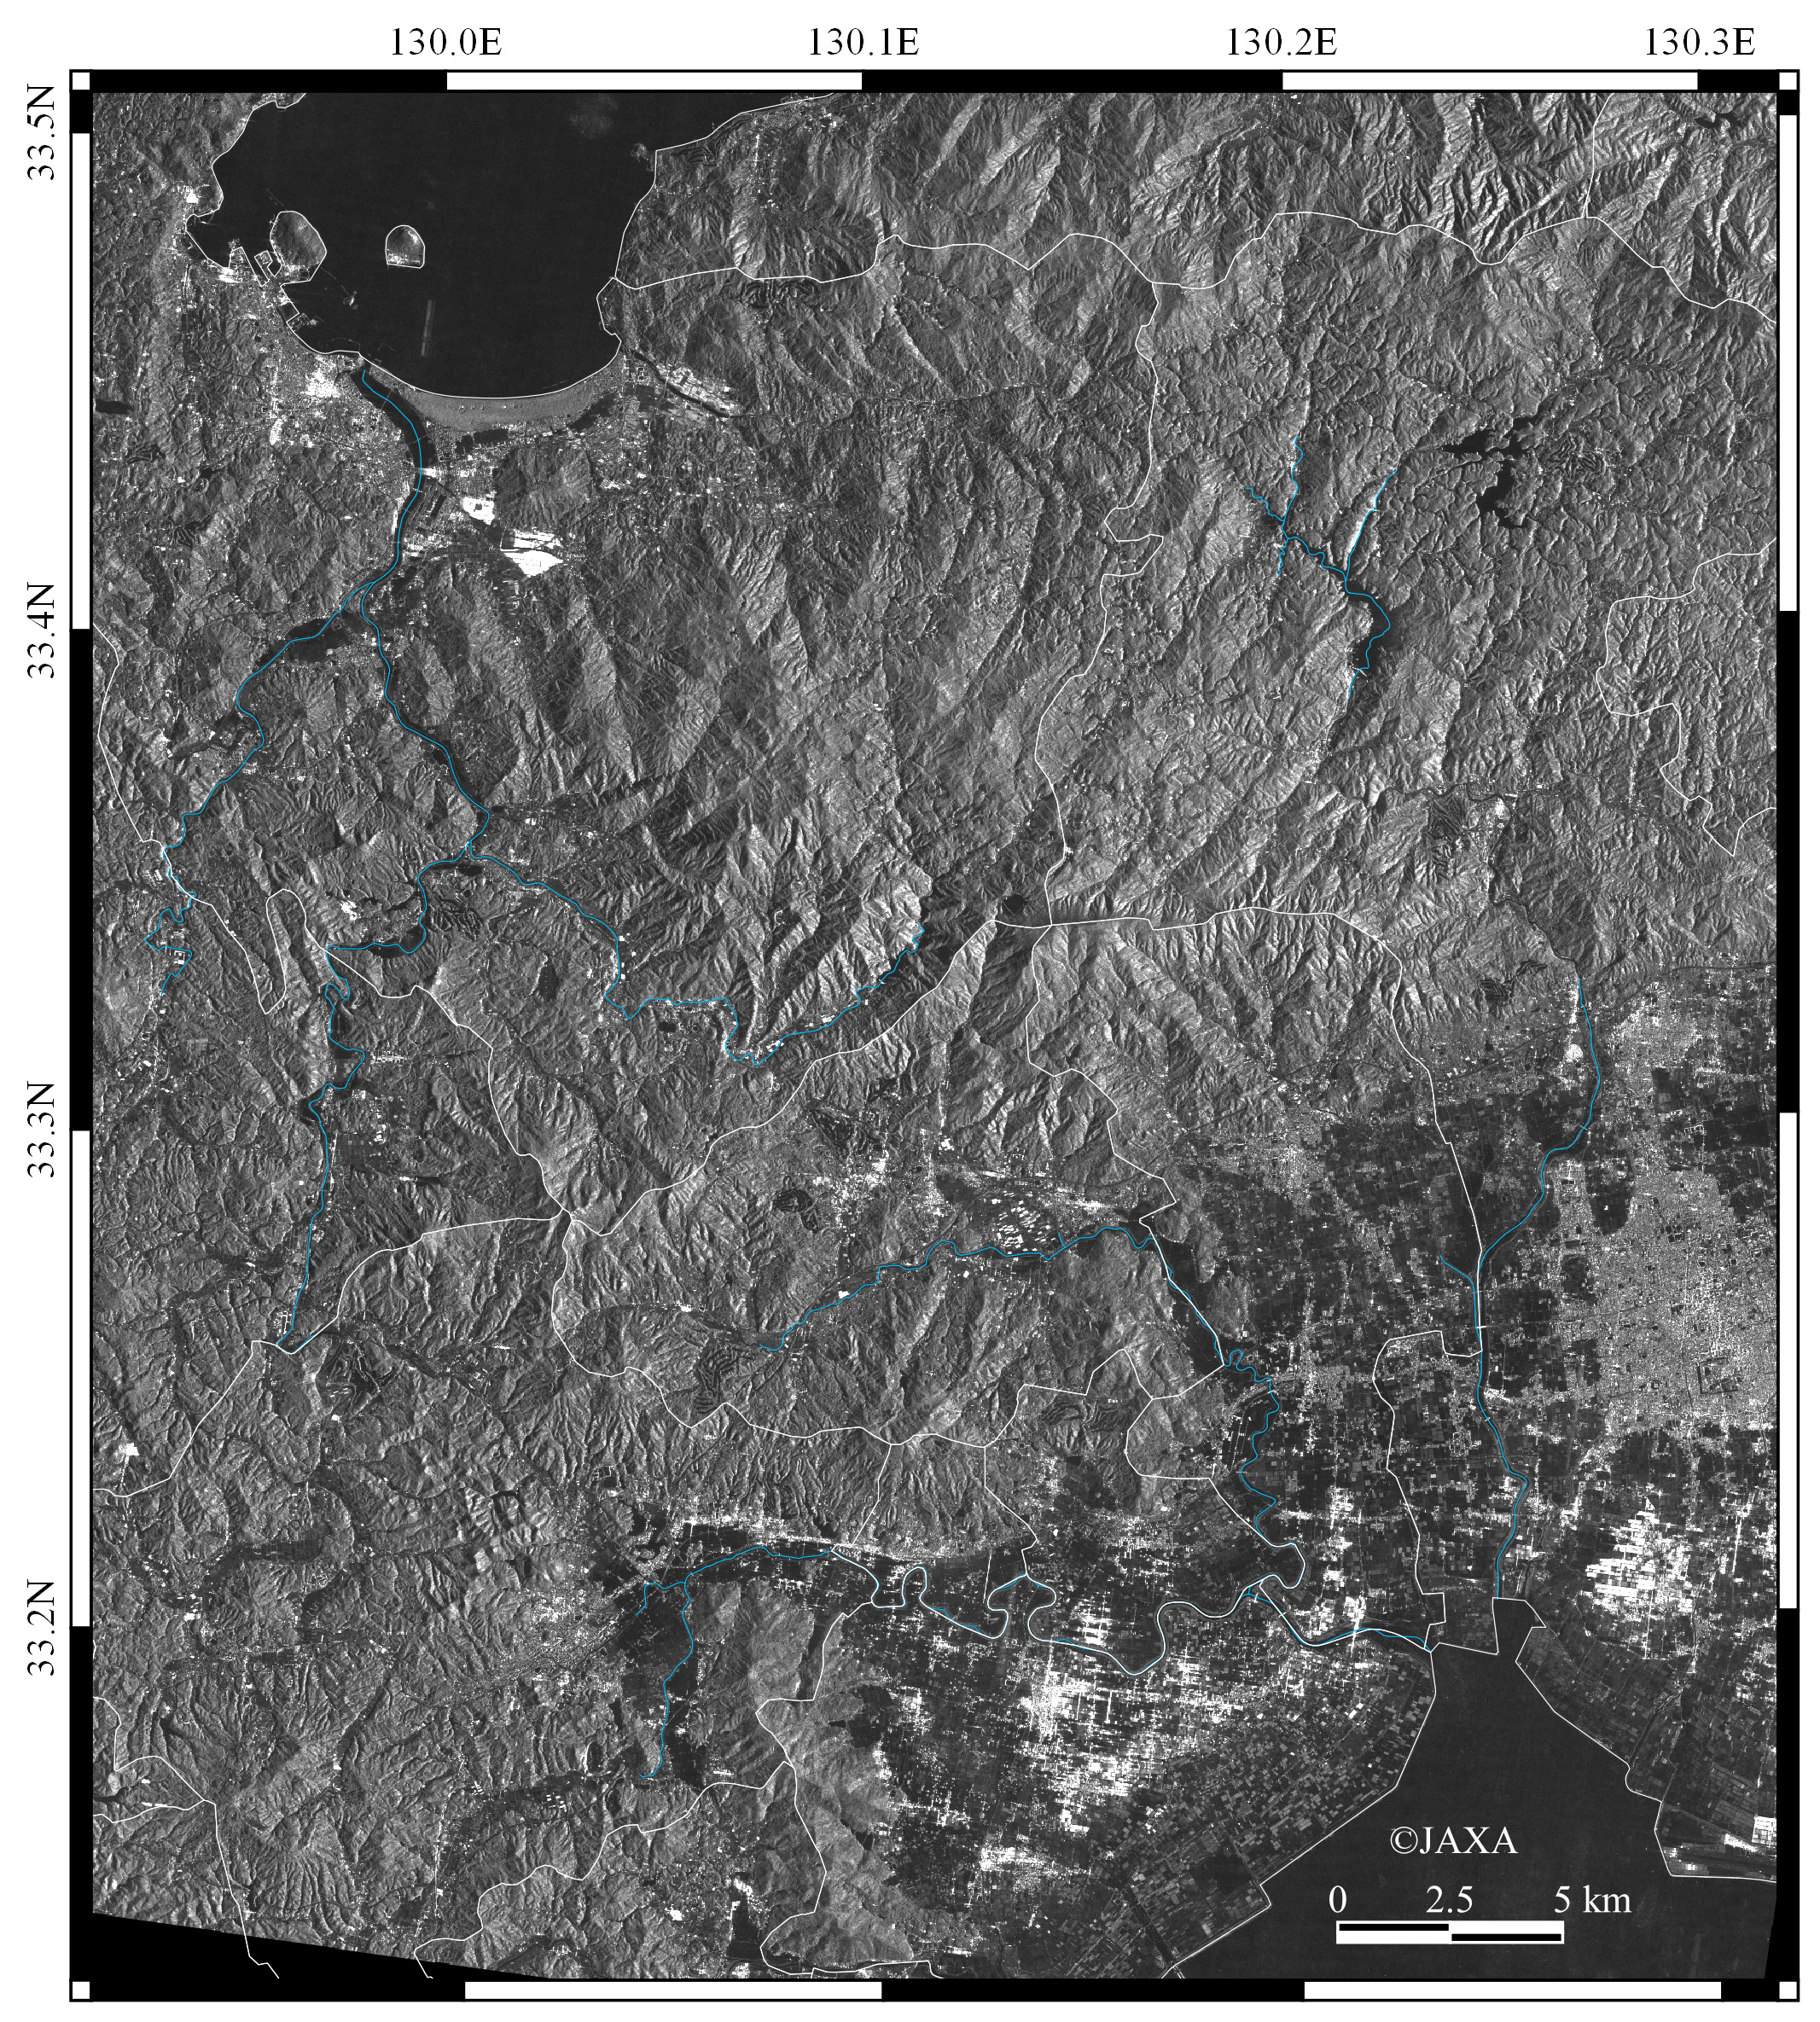
Figure 4 shows the image observed by ALOS-2/PALSAR-2 with high resolution mode (3m resolution, HH polarized wave) at 03:11 on August 28. Figure 5 is an analysis image estimated flooded area from this image. It is inferred that darker color parts have higher possibility of flooded condition. Since this estimation utilizes the brightness change of the image, there is a possibility to include changes which have no relation with disaster, such as urban development or seasonal change of the farmland.
*In this analysis, past PALSAR-2 data and the inundation risk map provided by MLIT are used.

As of August 29, it continues to be raining in some region, so please pay high attention to heavy rain.
[Added on August 30]
JAXA has proceed the development of land surface simulation system, "Today's Earth (TE)" jointly with the University of Tokyo in order to calculate and estimate the damage by heavy rainfall beyond the limits of frequency or region in satellite observation. Figure 6 shows estimated result of river discharge by TE-Japan, regional version of TE with high resolution.
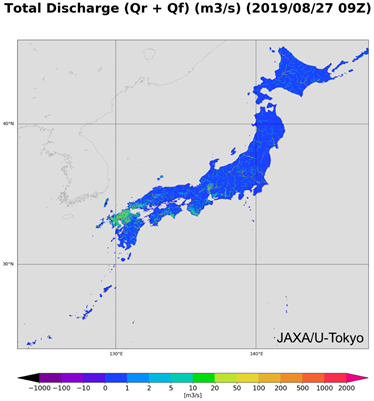
Figure 6. River discharge all over Japan estimated by TE-Japan(August 27, 2019 9:00 (UTC))
TE-Japan can monitor river discharge all over Japan at about 1 km resolution every hour. Figure 7 shows flood situation in northern Kyushu (Hourly change of the percentage of flooded area in each grid of the model), and the part of red square covers the range of observation image by ALOS-2/PALSAR-2 in Figure 5. In comparison of Fig. 7 and Fig. 5, flooded areas estimated by TE-Japan are consistent with the results estimated by the ALOS-2 observation. Moreover, it can estimate flooded areas with broader timescale covering wide range beyond satellite observation.

As introduced above, JAXA is proceeding researches in order to help flood damage mitigation in future by analyzing information obtained from satellites and models in an integrated way.
Explanation of the Images
Figure 2 and 3
| Satellite | Global Precipitation Measurement Core Observatory (GPM core observatory) |
|---|---|
| Sensor | Dual-frequency Precipitation Radar (DPR) |
| Date | August 28, 2019 22:45(UTC) |
Figure 4
| Satellite | Advanced Land Observing Satellite-2 "DAICHI-2" (ALOS-2) |
|---|---|
| Sensor | Phased Array type L-band Synthetic Aperture Radar-2 (PALSAR-2) |
| Date | August 28, 2019 03:11(UTC) |
Related Sites
- Seen from Space 2018 Release of Today's Earth - Global (TE-Global)
- Seen from Space 2015 Release of the JAXA Realtime Rainfall Watch
- Seen from Space 2012 Severe Flood in Thailand
- Seen from Space 2007 Korean Peninsula Flood by Heavy Rain
- Seen from Space 2005 Heavy rainfall brought by Baiu front hit Chugoku area
- Seen from Space 2005 Disastrous storms in Pakistan
- Seen from Space 2003 AMSR Captures Flooding in Northeast China
- Seen from Space 2003 Northeastern China Suffers Large-Scale Flooding
- Seen from Space 2003 Flood in Southern China
- Rainfall region associated with a developing cyclone
- JAXA GLOBAL RAINFALL WATCH
- Today's Earth(TE)
- GPM Website
- ALOS-2 ALOS@EORC HomePage
- Global Change Observation Mission - Climate (GCOM-C)
- Typhoon/Flood, Seen from Space


