Seen from Space 2005
Disastrous storms in Pakistan
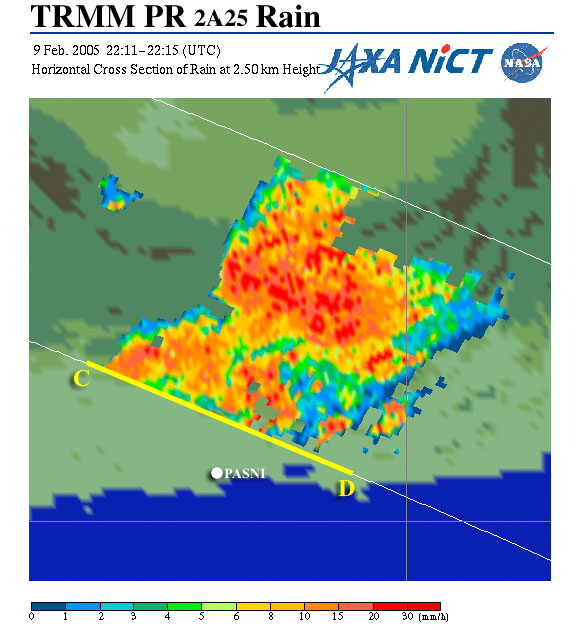
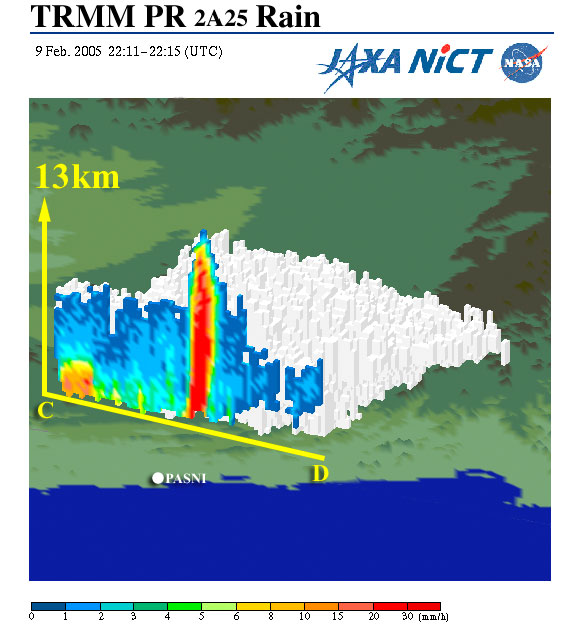
During the first half of February 2005 continuous snow and rainfall caused several dams to burst and avalanches in Pakistan. The Precipitation Radar (PR) on the Tropical Rainfall Measuring Mission (TRMM) satellite captured the heavy storms over southwestern and northern Pakistan. Figure 1 presents the rainfall rate distribution over the central Makran range, in southwestern Pakistan. The regions with strong rainfall-rates distributed over wide-ranging areas are shown in red. CF, the cross-track swath width of PR is about 245 km. The three-dimensional structure and a vertical cross-section of the torrential rainstorms are depicted in Figure 2. On the southern part of the well-developed storm, localized heavy rain contains a rainfall level of about 13 km. On the night of the pouring rain, a substantial volume of melted snow and rain caused a dam to burst near Pasni, located south of the above-mentioned rain area. A great deal of damage was done by the precipitation-driven collapse of the dam. Villages downstream flooded and more than 500 people were missing or dead. Additionally, three more dams broke in the same district a few days later due to the long-lasting rains.
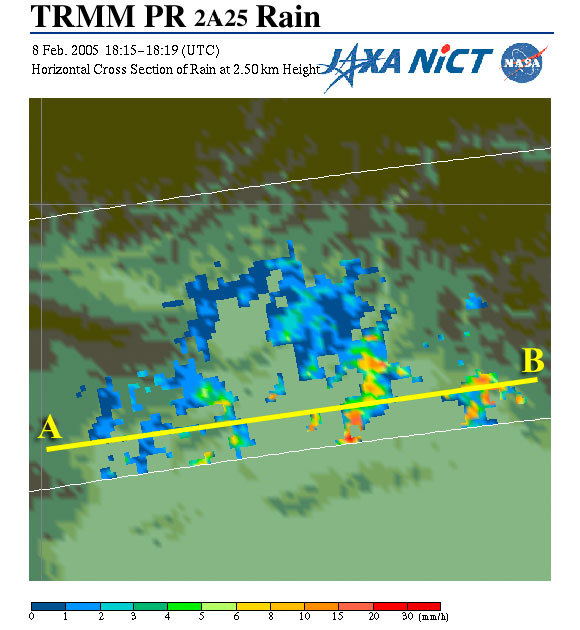
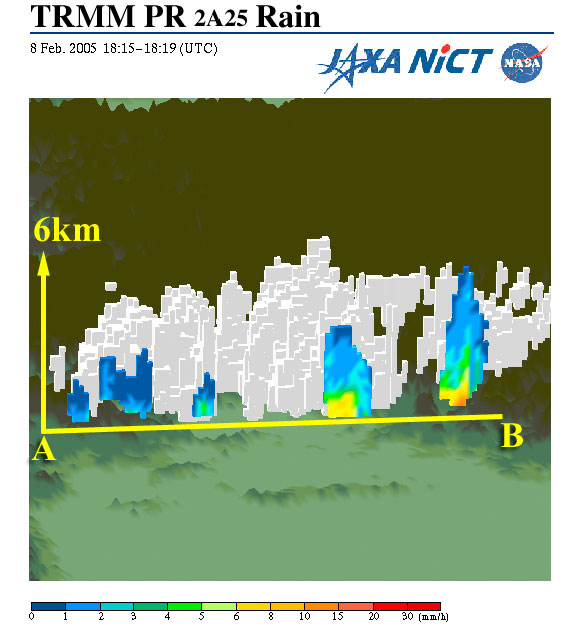
In the North-West Frontier Province and Kashmir, record snowfall caused avalanches and destroyed houses. Figure 3 depicts the distribution of precipitation in the suburbs of the capital, Islamabad. The well-developed weather systems often occur in this district surrounded by the Himalayas, the Karakorm, and the Hindu Kush Mountains. In view of the vertical cross section of precipitation shown in Figure 4, most levels of precipitation are low levels. According to the Pakistan's official report on 18 February, these heavy storms killed 544 people. On 22 February, a massive snow avalanche killed 252 people at the northern part of India, Jammu and Kashmir,. A series of torrential rains and heavy snowfall caused widespread damage through out Iran, Afghanistan, Pakistan, and India.
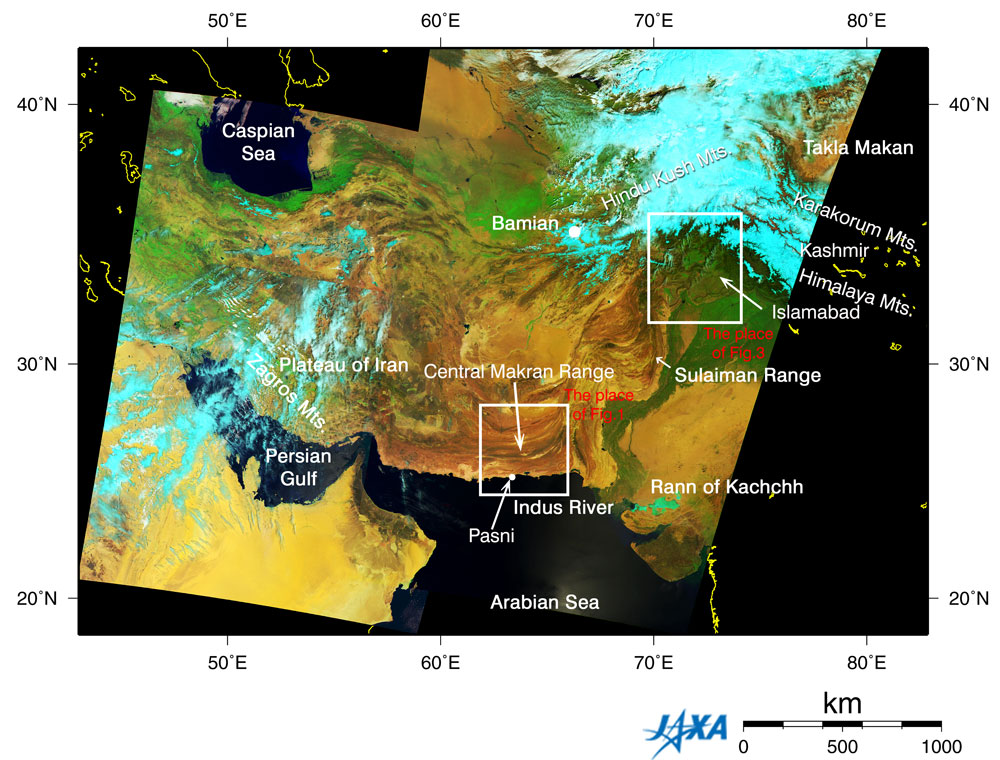
Figure 5 depicts the southwestern part of Asia captured by GLI. in April and May 2003. The boxes indicate the regions shown in Figure 1 and 3. The great curves of bare rock in the southwestern part of Pakistan correspond to the central Makran ranges (Figure 1). On the other hand, the region shown in Figure 3 is covered with lush green vegetation. It is important to gain an understanding of rainfall even over lightly populated areas to gain an understanding of the situation of water resources such as river flow rates. One of the strength of the observation by TRMM PR is to capture precipitation systems that developed over the deep mountainous area shown in Figure 1. The observational data has been used to understand regional characteristics of precipitation systems and to estimate accurate rainfall amount across much of the globe. TRMM is a joint mission between NASA, NICT, and JAXA.
Related sites: |
|||||||||||||||||||||||||||