Seen from Space 2004
Japan Islands during "Golden Week," observed from space
| |
|
|
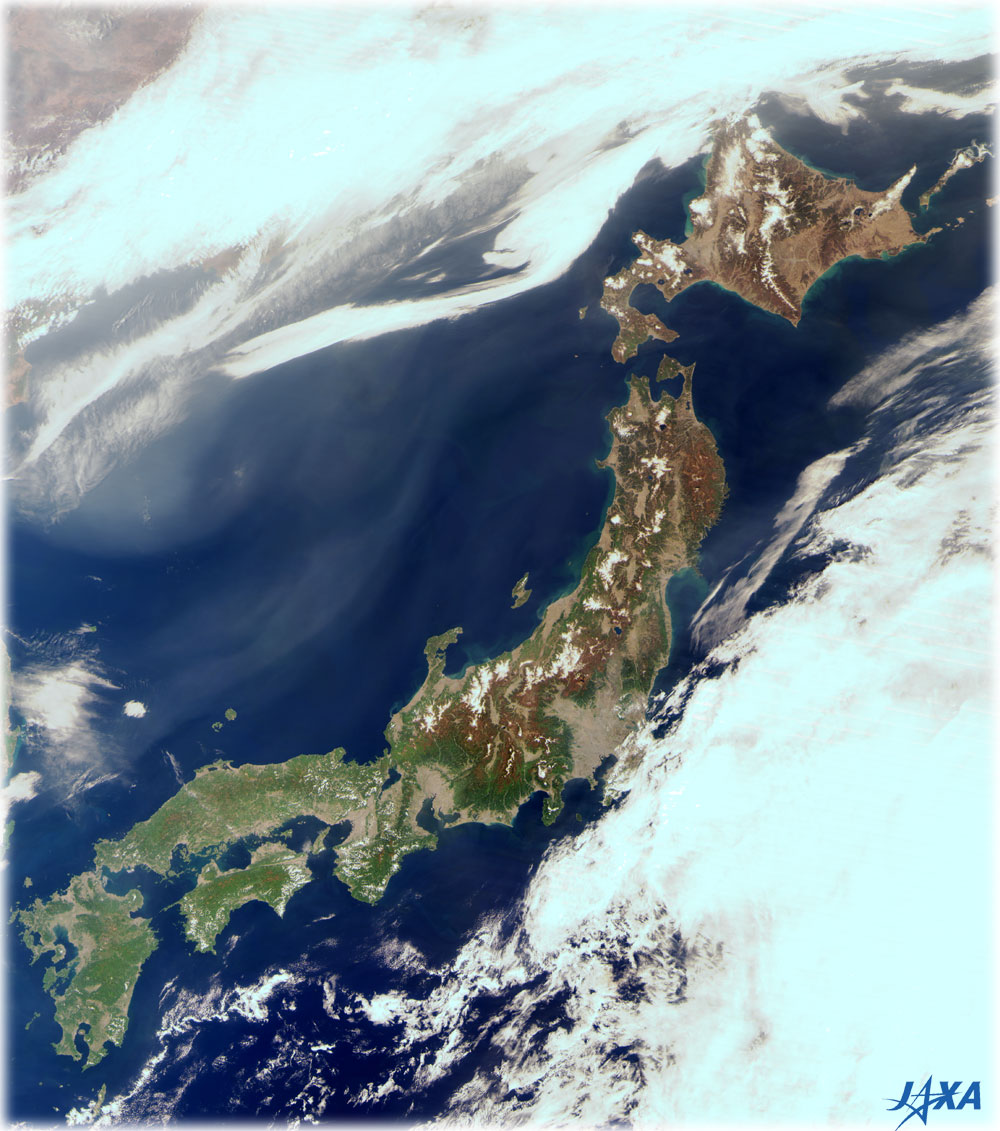
Fig. 1 Japan Islands during "Golden Week" (May 3, 2003). |
Figure 1 is an image of the Japanese Archipelago captured by the Midori II satellite on May 3, 2003. The image depicts
a border line of fresh verdure at the southern part of the Tohoku area. The higher mountain areas such as the Japan Alps are still brown, and areas of fresh verdure differ depending on height above sea level and latitude.
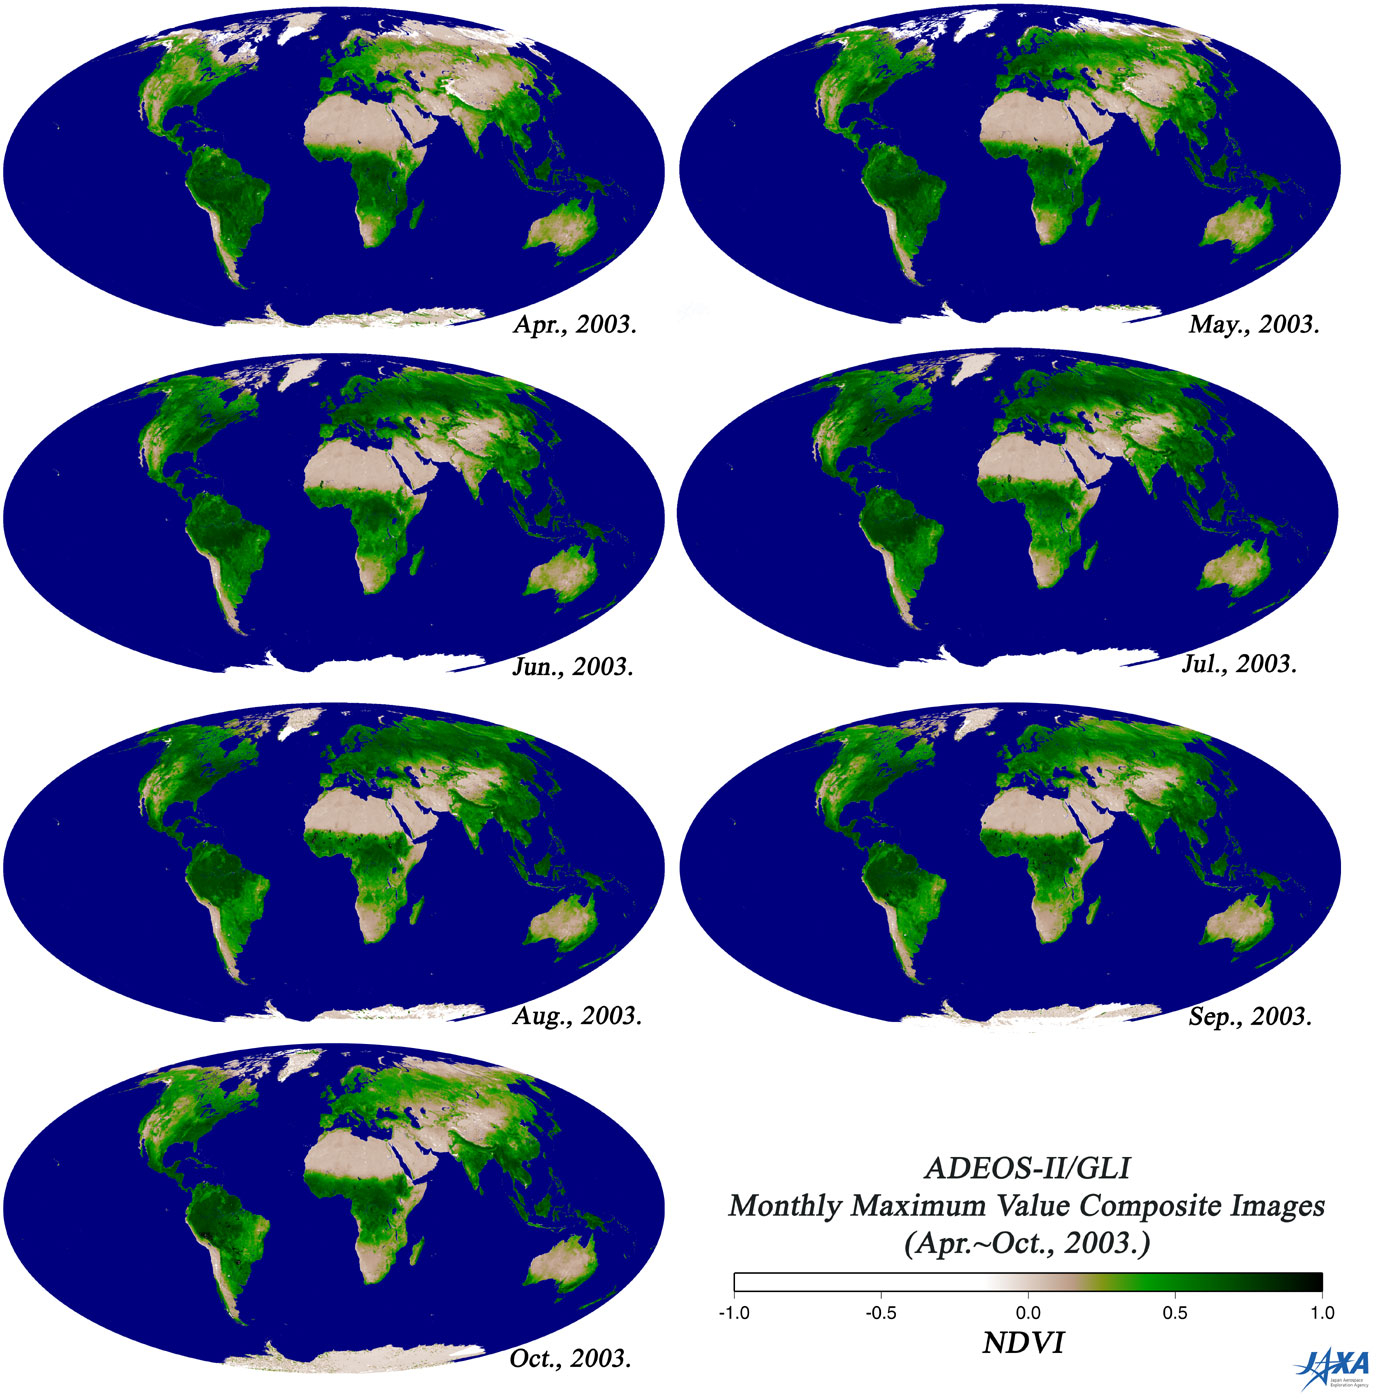
The Midori II satellite observed vegetation in Japan and globally. Figure 2 illustrates the monthly vegetation index from April to October 2003. The index indicates the amount and the health of vegetation, and a larger index represents a thicker, more robust vegetation. Observe that the vegetation expands largely in the northern part of the Eurasian continent and North America from April to June, and that vegetation activity is at it's climax and covers all the continents from July to August.
|
|
Fig. 2 The global vegetation index (April to October 2003). |
The plants captured in Figs. 1 and 2 provide us with oxygen, food, feed for cattle, water conservation, and a stable climate. Mankind could not survive without these plants. Therefore, we must monitor the Earth's environment continuously and globally with Earth-obervation satellites, and quickly respond to alarms given to us by nature.
Related sites:
 Fresh-greenery of Japan Observed by Midori-II Fresh-greenery of Japan Observed by Midori-II
Wave of Fresh Green Coloring in the Northern Hemisphere
Explanation of the images
Figure 1
|
|
Figure 1 is a composite image generated from GLI's three visible spectral channels, channel 22 (660 nm; red), channel 21 (545 nm; green), and channel 20 (460 nm; blue). The image renders colors similar to those seen by the human eye. The original resolution is 250 m.
The "vegetation index" in Fig. 2 is strictly designated as the Normalized Difference Vegetation Index (NVDI). The NDVI is designed to help us comprehend vegetation globally by a simple calculation using Earth-observation satellite data. It derives vegetation information using the fact that plant chlorophyll acts as a reflector, especially in the near-infrared region. The NDVI is devised to influence the scope of the observation area, and evaluate seasonal conditions. The mathematical formula is represented as NDVI=(NIR-VIS)/(NIR+VIS), and takes a value from -1 to 1. It takes a negative value for clouds and ice, 0 to 0.1 for bare land, and 0.1 to 0.7 for vegetation. NIR is the reflection intensity in the near-infrared region. VIS is that in the visible region. In Fig. 2, we used GLI channel 13 (673 to 683nm) for VIS, and channel 19 (860 to 870nm) for NIR.
|
|