Seen from Space 2004
Wave of Fresh Green Coloring the Northern Hemisphere
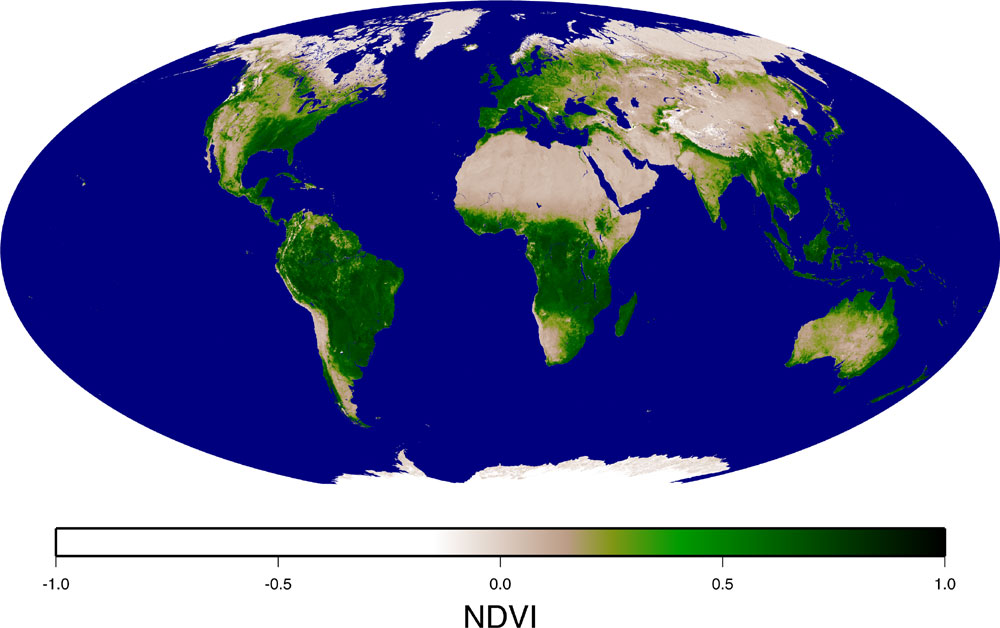
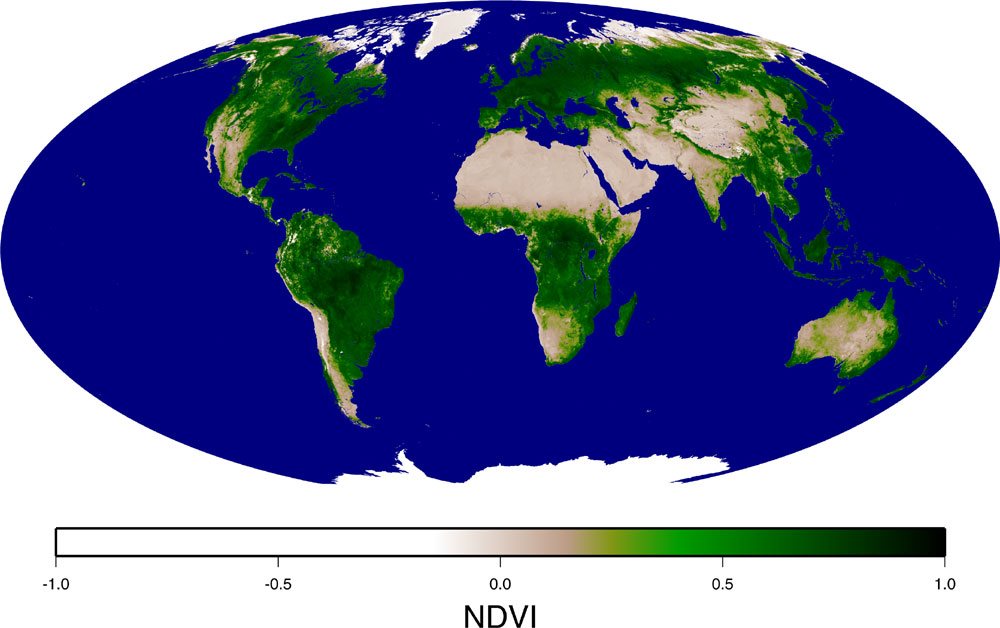
Most land surface is covered with some kind of vegetation. The vegetation could range from weeds several centimeters in height to trees several meters tall, and may include evergreen trees and deciduous trees. Earth-observation satellites often acquire photos of the distribution of vegetation over a wide area. We can use this satellite data to obtain a vegetation index that indicates the health of the vegetation. A large vegetation index translates into high levels of vegetation activities. Images 1 and 2 indicate NDVI (*), a vegetation index, acquired by GLI. The dark green color represents a high vegetation index. Comparing image 1 (2003/4/7-4/22) with image 2 (2003/5/25-6/9) of the northern Eurasia continent and North America, we can see the vegetation broaden and the land turning green from spring through the end of summer.
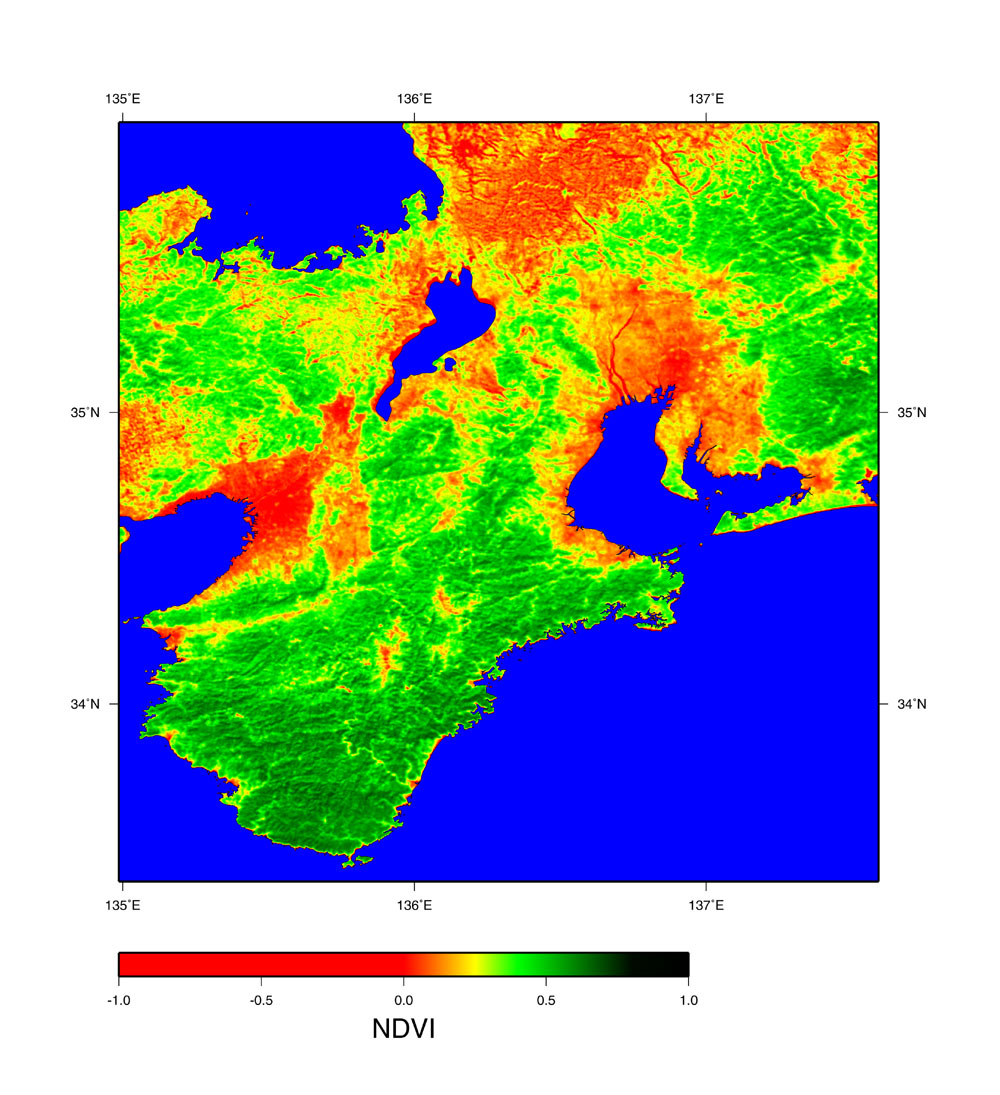
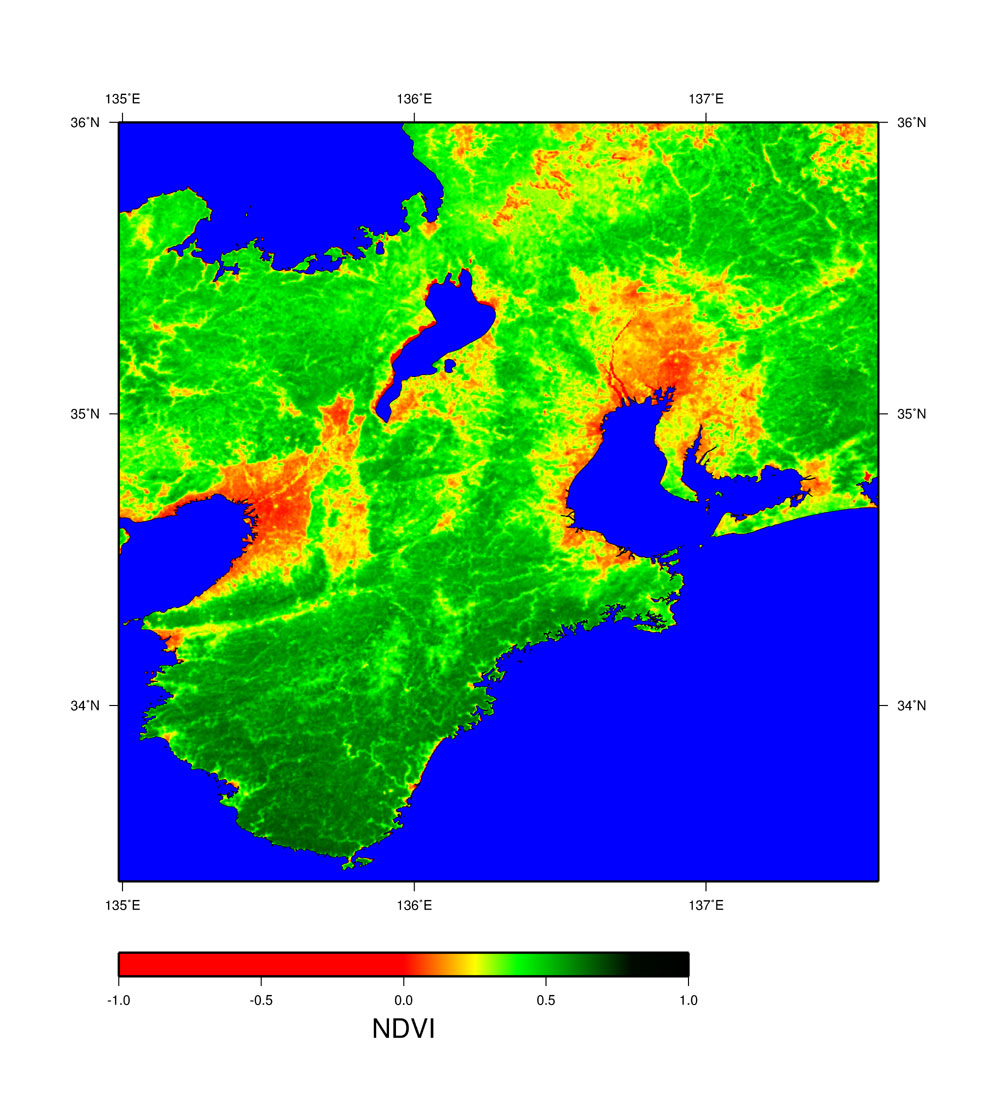
Images 3 and 4 acquired by GLI in higher resolution indicate the vegetation of Kii Peninsula. Dark green represents a high vegetation index, and dark red represents a low vegetation index. Comparing image 3 (2003/2/7) with image 4 (2003/4/17), we can see the fresh green of spring spreading, especially in the mountains north of Lake Biwa, around Lake Biwa, and south of Kii Peninsula. We can also see that Osaka and Nagoya have little vegetation throughout the seasons. It is important to remember to use sensors with different resolutions and different wavelengths when observing vegetation using satellites. GLI on Midori-II can observe local and widespread changes in vegetation by varying its resolution and wavelength. NDVI of GLI 1km is a high-order land area standard product. (*)NDVI (Normalized Difference Vegetation Index) NDVI is an index designed to help us comprehend vegetation globally by a simple calculation using Earth-observation satellite data. It derives vegetation using the fact that chlorophyll in plants acts as a reflector especially in the near-infrared region. NDVI is devised to influence the scope of the observation area, and evaluate observation conditions during the seasons . In a mathematical formula, it is represented as NDVI=(NIR-VIS)/(NIR+VIS) and takes a value from -1 to 1. It takes a negative value for clouds and ice, 0 to 0.1 for bare land, and 0.1 to 0.7 for vegetation. NIR is reflection intensity in the near-infrared region. VIS is that in the visible region. In images 1 and 2, we used GLI channel 13 (673 to 683nm) for VIS and channel 19 (860 to 870nm) for NIR. In images 3 and 4, we used channel 22 (630 to 690nm) for VIS and channel 23 (770 to 880nm) for NIR. |
|||||||||||||