Seen from Space 2014
Preservation of Biodiversity
- Coral Reef of Ourawan Bay, Nago City, Okinawa -
|
2013 marked the 20th anniversary of the Earth Summit*1, in which global environmental concerns rose to the forefront and became a major issue. In this column, “Seen from Space,” biodiversity-related topics are introduced. Because the availability of oceanic environmental information is significantly less than that of land, it is critical to take advantage of the opportunity provided by such data. The existence of wide-ranging oceanic environmental information; such as geophysical data of seabed topography, ocean currents, and distribution survey maps of the lives and habitats of ocean-dwelling organisms; makes it imperative to fully study the existing archived data sets acquired through past research and to comprehensively and expeditiously extract and verify such information. 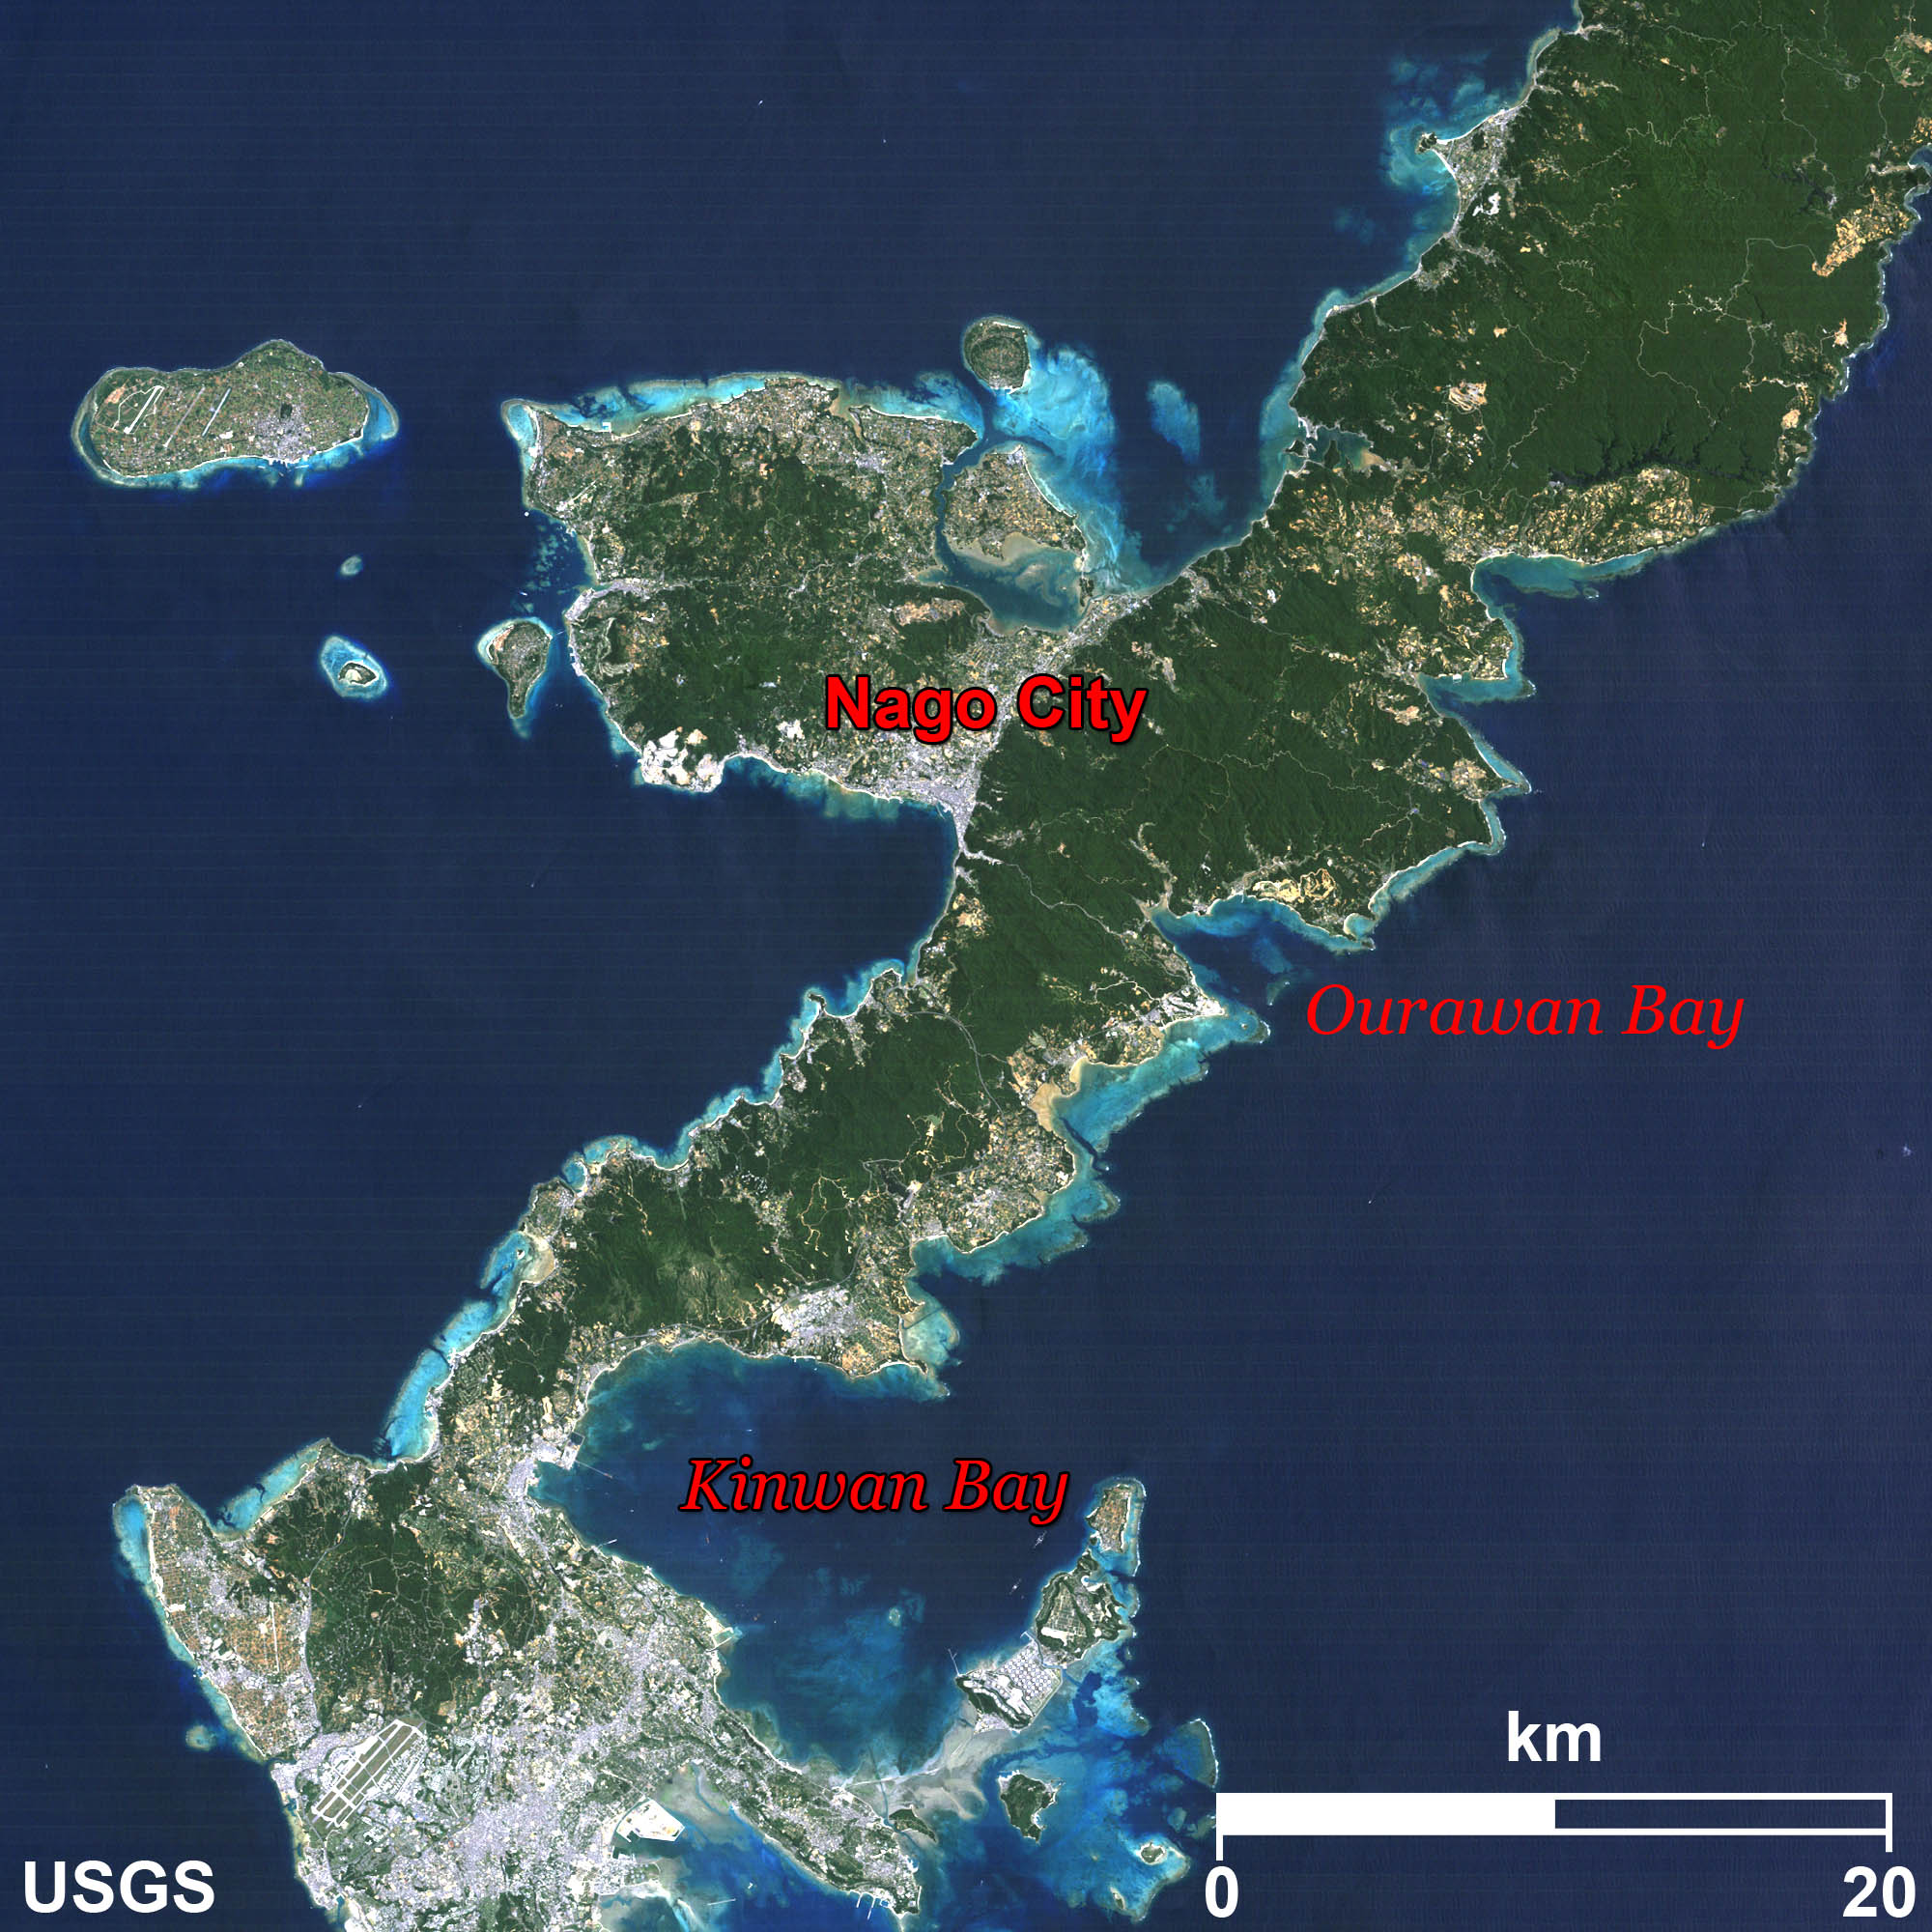 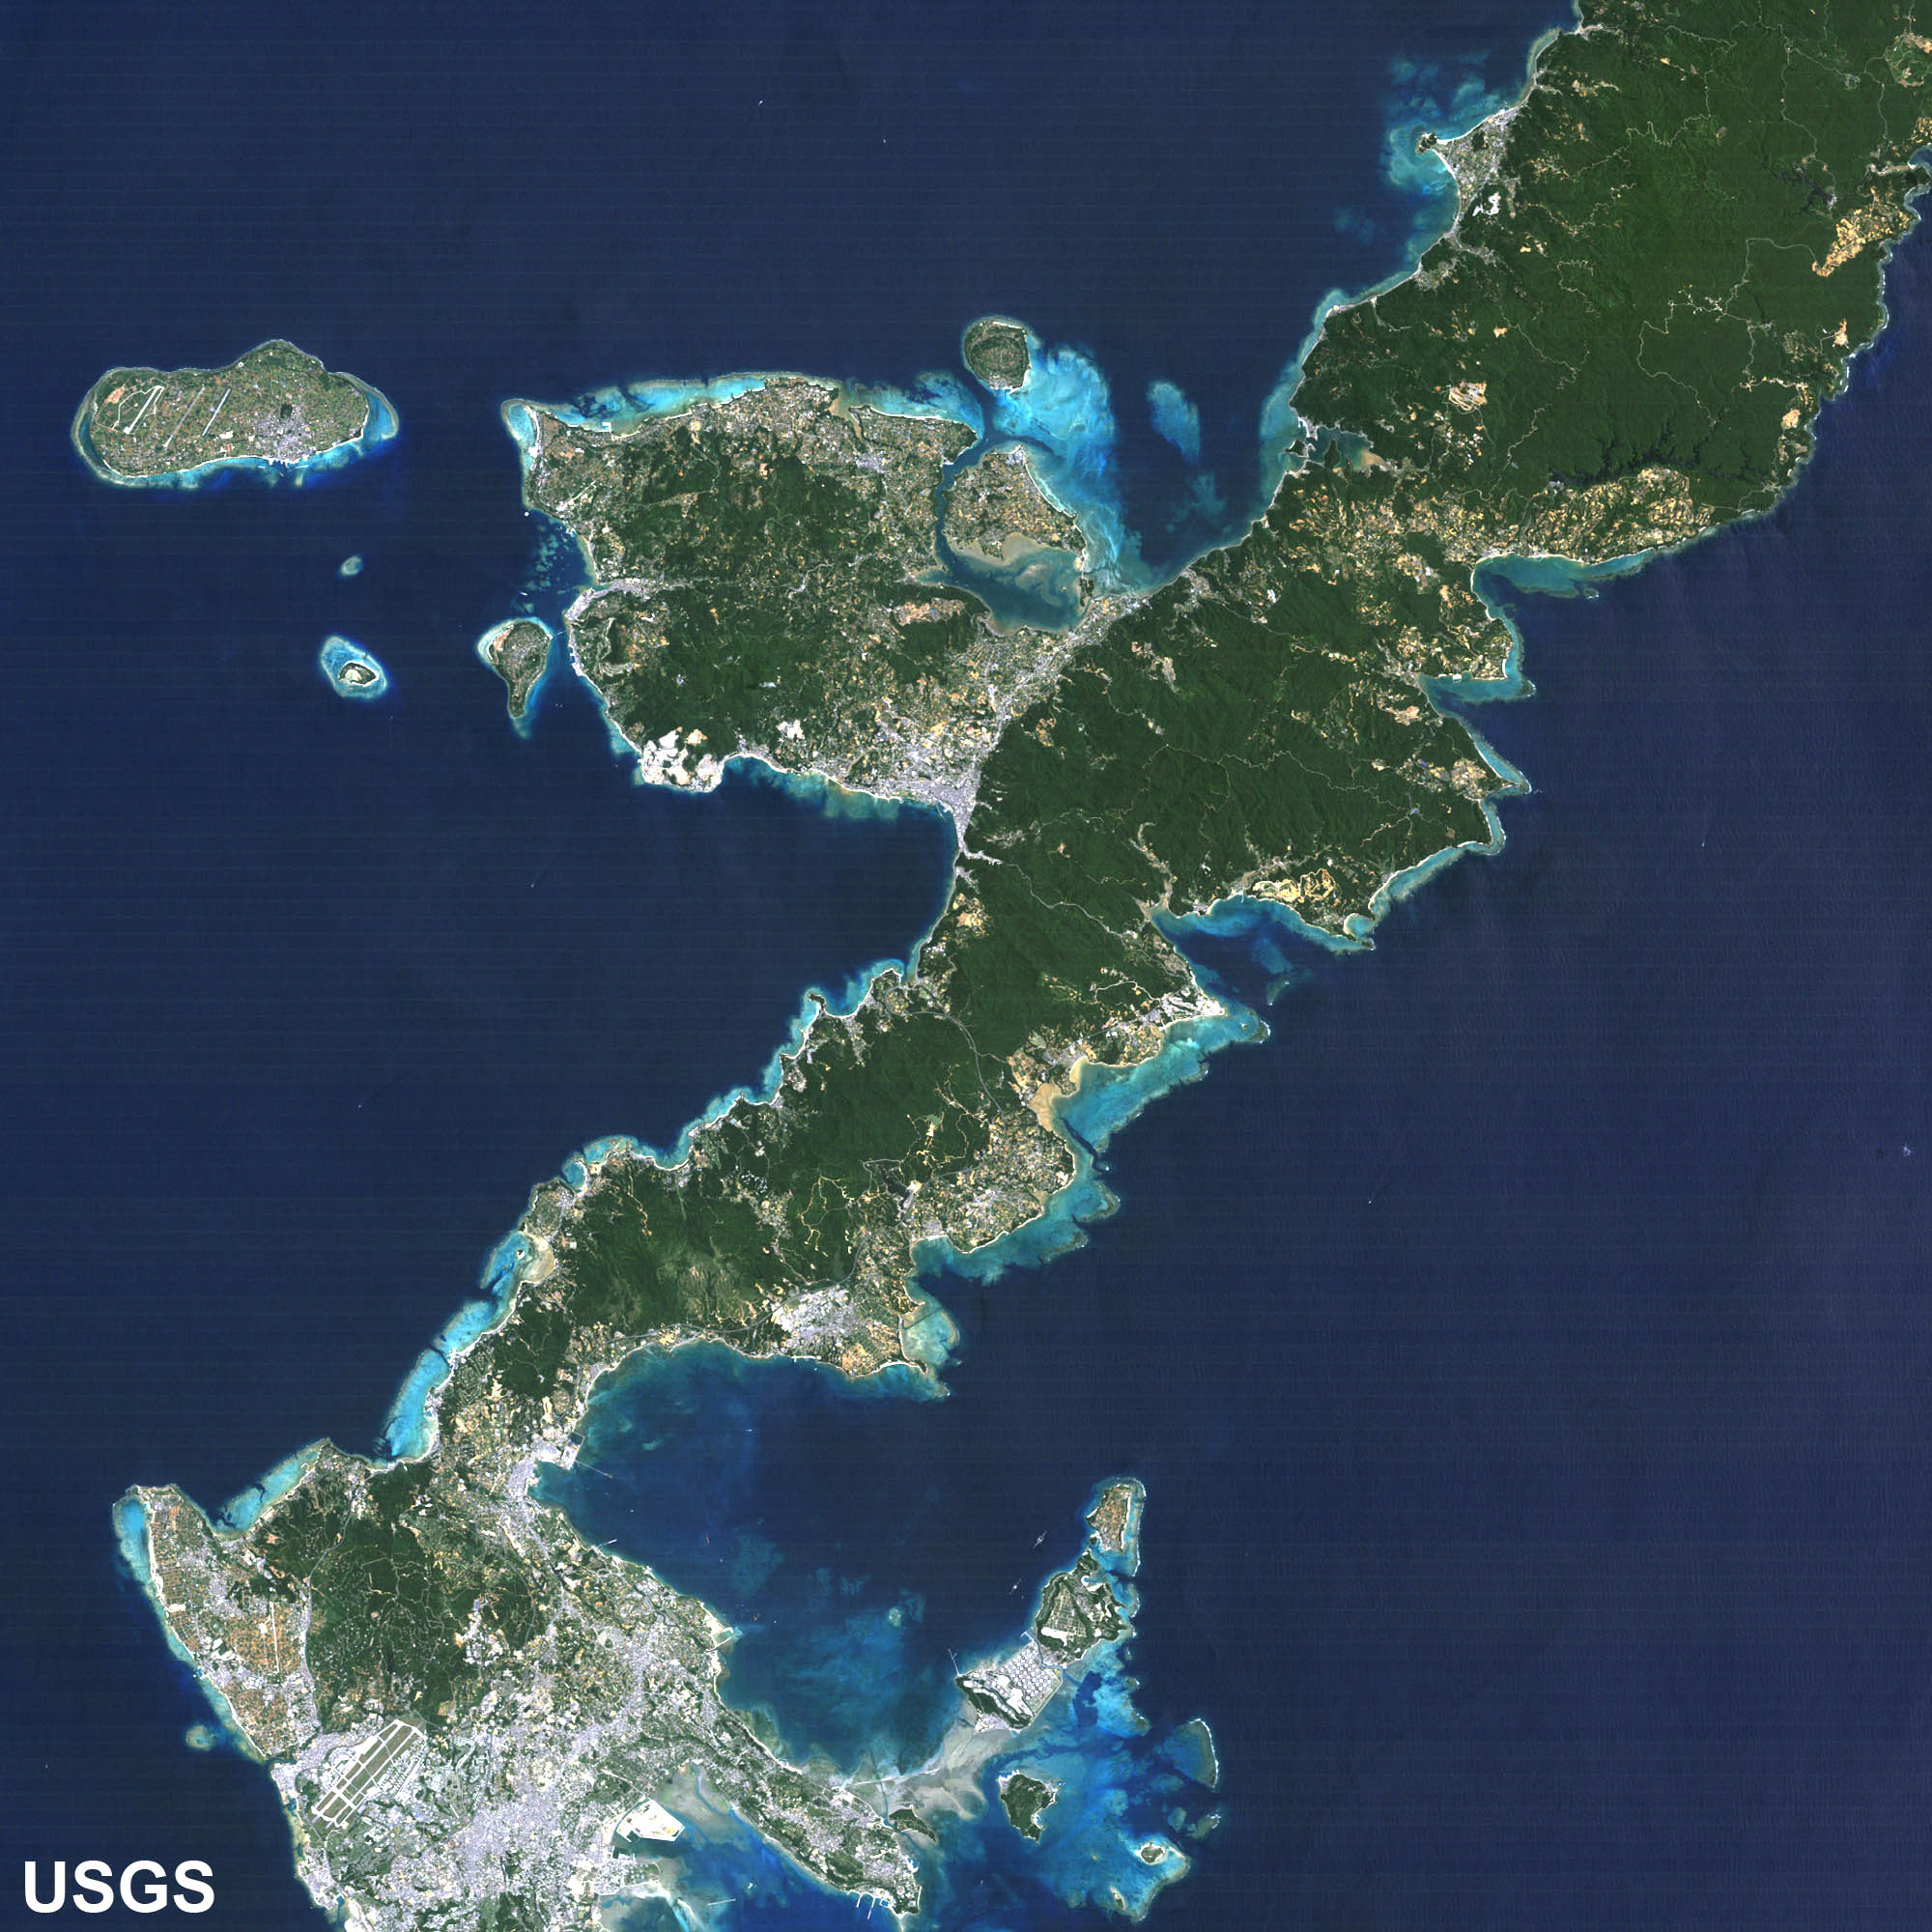
In May 1992, the main island of Okinawa observed by Landsat *3–5 is shown in Fig. 1. The blue area along the seashore appears to indicate an area of shallow water surrounded by coral reefs. In the view from space, in sunlight on a clear day, the long wavelength light in red tends to be absorbed first by ocean water. Conversely, the blue light in the deeper sea of more than 10 m in depth and its corresponding reflection can be observed. Therefore, in a coral reef area, color tone changes slightly from emerald green, which can be seen under the seashore and shallow water area with white sands, to deep blue, depending on the depth. 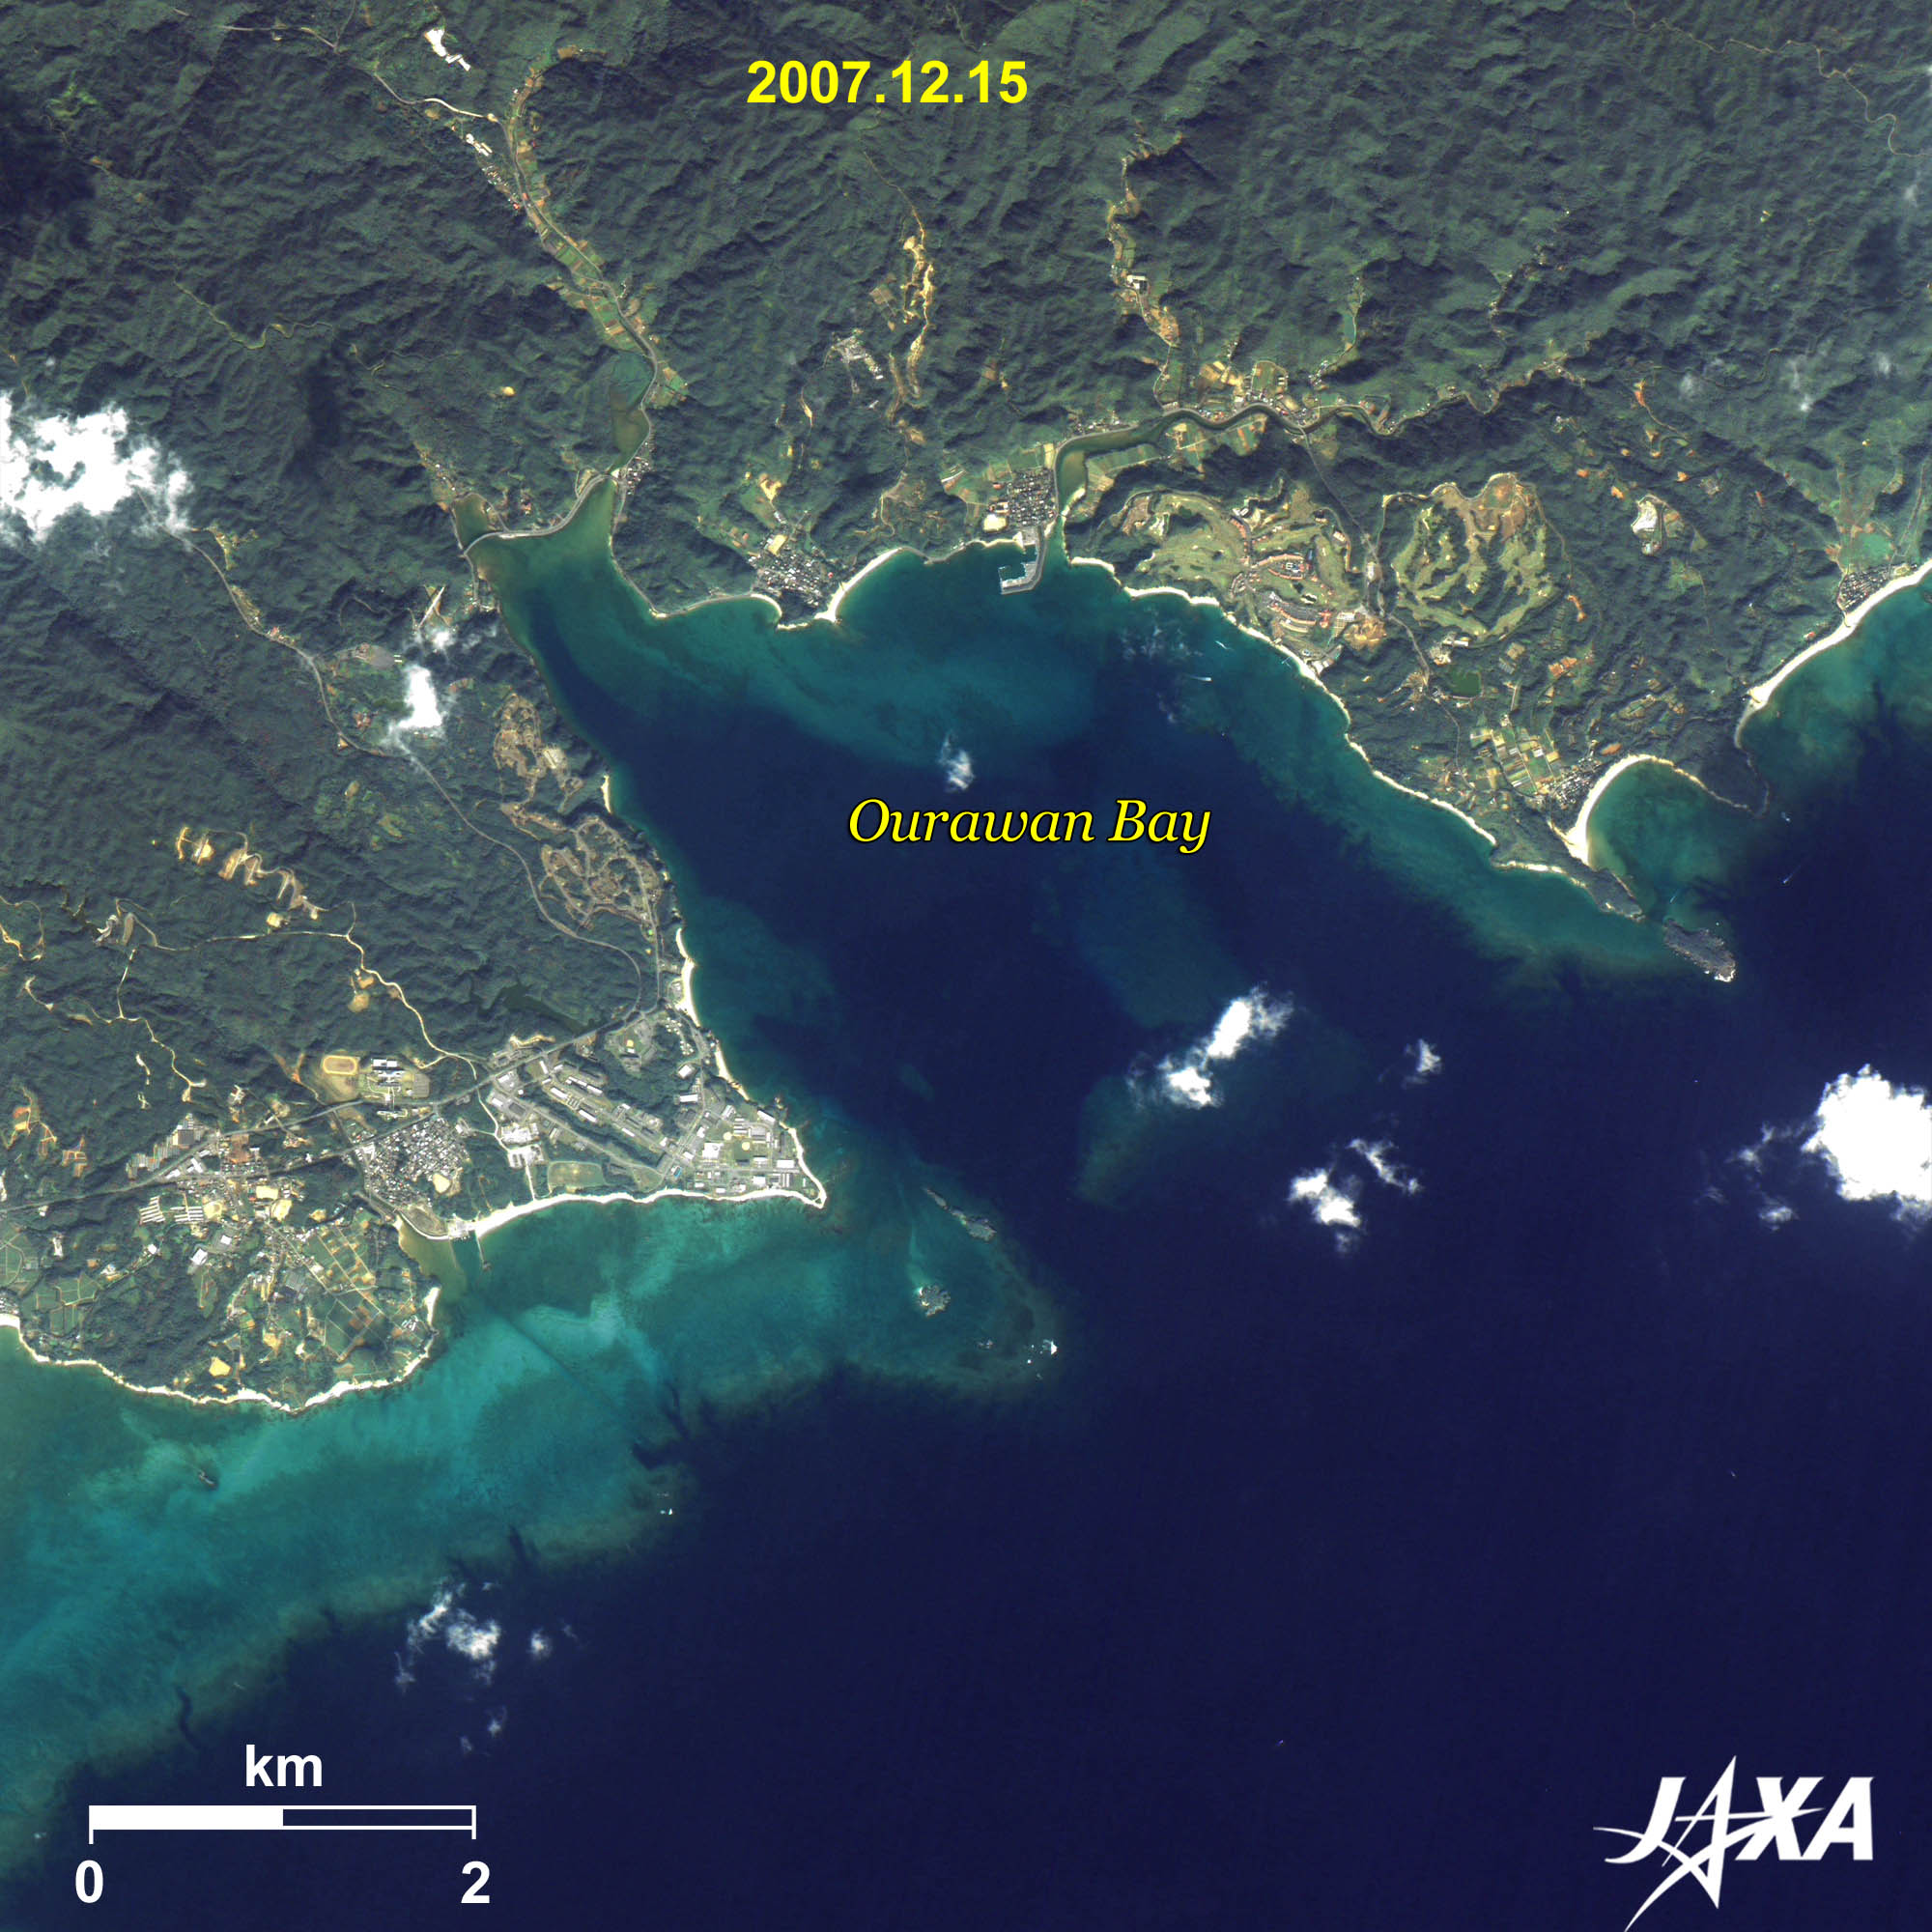 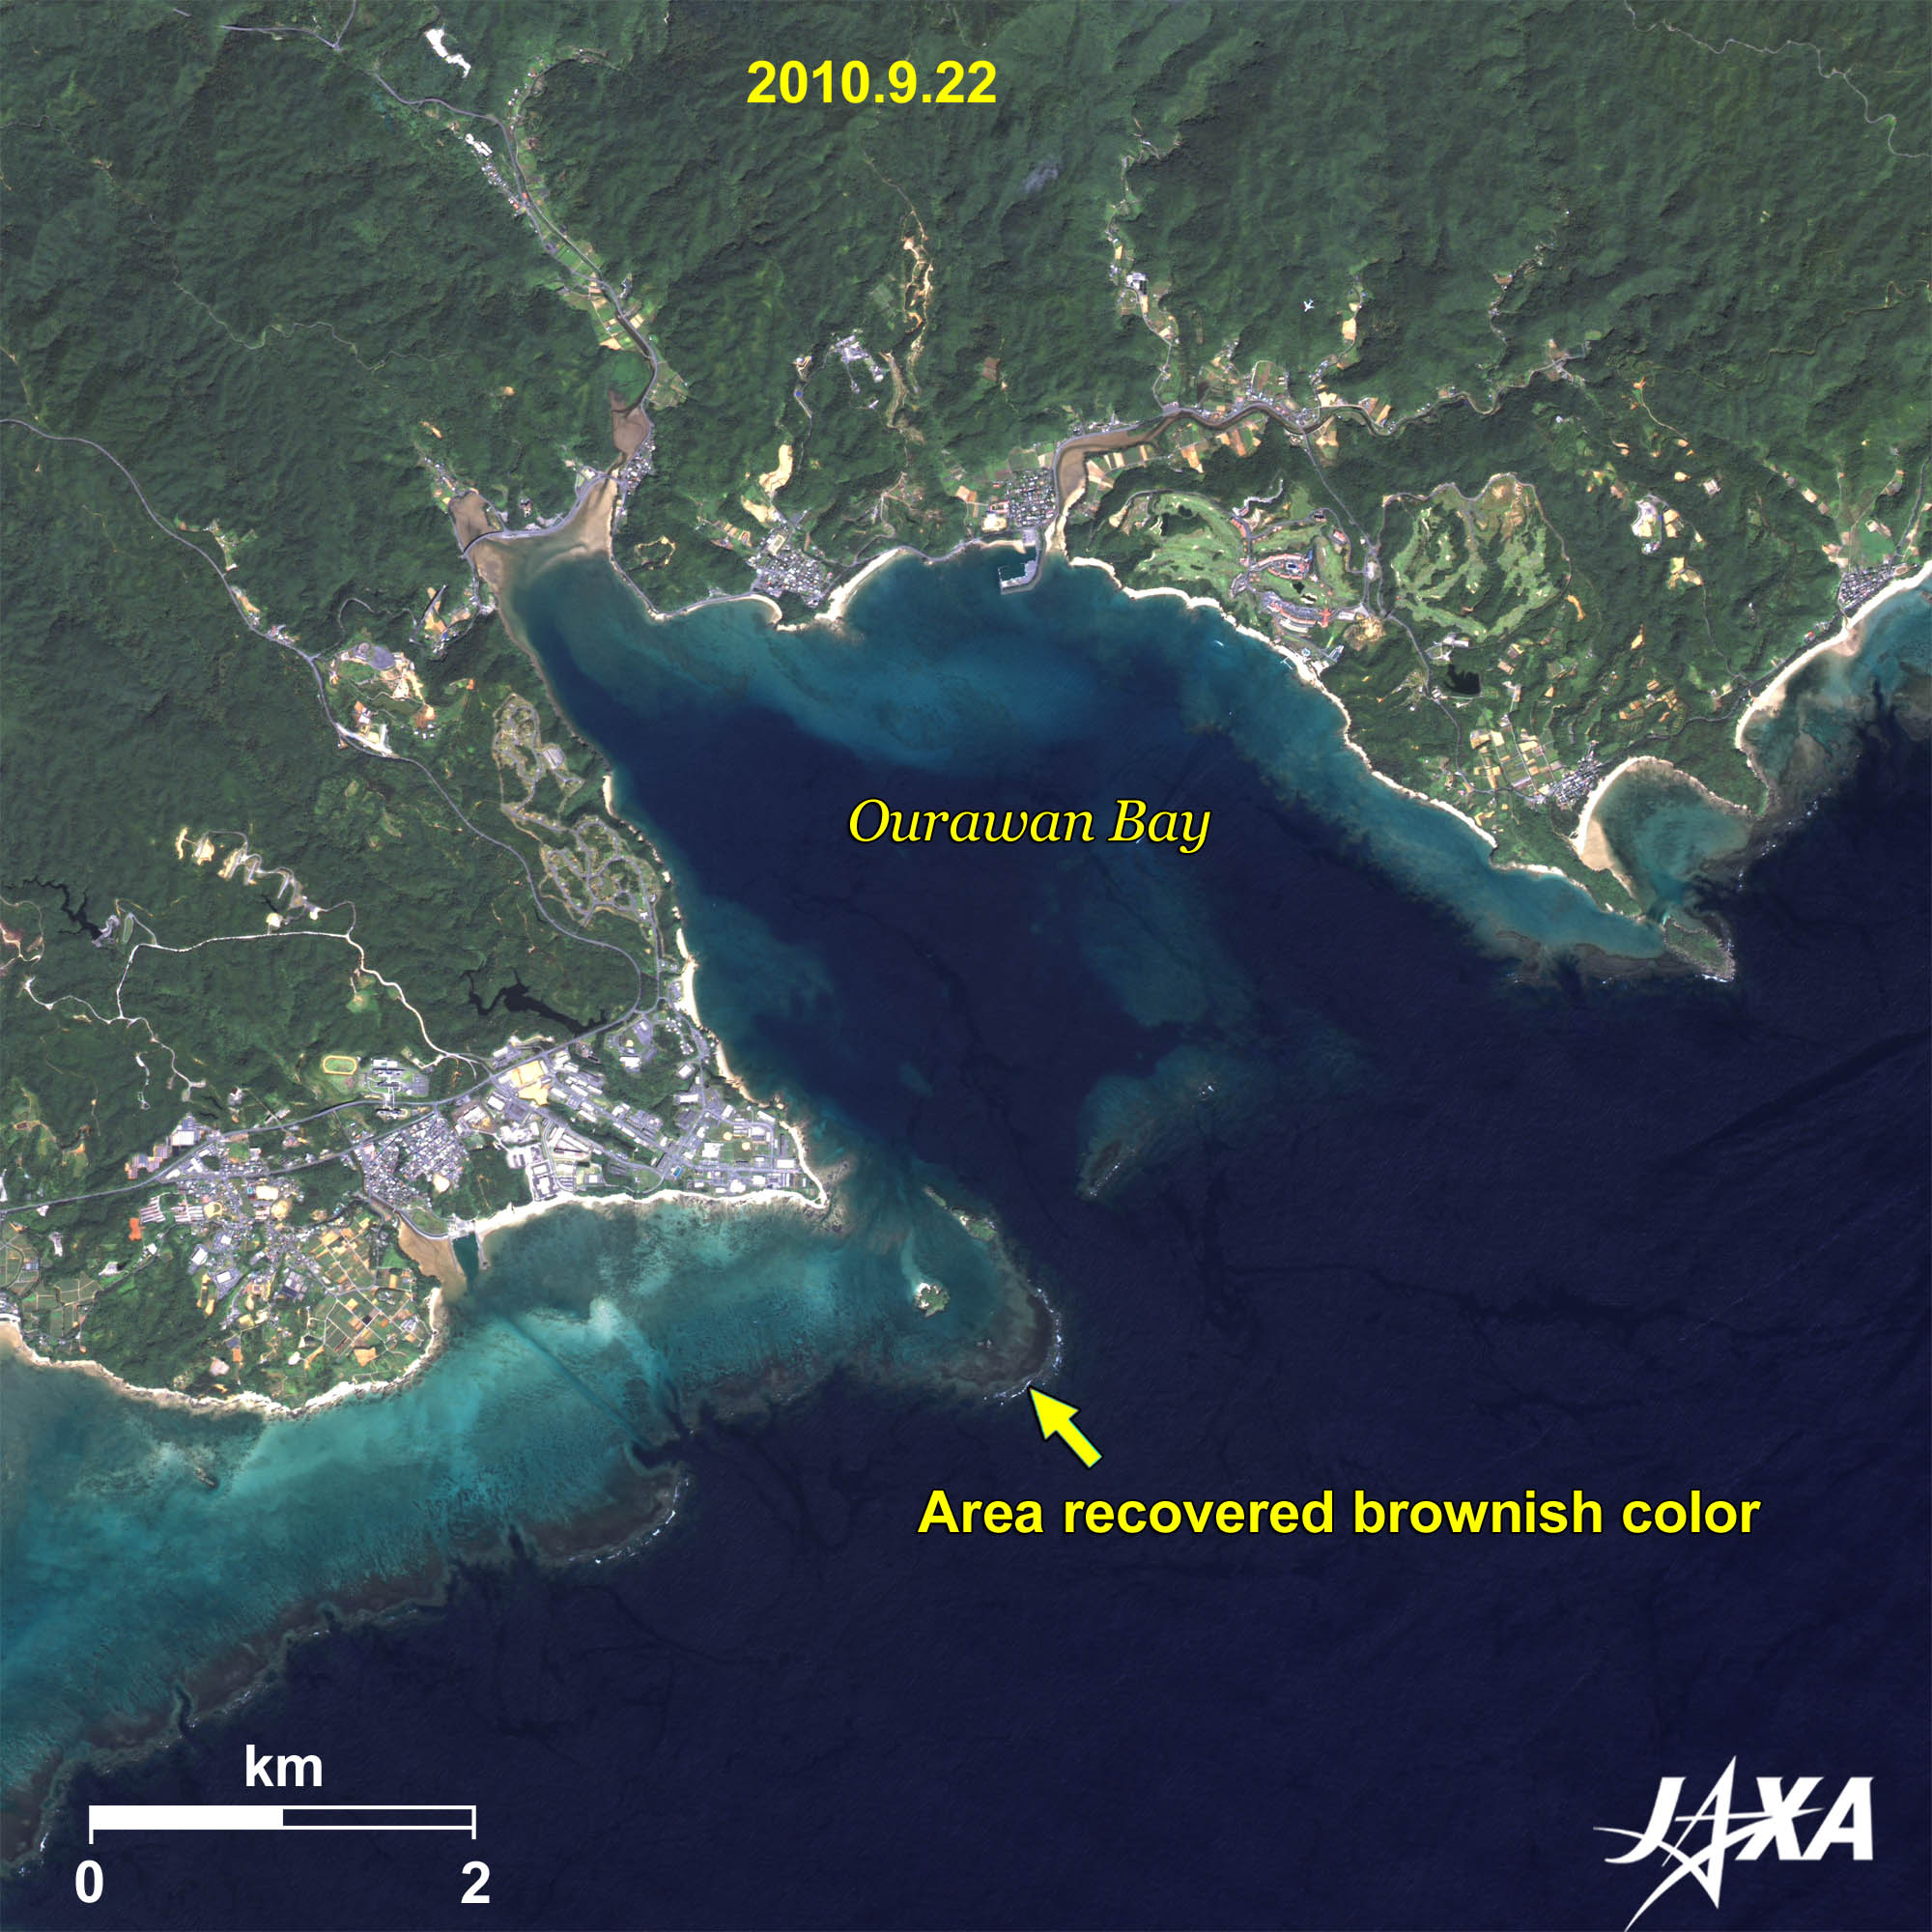 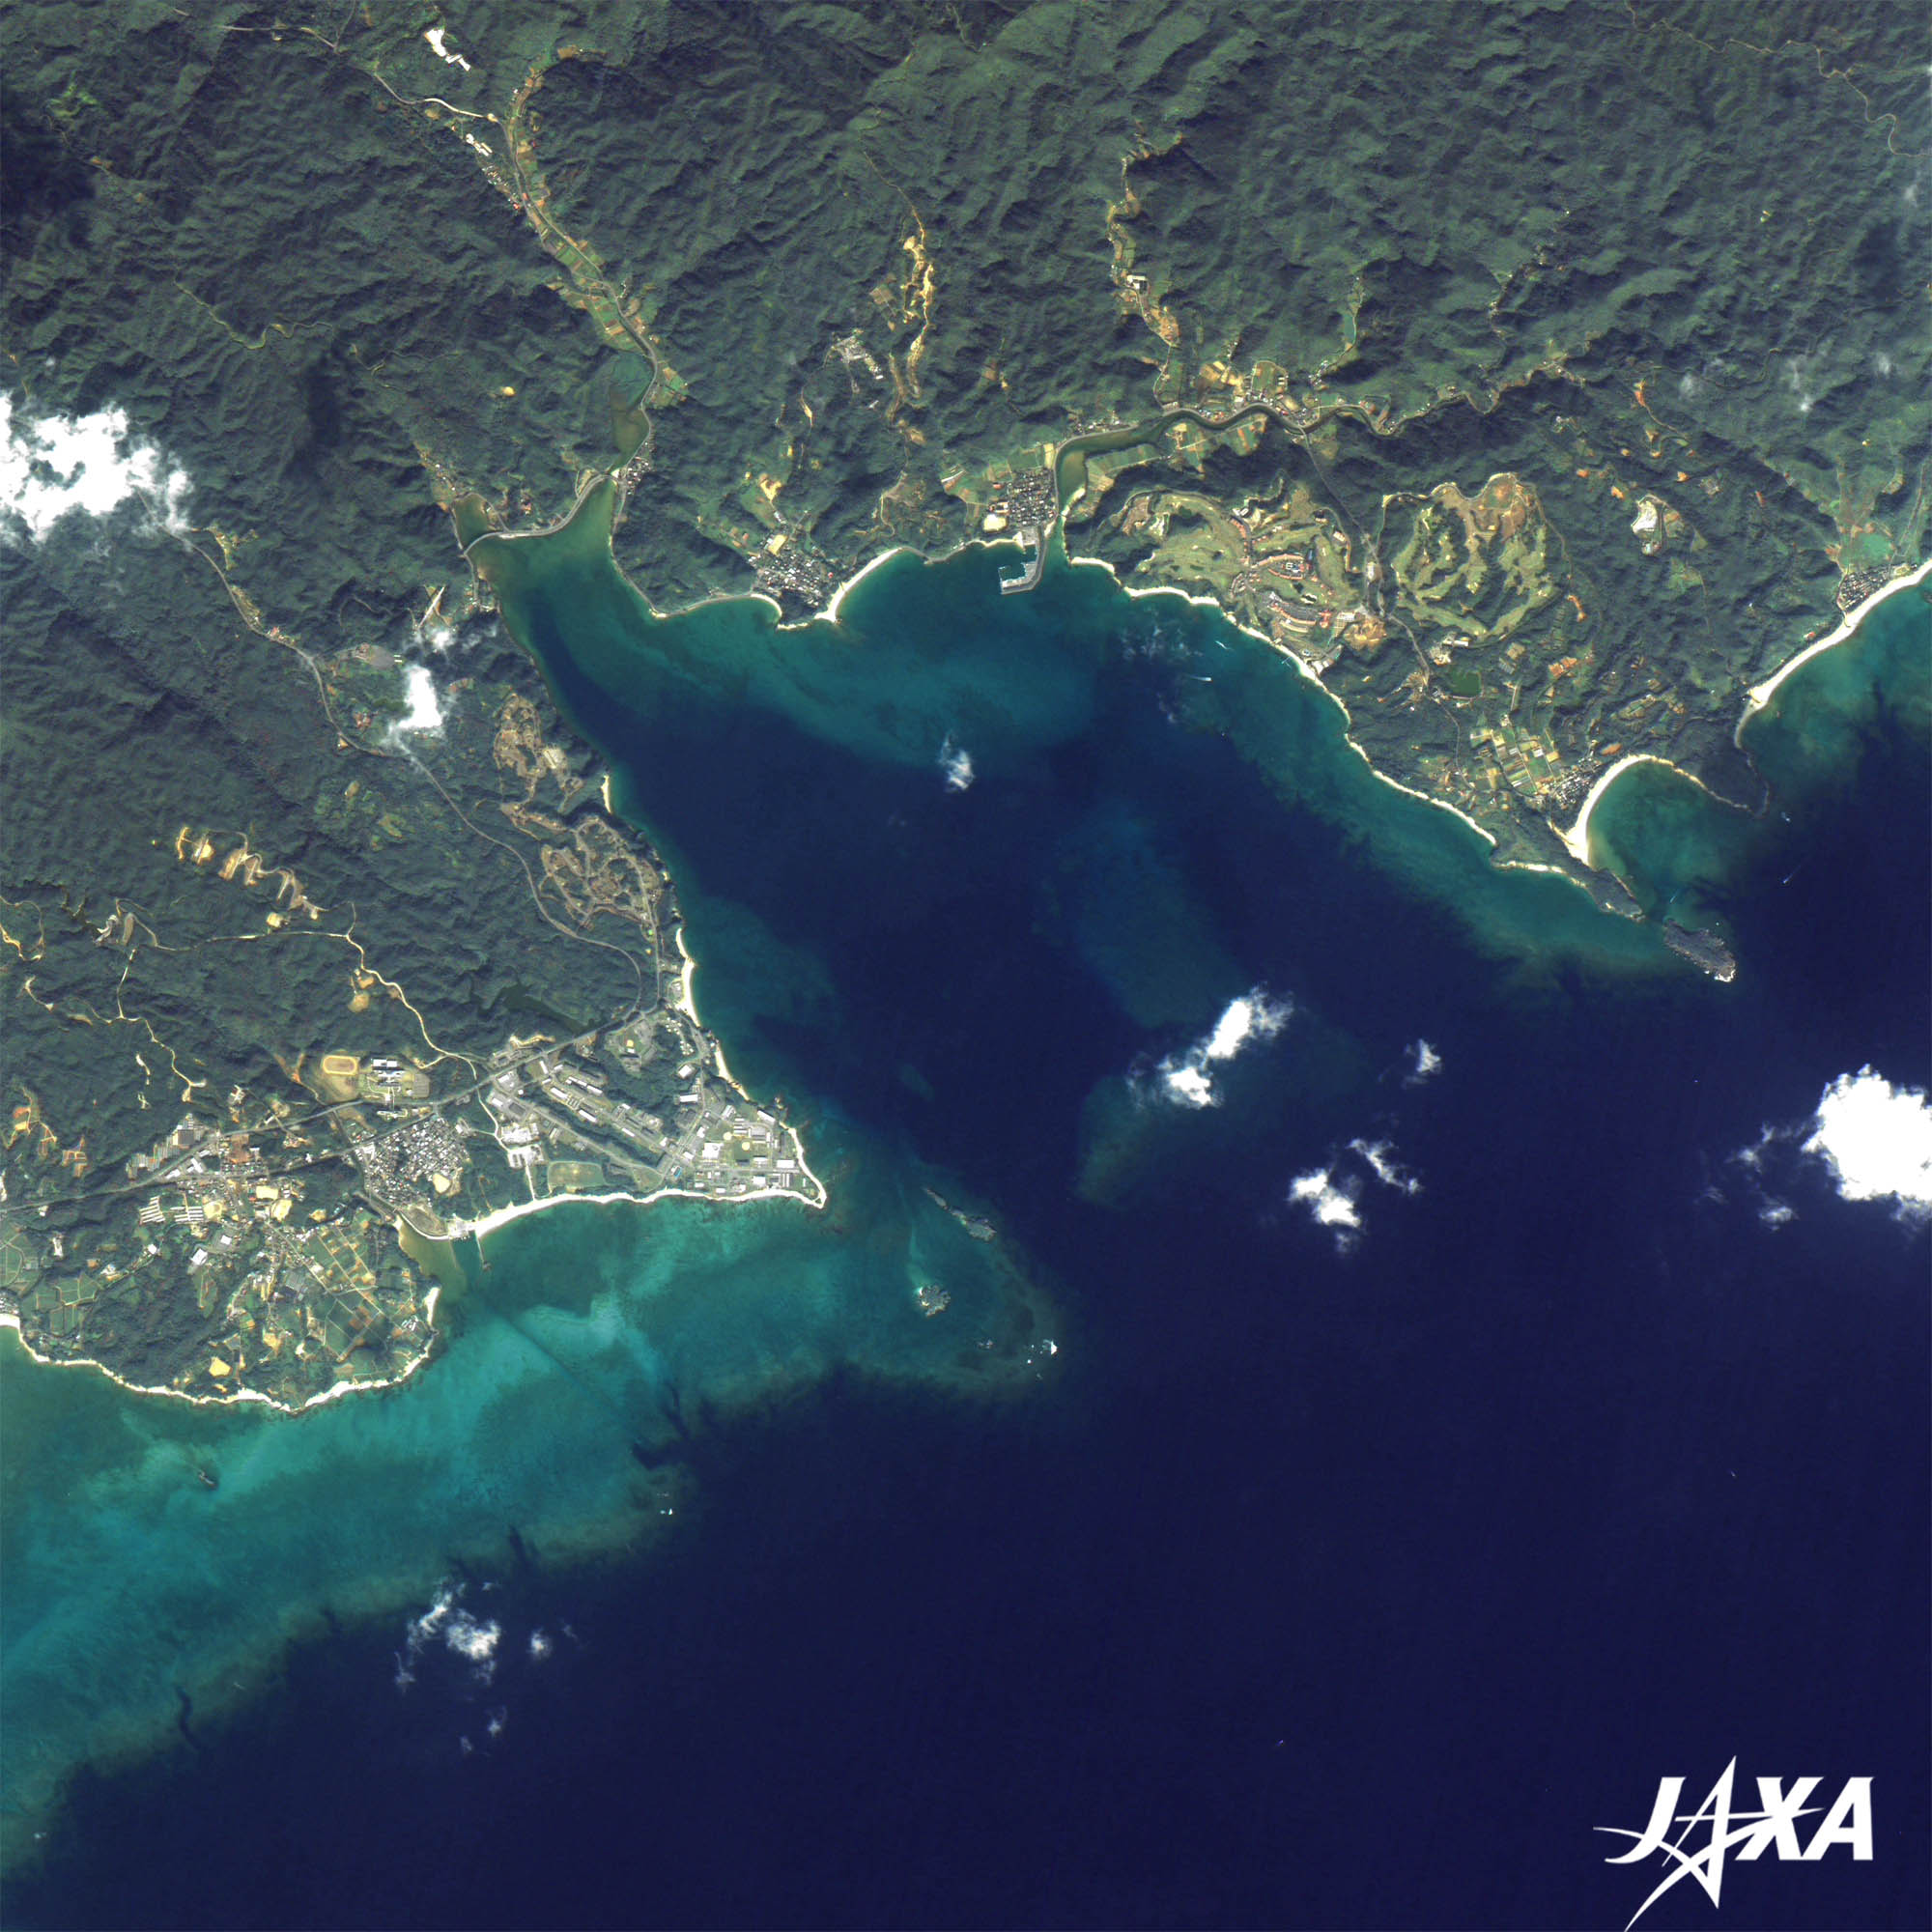 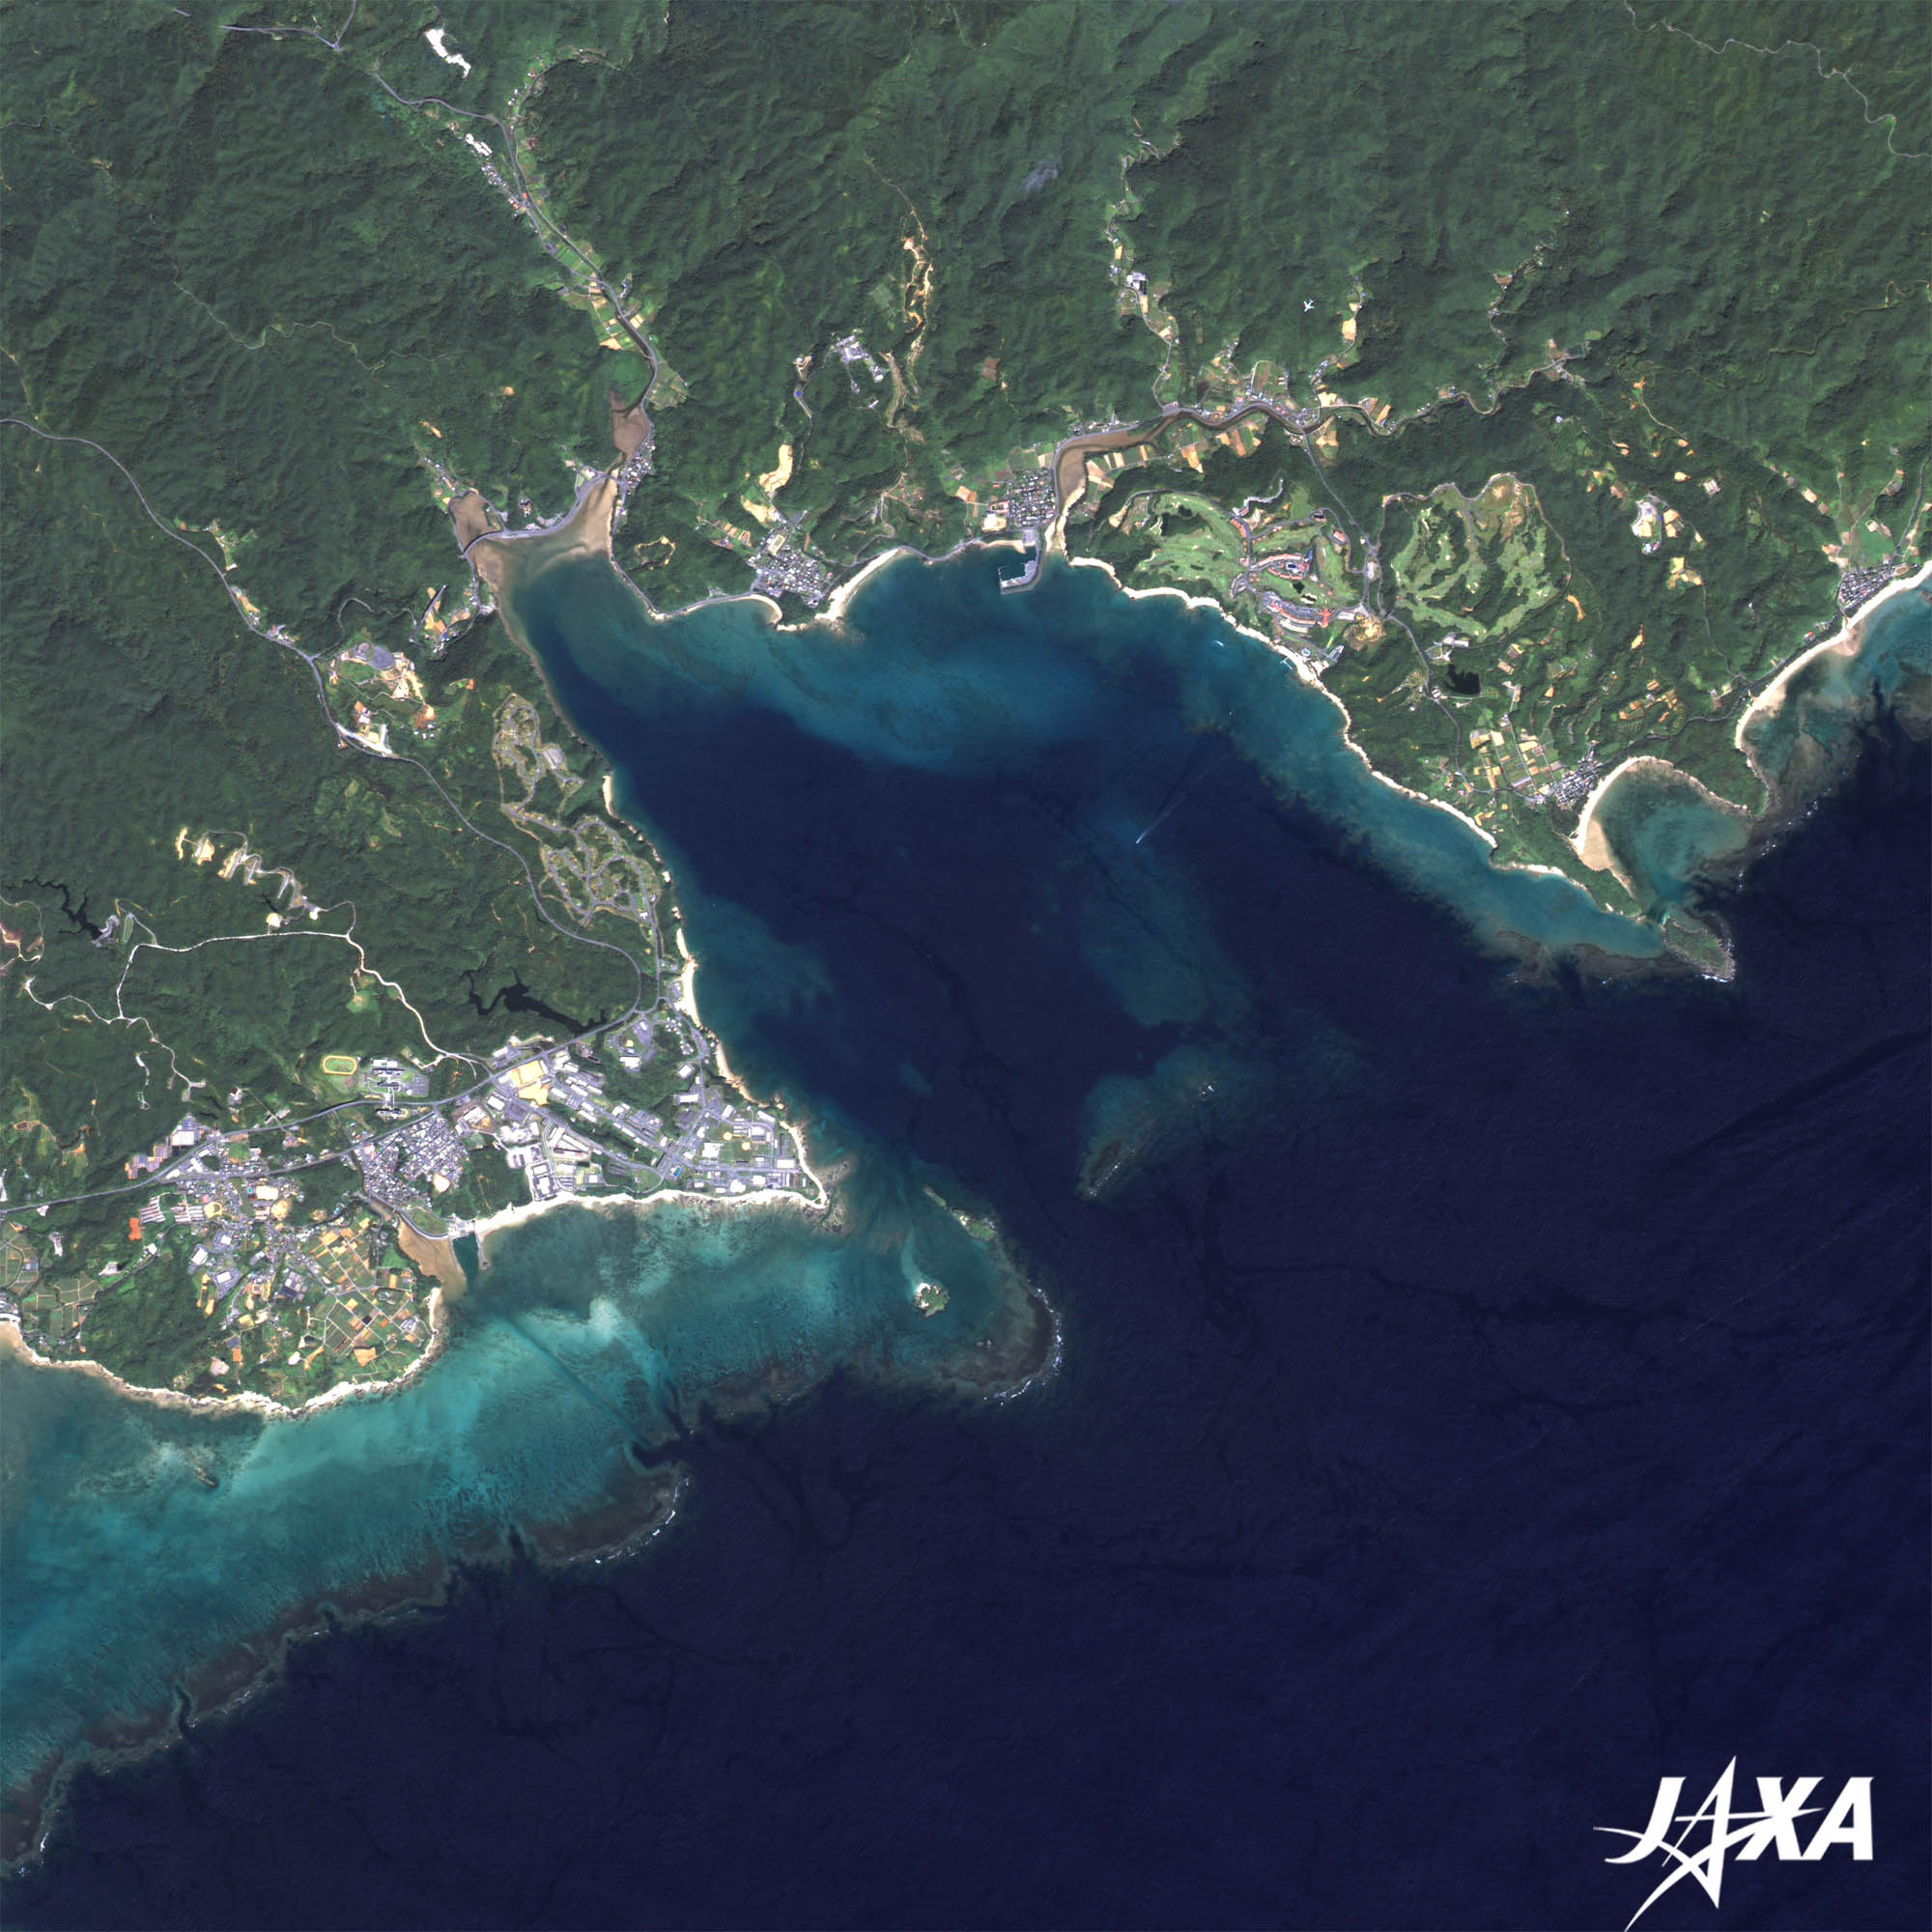
Images of Ourawan Bay obtained by the Advanced Land Observation Satellite (ALOS; Daichi) in December 2007 and September 2010 are shown in Fig. 2. In these images of the eastern coast of Nago, Okinawa main island, there can be seen a fully diverse environment spreading from the deep sea facing the open sea, coral reefs, underwater forests of marine plants (Thalassia and Halophila) and seaweed varieties; up to the inner section of the V-shaped Ourawan Bay, home to mangrove forests and mud flats along the mouths of the Oura and Teima rivers. In an environment with such varied and unique ecosystems, this so-called rich biodiversity was created with blue coral (Heliopora coerulea) community at Chiribishi and Dugong. On the coast of Okinawa Island, there have been occurrences of red-soil erosion, reclamation, outbreaks of starfish Onihitode (Acanthaster planci), and the bleaching of coral, which have caused a decrease in coral proliferation. However, Ourawan Bay is considered an area in which rich biodiversity maintenance can be achieved because of its unique surrounding geography and natural resources. In Fig. 2, this recovery is evident by its change from a whitish color in 2007 to a brownish color in 2010, as in 1992, on the edge of the coral reef along the west edge of Ourawan Bay. During recent planetary observation from space, onboard satellite sensors have been evolving to fill the coastal zone information gap. By using a blue light, which has high transmittance in water, observation performance is enhanced to map land cover on the ocean bottom and bathymetry, and the information collected by monitoring variations in coastal environments are considered to be a useful in planning biodiversity conservation. The successor to the Advanced Land and Observation Satellite (ALOS) with optical sensors is considered as a suitable tool for studying widely distributed coral regions along coastal zones through consistently high-resolution images with wide-swath width coverage capability in a single system, which is unique to advanced optical remote-sensing technology in Japan. The availability of public data for mapping biodiversity by using the successor to ALOS with optical sensors has become more critical for countries such as members of the Association of Southeast Asian Nations (ASEAN) and is expected to be a high-profile international contribution from Japan (Reference 5). 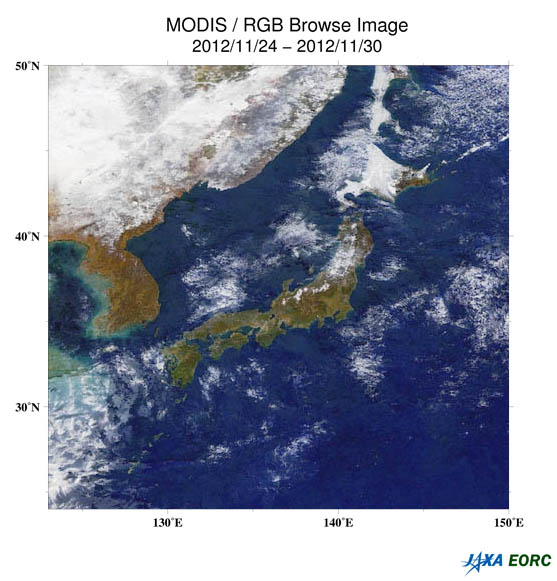
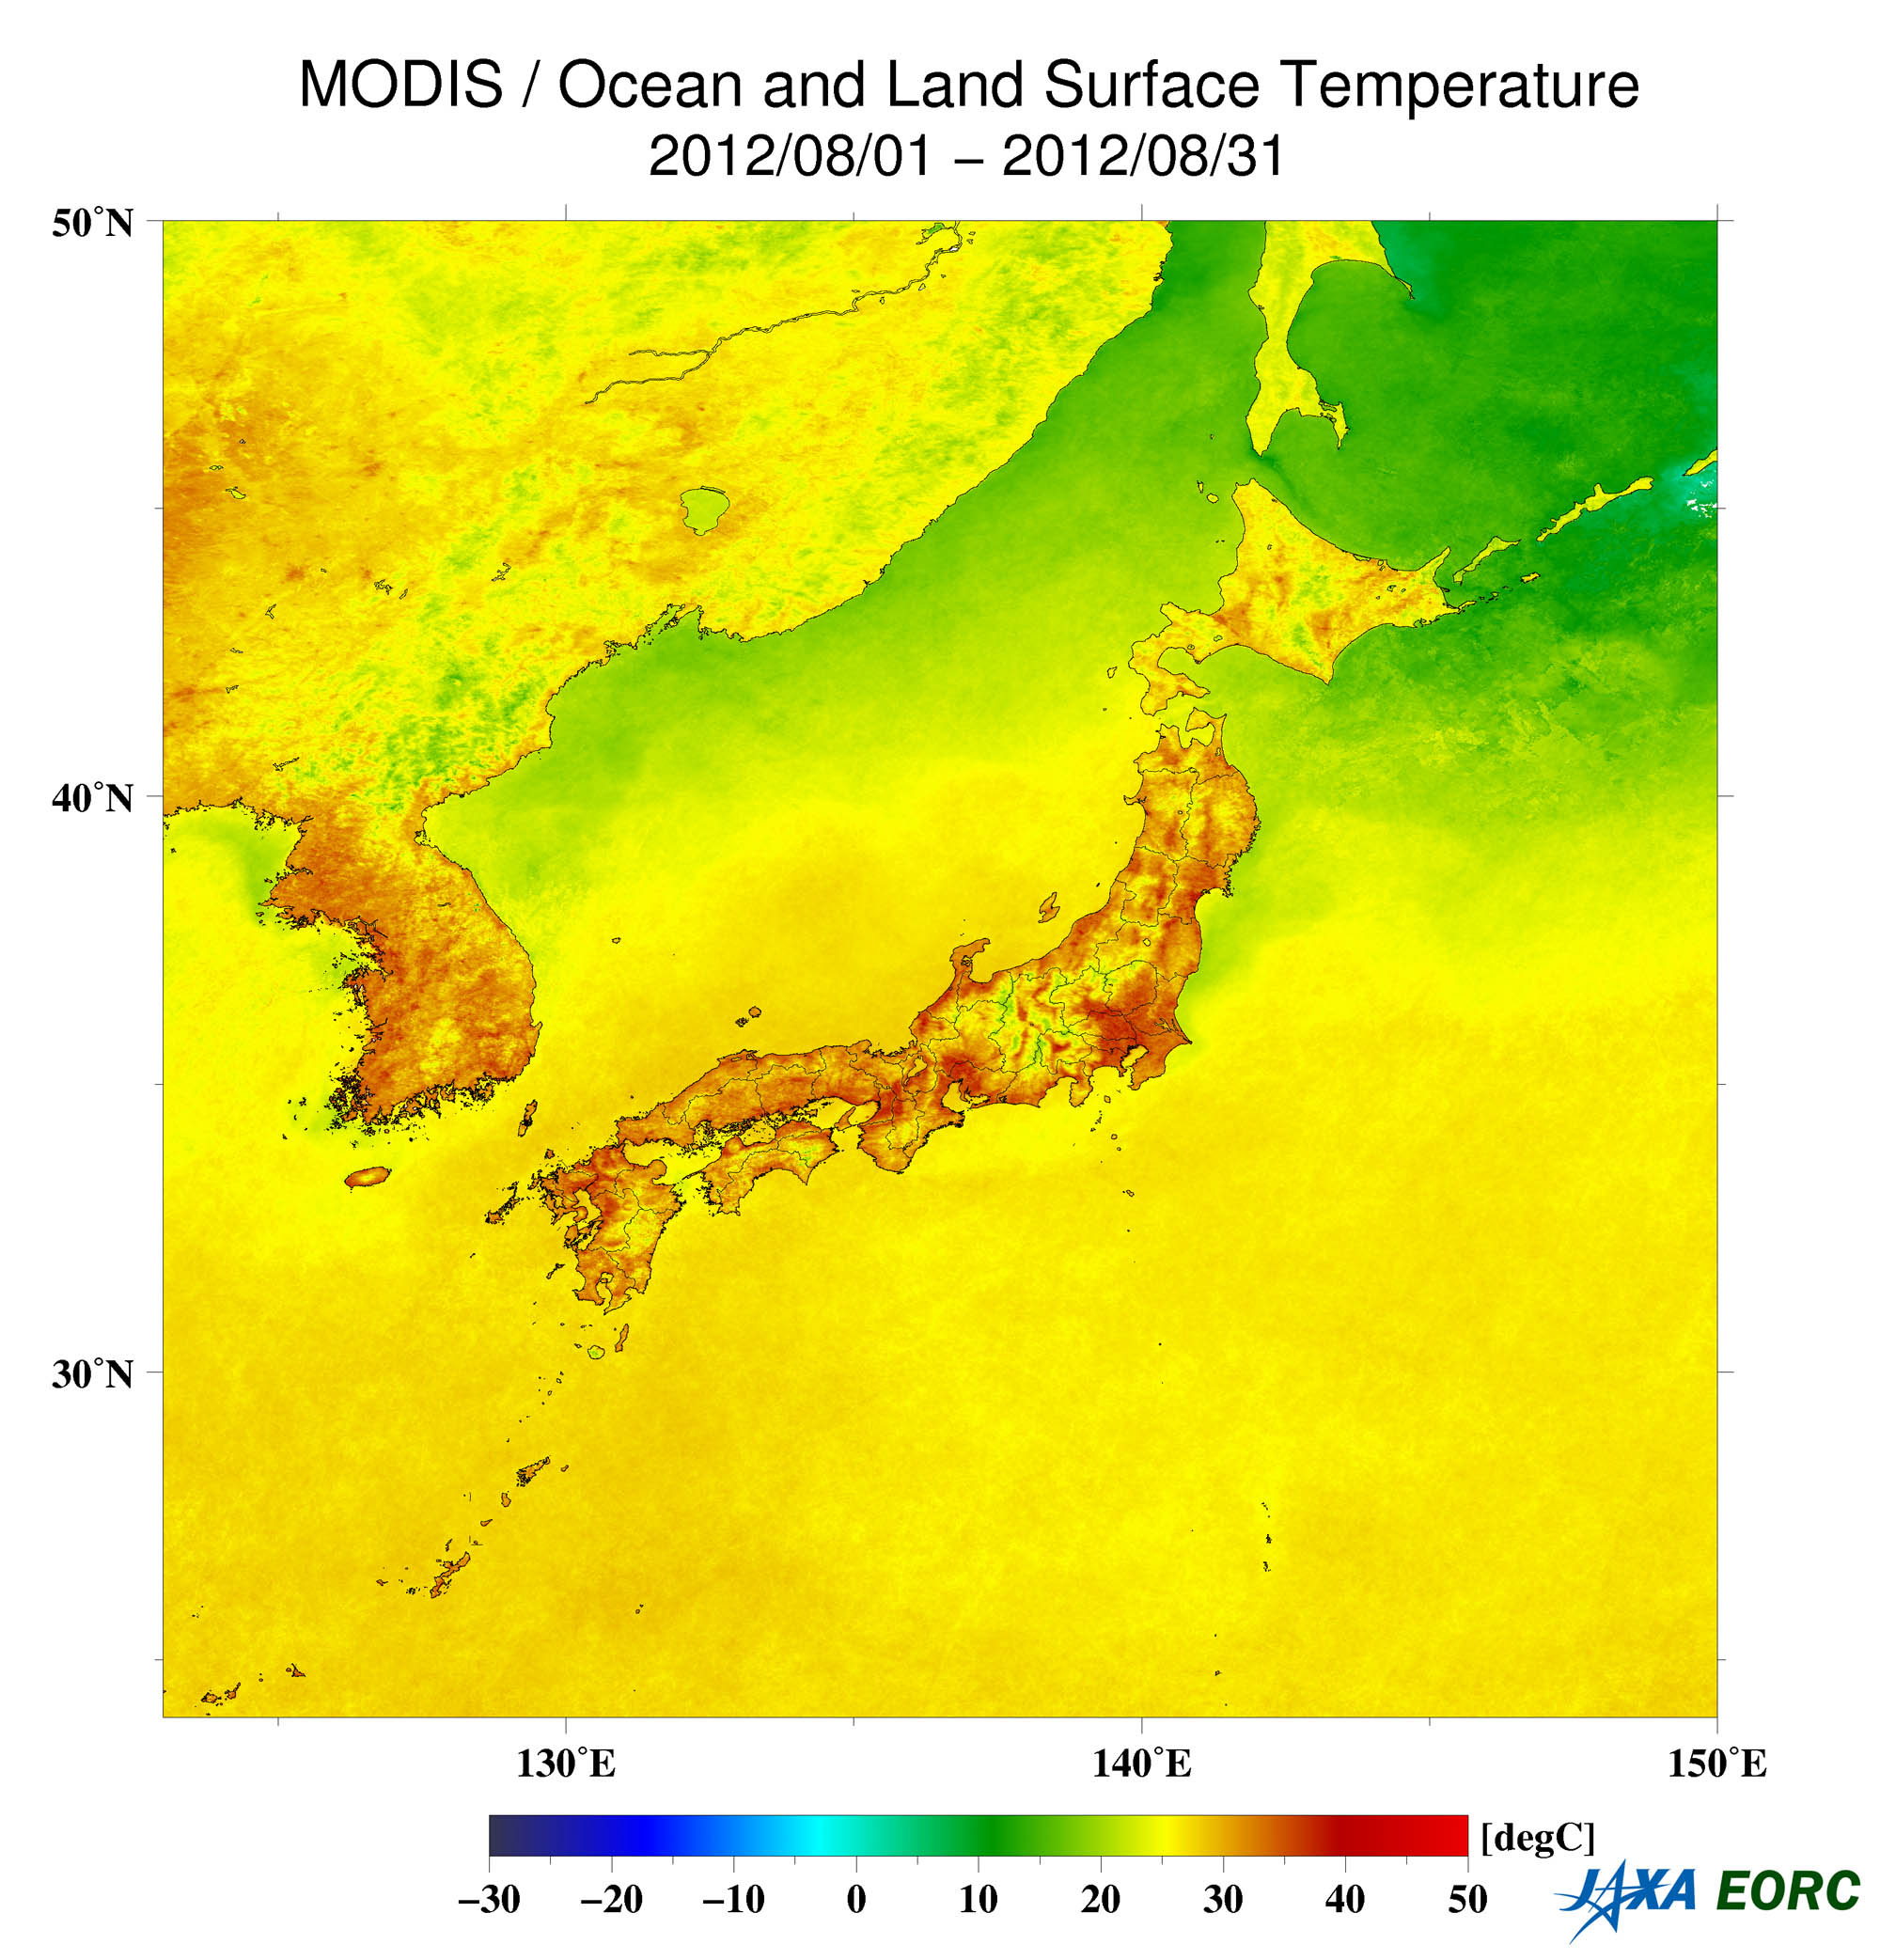 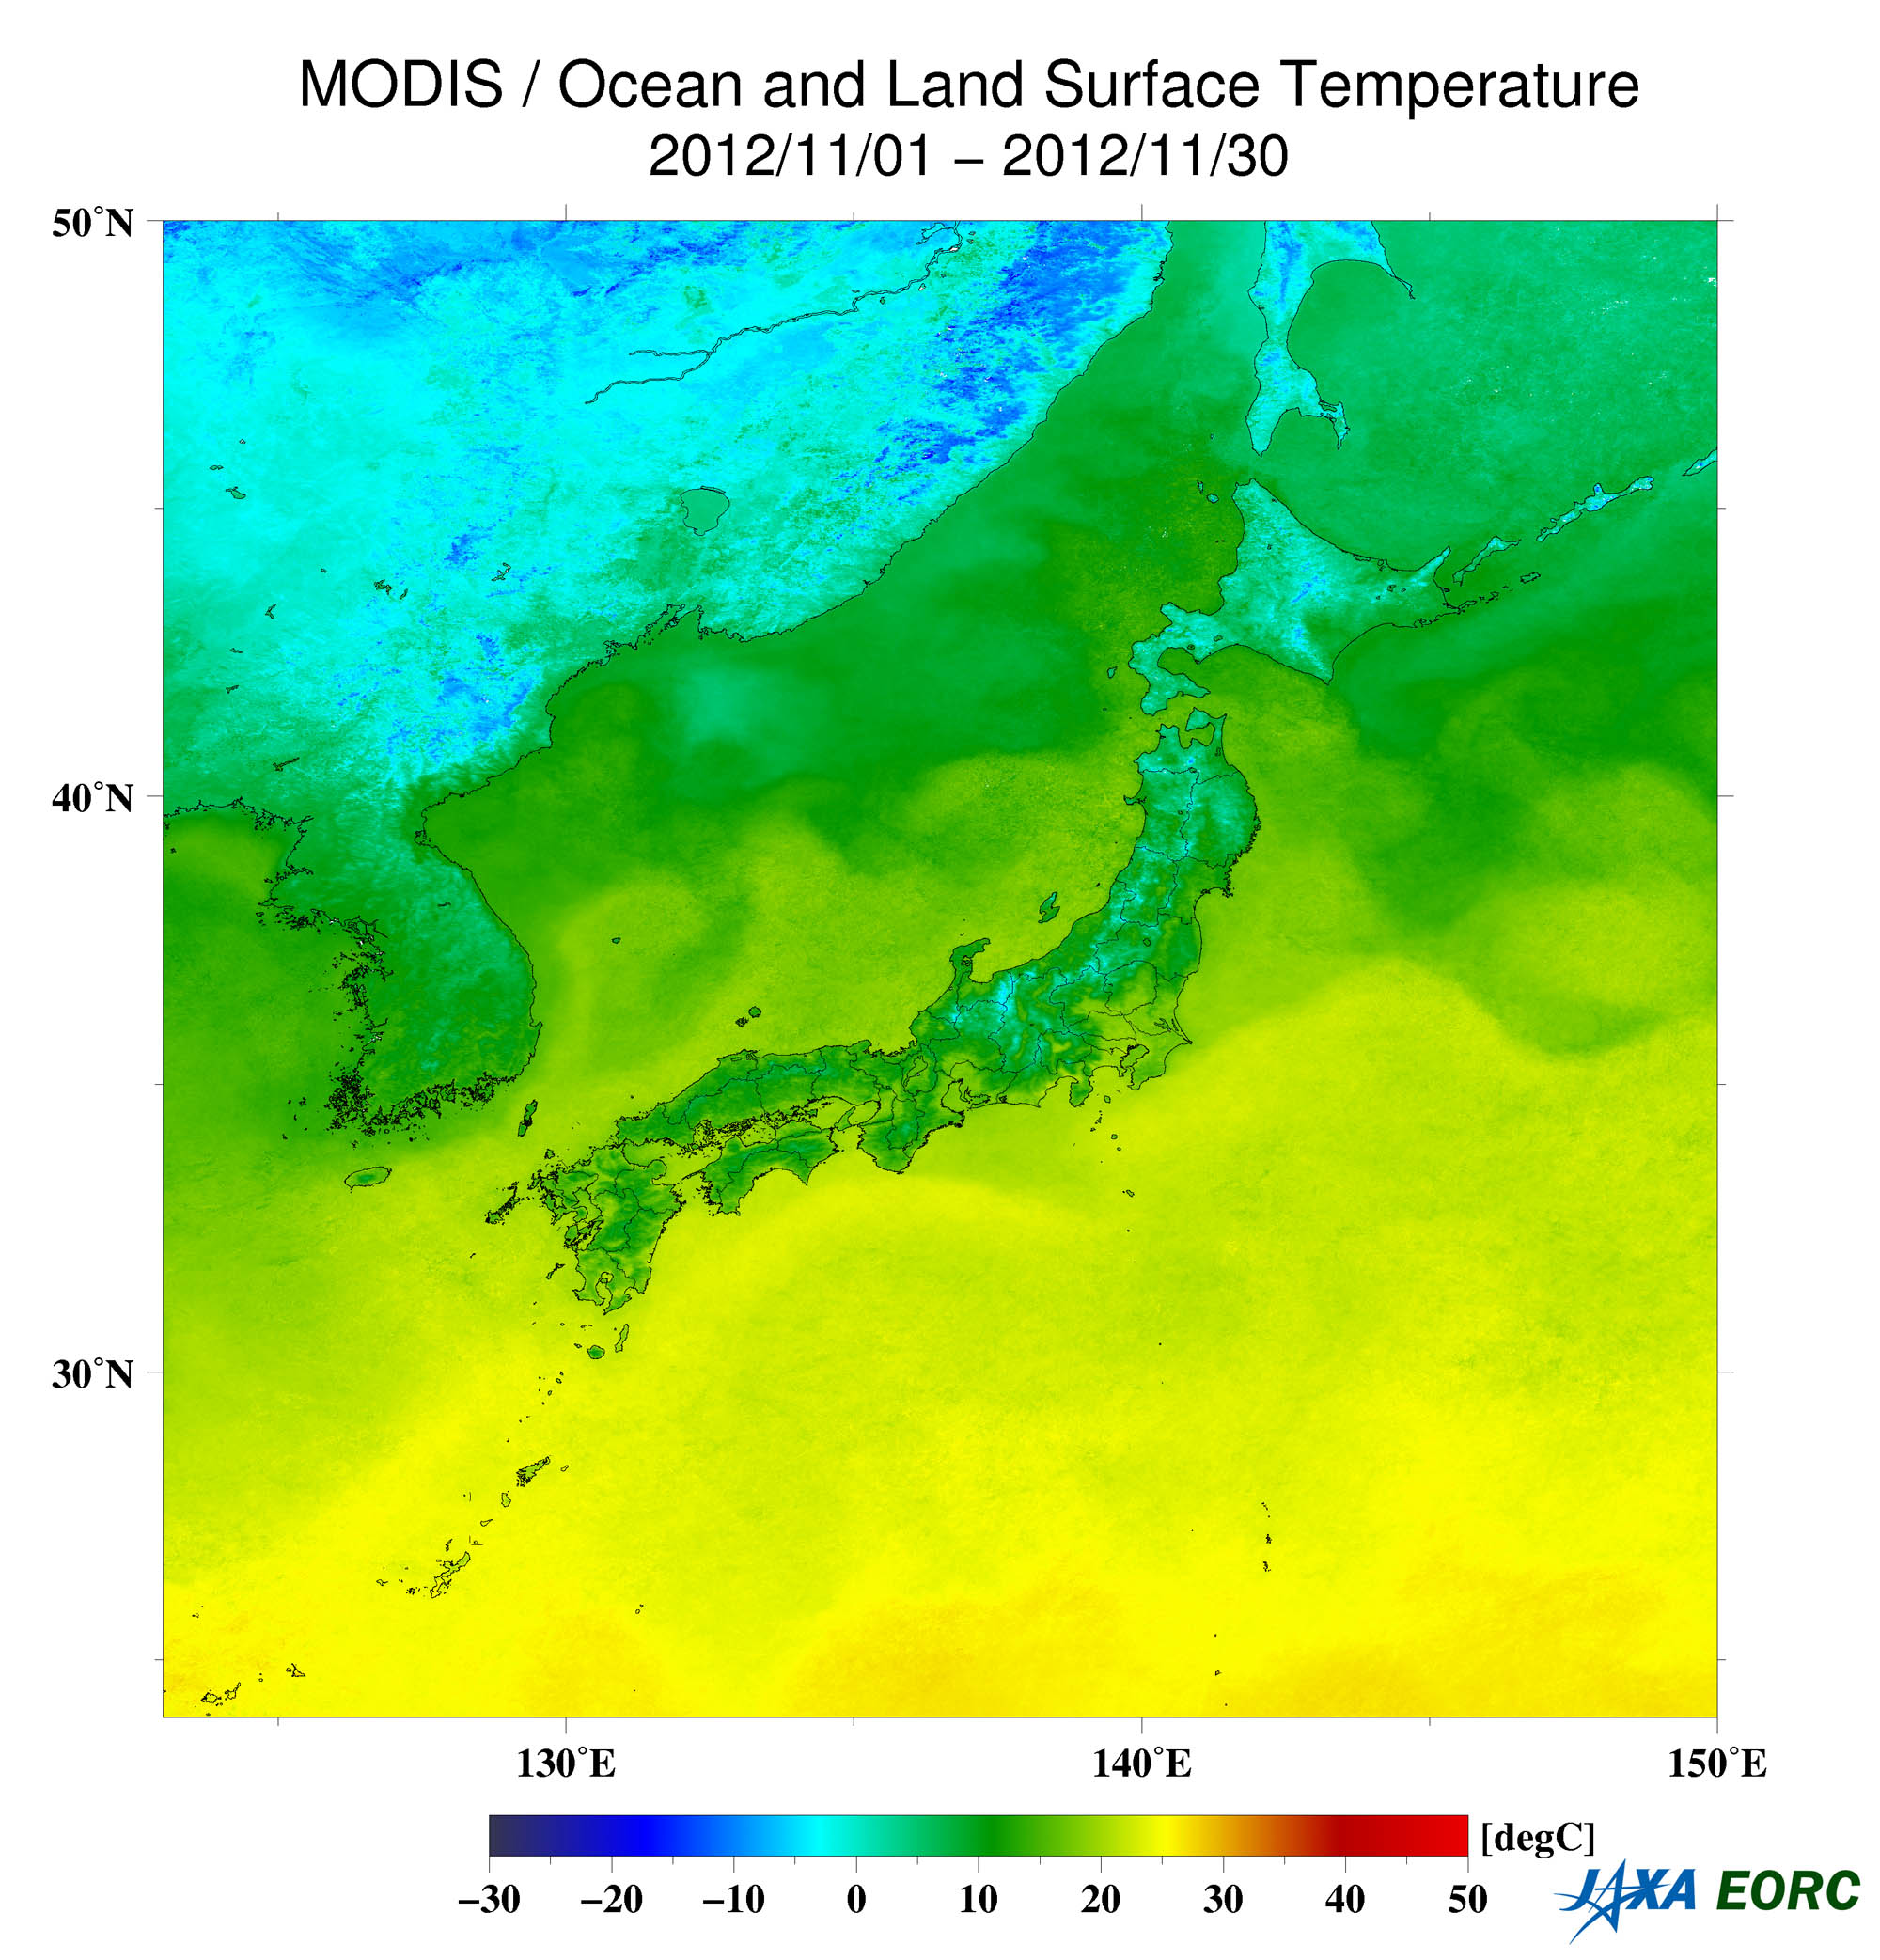
As the preceding information derivation before SGLI, the Moderate-resolution Imaging Spectroradiometer (MODIS) image is now open to the public (Fig. 3a) (Reference 6). From monthly mean land and SST in 2012 (Fig. 3b, 3c), the SSTs offshore Okinawa are 30 °C in August and more than 20 °C in November, which are suitable temperatures for coral development. Archived data from MODIS have been obtained since 2003. The products and information derived from these data sets are expected to be the predecessors of SGLI data sets without information gaps to contribute data analysis, validation, and applications such as biodiversity protection. In November 2012, the Japan Meteorological Agency (JMA) released a statement concerning the release of periodic monitoring information on ocean acidification as information related to global warming, which was derived from time-series data analysis of marine observation data by a meteorological observation vessel for the first time in Japan (Reference 7). Based on this analysis, it was determined that ocean acidification is advanced in the northwest Pacific Ocean (from 3° N latitude to 34° N online of 137° E longitude). Accordingly, it is considered that carbon sink potential in the ocean is decreasing and its effects on marine ecosystems have generated concern. Ocean acidification information will be released by the JMA, and it is expected that both space and marine observation data will be used to promote biodiversity protection and to confront the challenges presented by climate change. Footnotes*1 The conference was held in June 1992 in Rio de Janeiro, Brazil. The official name is the United Nations Conference on Environment and Development (UNCD), otherwise known as the Earth Summit, where the Framework Convention on Climate Change (FCCC) and the Convention on Biological Diversity (CBD) were adopted. *2 Corals with hard skeletons, which maintain an internal mechanism of cora–zooxanthella symbiosis, play a role in building up the coral reefs. *3 The first Earth observation satellite of the Landsat mission was launched in 1972, which continued with a series of satellites until its 40th Anniversary in 2012. For future missions, Landsat-8 of the Landsat Data Continuity Mission (LDCM) was launched on February 11, 2013, or later. Landsat has ability to observe the Earth’s surface in every 16 days periodically without gaps, which is a variation from high-resolution commercial satellites that can observe specific targets by pointing observation. This method is considered the most effective for global environmental observance without time or location data gaps. Reference sitesExplanation of the Images:
The image data of Figure 1 was downloaded free of charge from the U.S. Geological Survey’s (USGS) Global Visualization Viewer (GLOVIS). The color composite images are produced by assigning red to Band 3 (630–690 nm), green to Band 2 (520–600 nm), and blue to Band 1 (450–520 nm). The resulting images have natural coloring as if seen by the unaided eye.
The Advanced Visible and Near Infrared Radiometer 2 (AVNIR-2) is equipped with four observation bands. The color composite images are produced by assigning red to Band 3 (610 to 690 nm), green to Band 2 (520 to 600 nm), and blue to Band 1 (420 to 500 nm). The resulting images have natural coloring as if seen by the unaided eye. Each color indicates the following ground objects:
(Fig.2) Related Sites
|


