| |
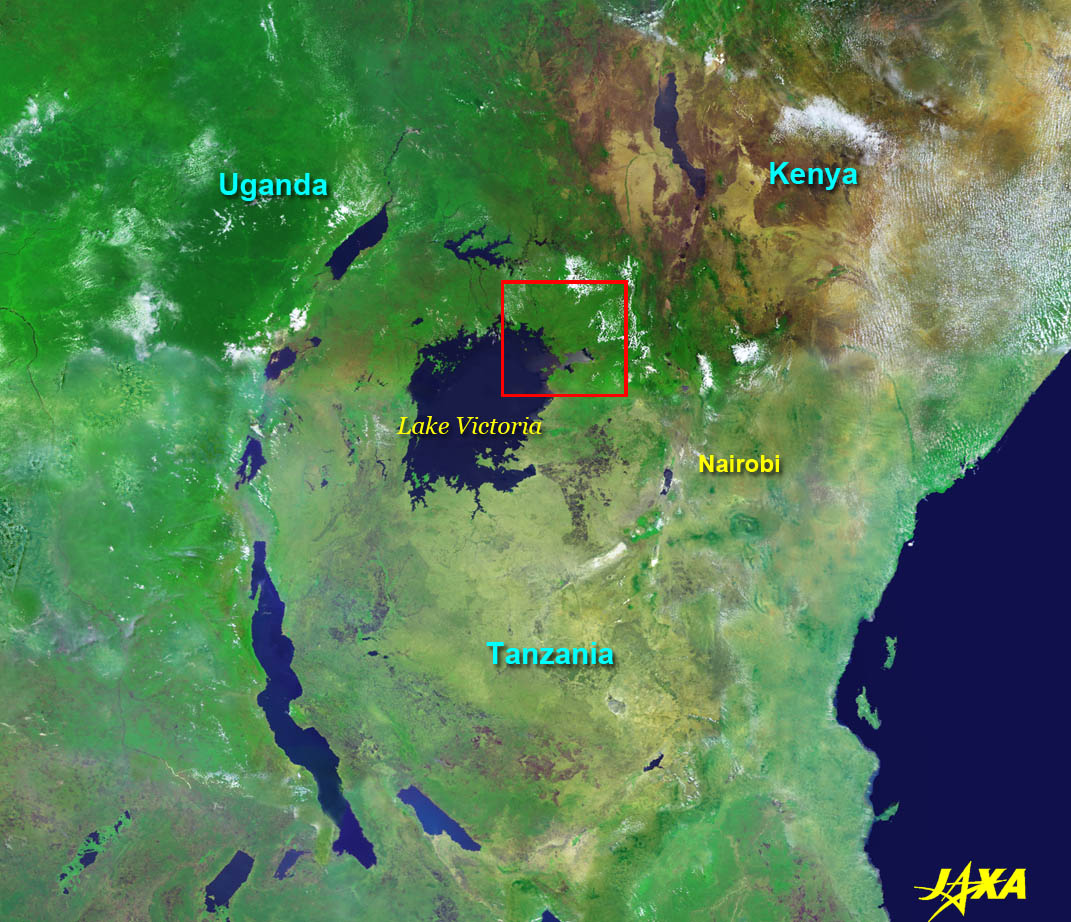
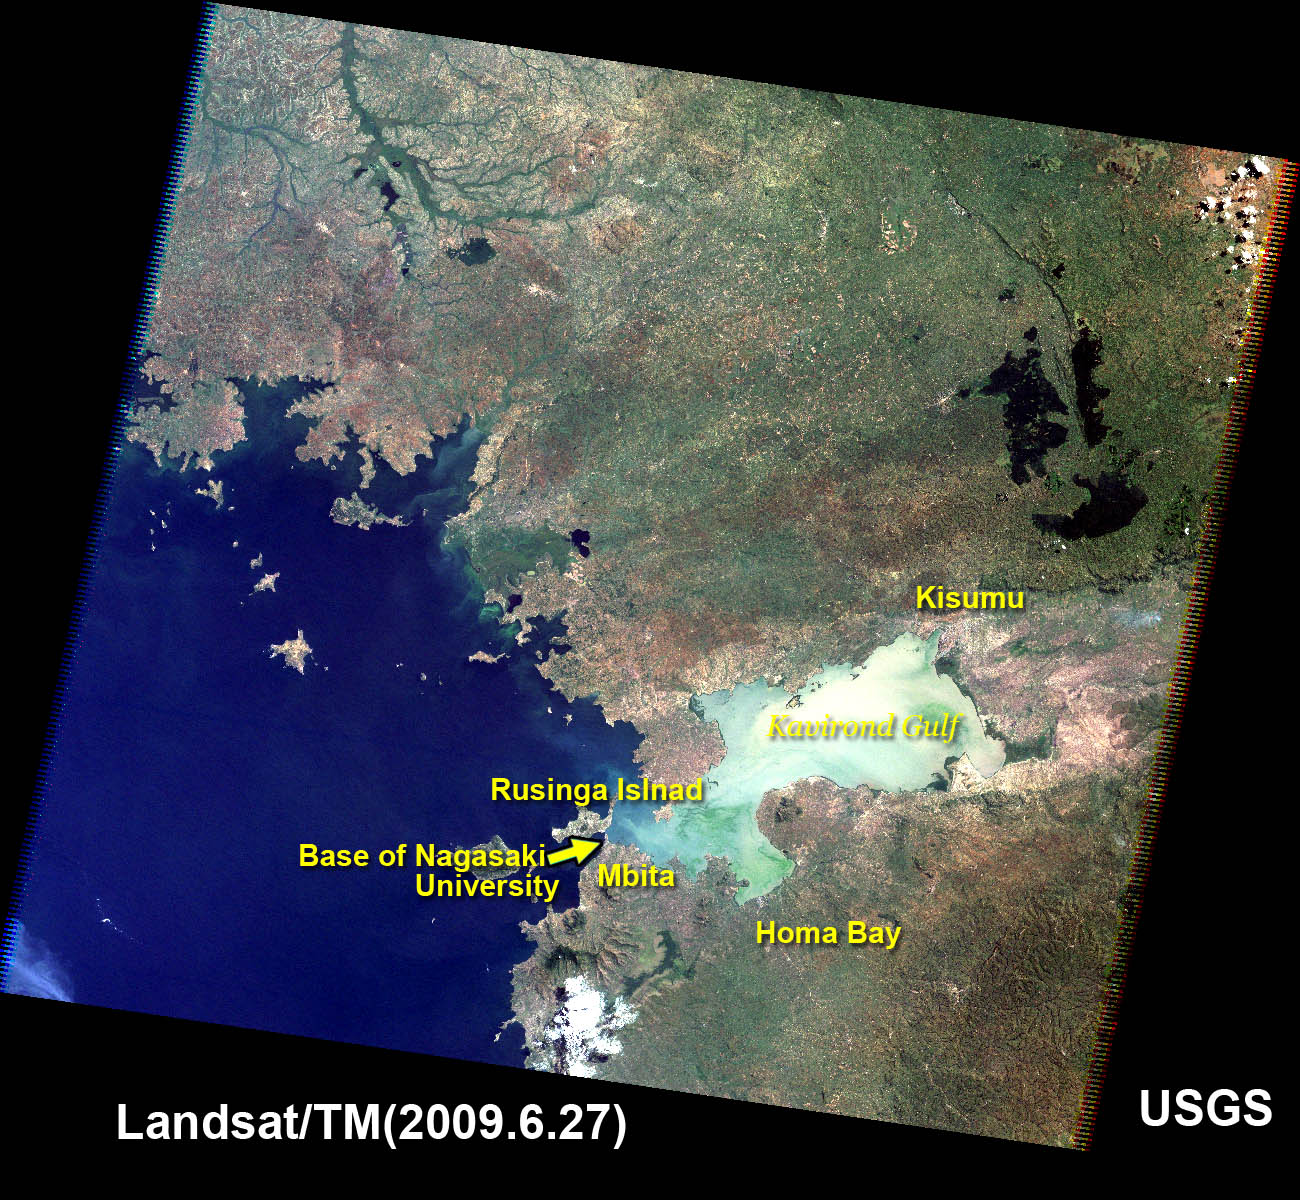
Lake Victoria is an ancient lake located to the east of the center of the African continent. It is the largest lake in Africa (with an area of 69,485 km2), and the second largest fresh water lake in the world (Fig. 1 Upper Image) (Ref. 1). It is also a source of the Nile as it flows down to Egypt and a vital daily water source for the inhabitants of Kenya, Uganda, and Tanzania. In the 1950s, the lake was stocked with Nile Perch, an extraneous predatory fish introduced for breeding as edible fish, and specimens of up to 2 m are processed and exported to countries in Europe and Asia (including Japan). However, the introduction of the fish has caused problems, and in recent years, several hundred genera of Cichlids, an endemic species, have disappeared.
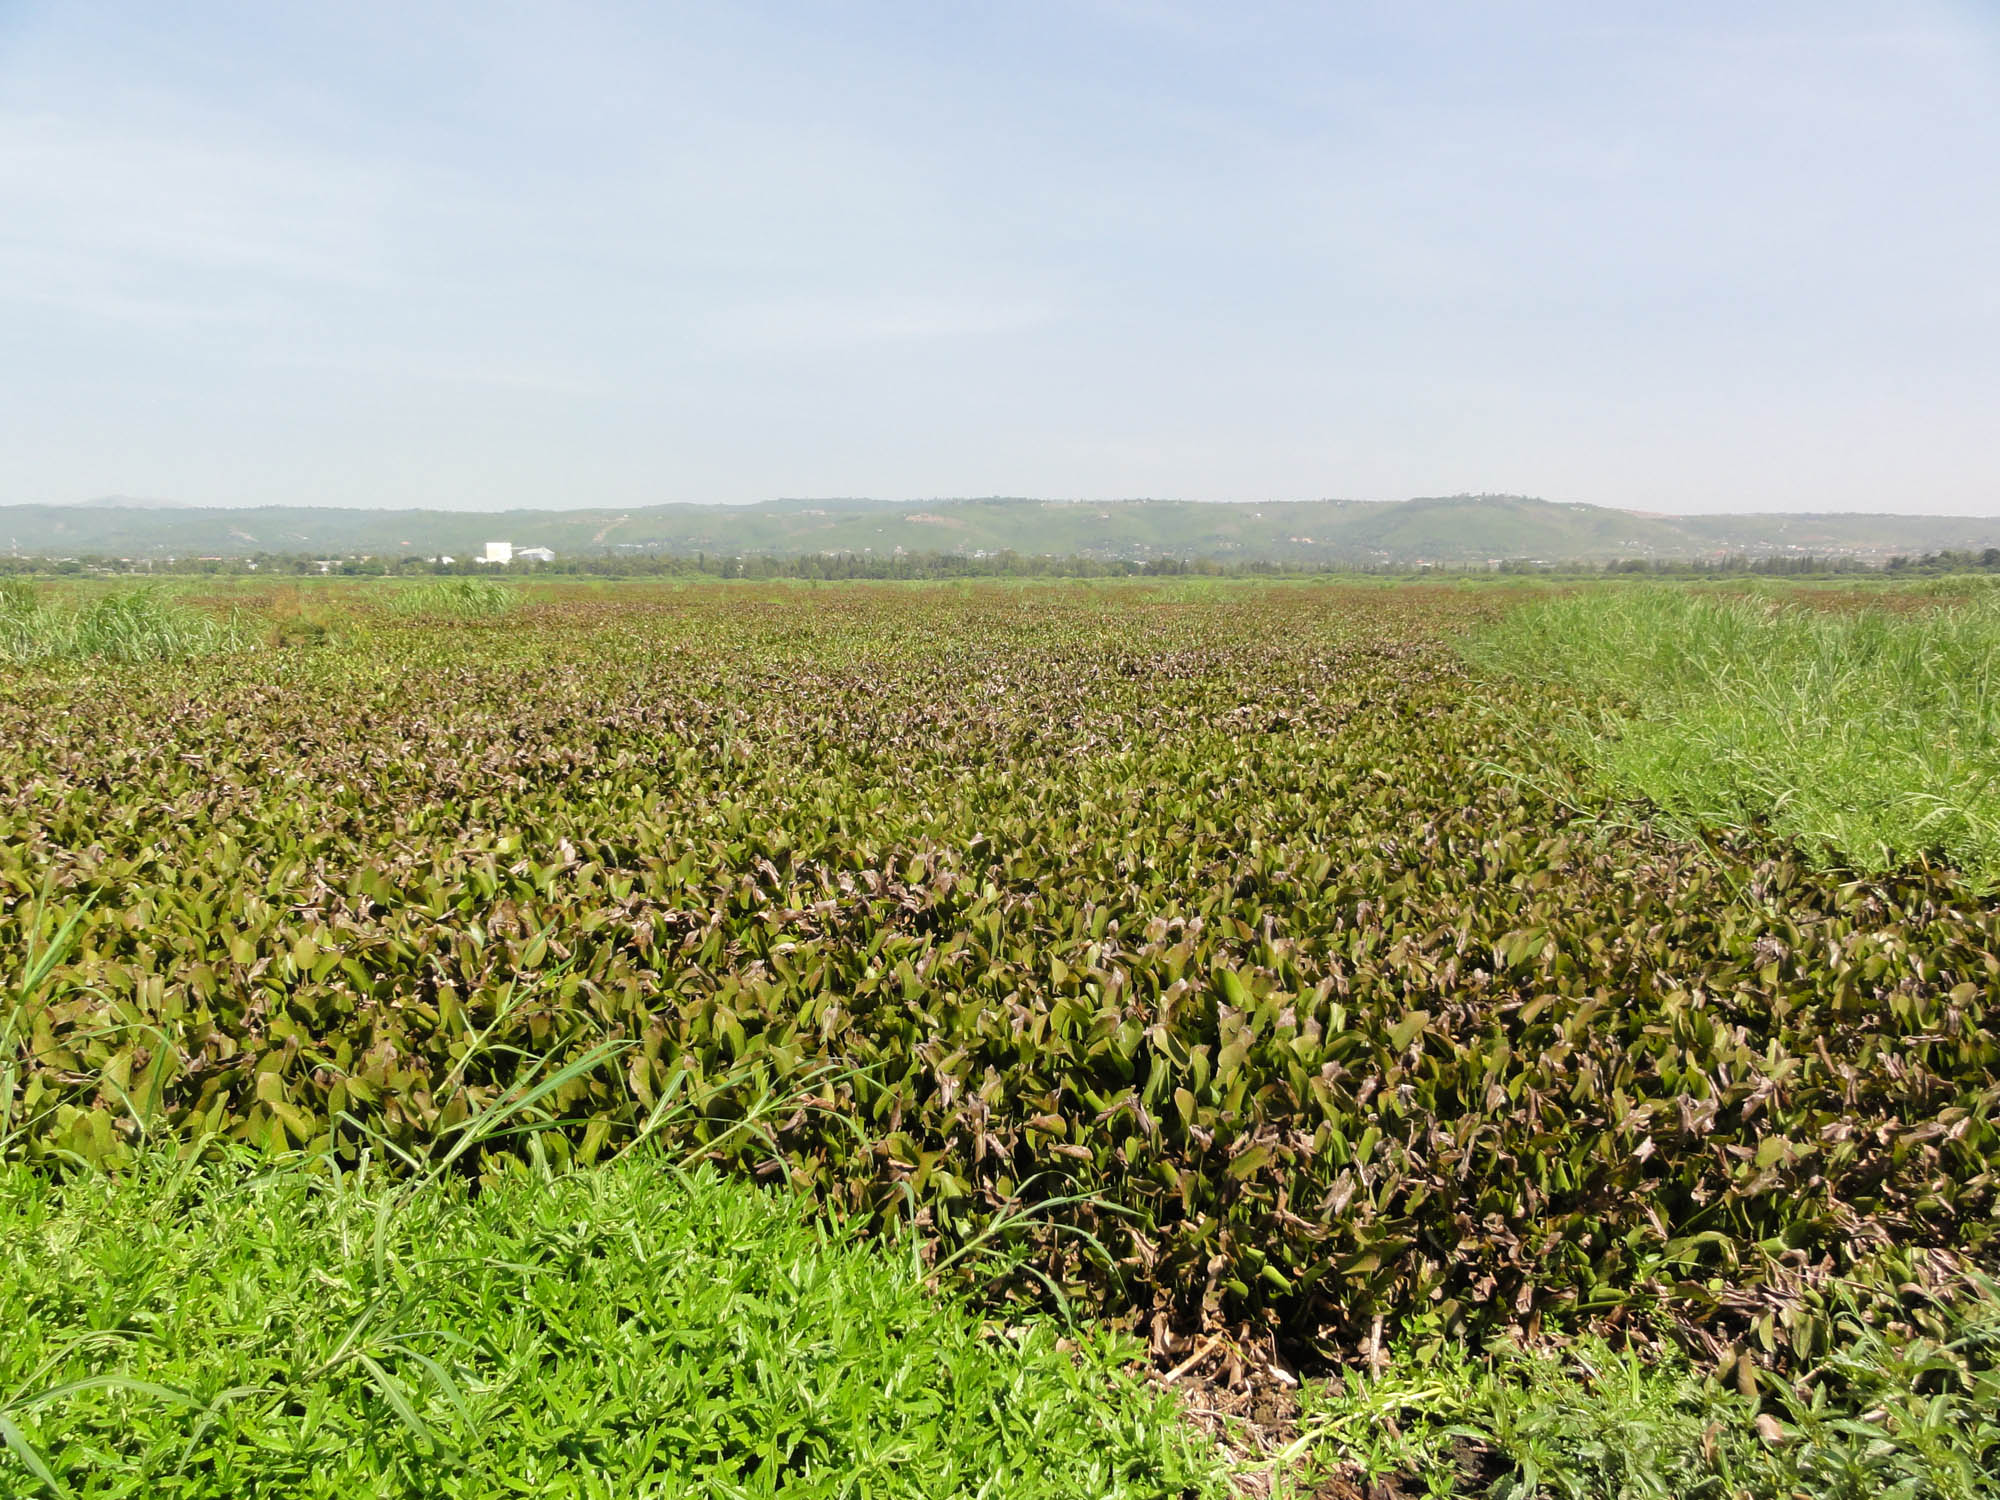
Since 1998, the water surface of the Kavirondo Gulf (or the Winam Gulf), in north-eastern Lake Victoria, has been covered with a green carpet composed of propagated water hyacinths and Microcystis (blue-green algae cyanobacteria). This has now become an obstacle to the movement of fishing boats and ferries on the lake and harbor, and has had a considerably degrading effect on the coastal environment, resulting in an increase in the workload for water purification plants. The cause of this outbreak of aquatic plants is considered to be related to the human population growth around cities such as Kisumu (Fig. 1, lower image), and associated with eutrophication due to input of domestic wastewater and fertilizer (which runs off into the lake as a by-product of farming). Aquatic plants, such as water hyacinths and Phragmites (Yoshi in Japanese), absorb nitrogen and phosphorus in water and recover water quality from eutrophication. However, when the water environment lacks the ability to decompose organic matter from the dying aquatic plants, the rate of decomposition drops to a level that prohibits any possible regeneration of the plants. Therefore, a large amount of dead plant material accumulates along the lakeshore, at the bottom of the lake, and floats on the water. When this occurs, there is a deviation from the normal state of the material cycle and/or food chain from phytoplankton, zooplankton, to fish and animals (Ref. 2).
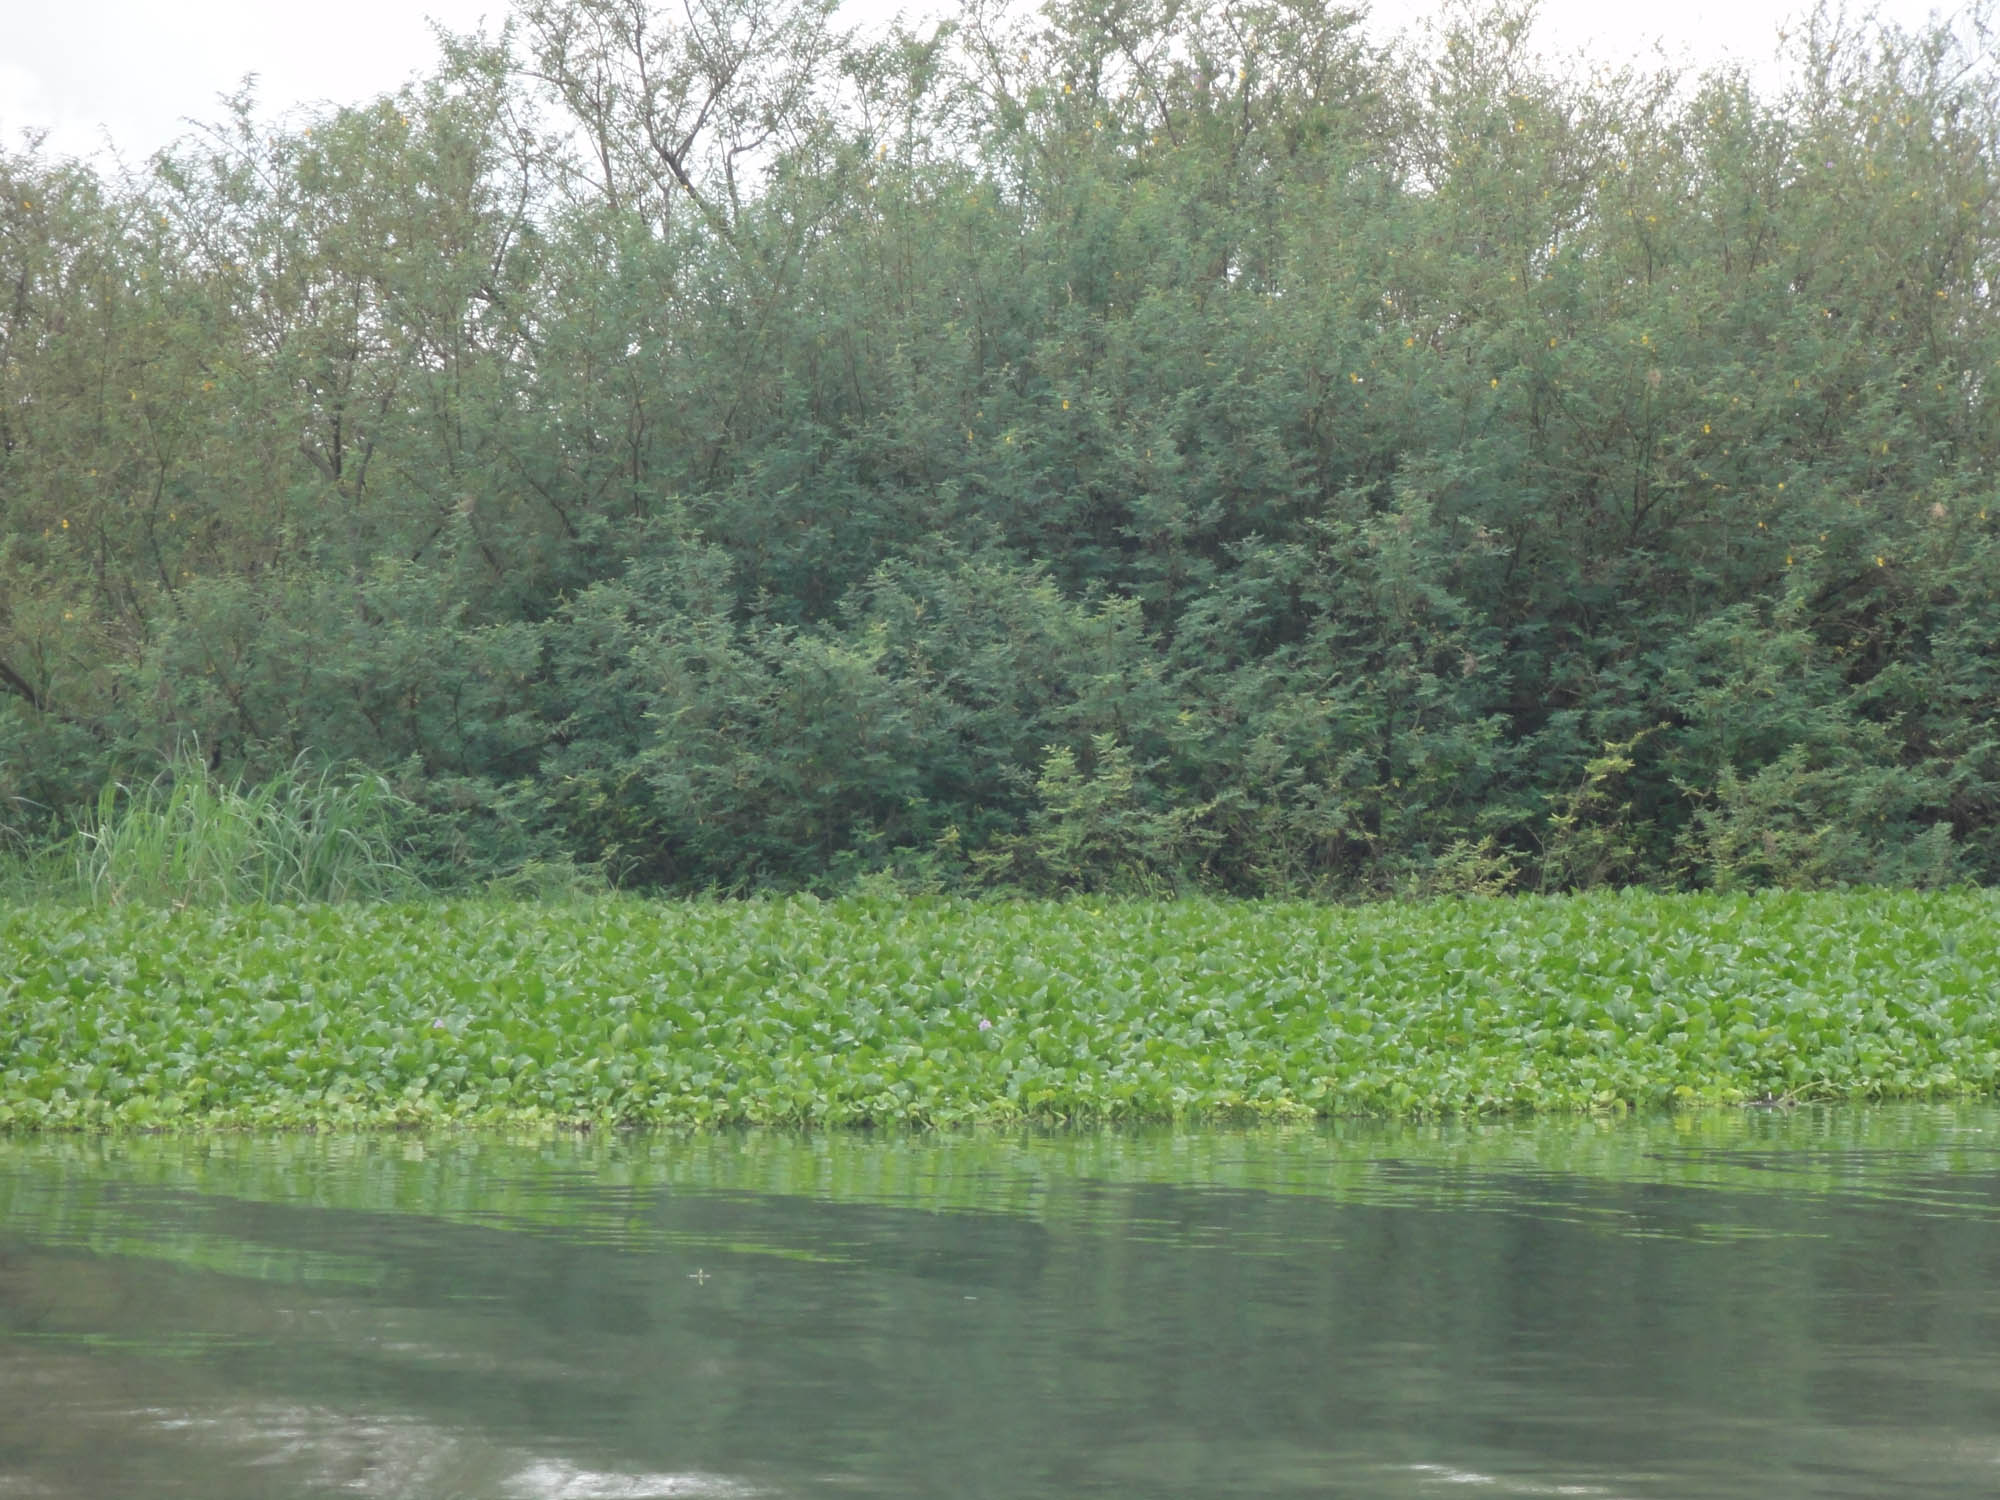
The growth of water hyacinths is surrounded by bushes found along the lakeshore that serve as breakwaters (Fig. 2) but supply a breeding habitat for the larvae of some species of malaria vector mosquito. From a human health perspective, the dynamics of these aquatic plants is a concern due to potential vectors, because the roots of water hyacinths and the bloom of Microcystis blue-green algae could contain the vector of cholera. Therefore, public health and a potential infectious disease epidemic is a concern, not only for the local or regional community, but also for international society (Ref. 3, 4, 5).
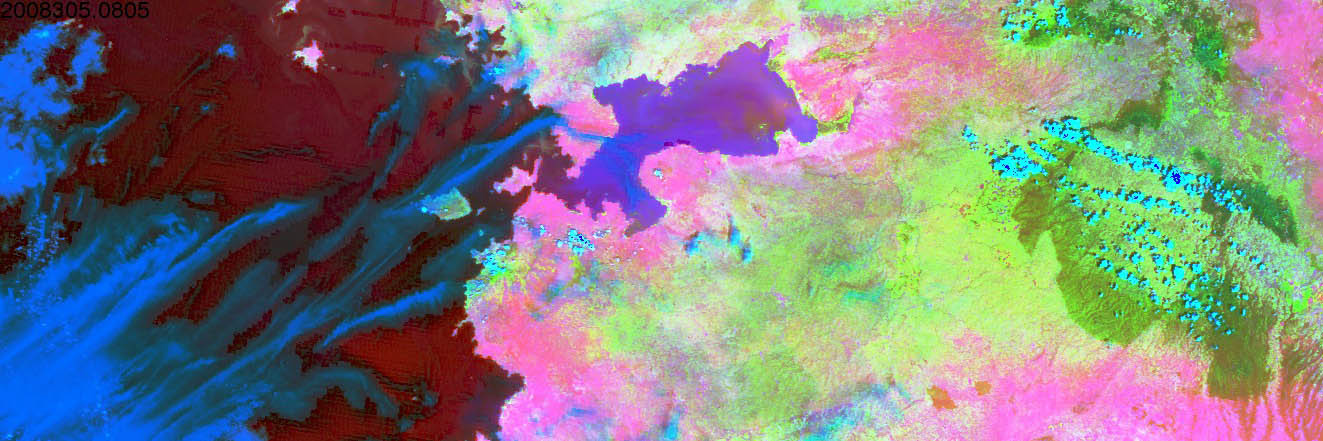
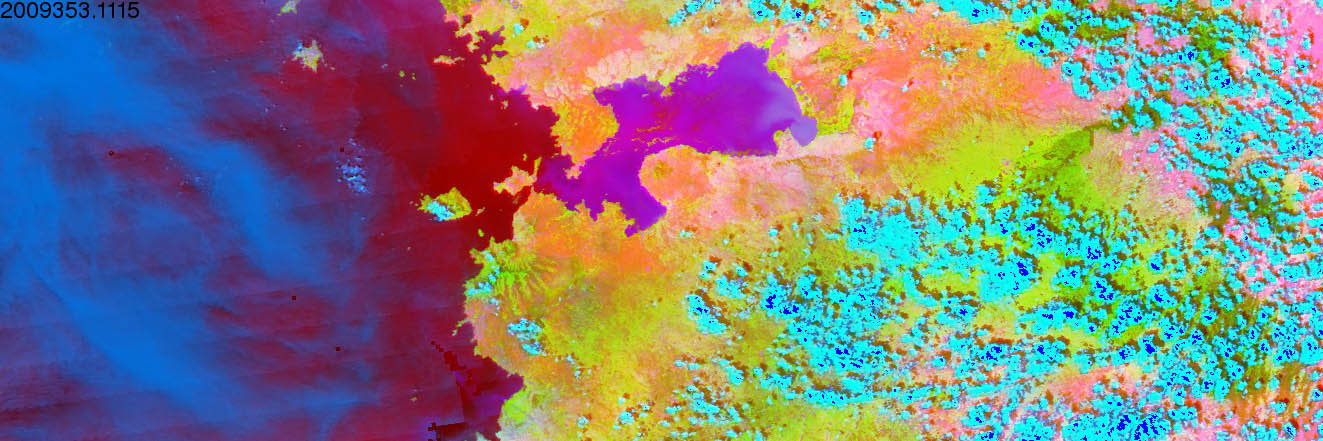
Continuous monitoring of such a wide-ranging and changing environment requires sensors with a medium resolution and highly recurrent observations of the earth’s surface, simultaneously covering atmospheric conditions on both land and over oceans. MODIS, a typical sensor currently on board the Earth observation satellites Terra and Aqua of NASA, can be used for such a purpose. It is useful to observe the earth using different optical and infrared spectral channels, as shown in Fig. 3, so as to provide significantly important environmental factors shown in the enhanced images, such as in the Pseudo-Color composite image (Red: MODIS Ch.31 (Thermal Infrared Brightness Temperature), Green: MODIS Ch.2 (Near Infra-Red), Blue: MODIS Ch. 1 (Red)). Here, the whole lake basin is raked with one sensor, revealing the turbid water. The aquatic plants are shown to be collected at the inner part of the Kavirondo Gulf, and the vegetation activity on the ground, the soil moisture conditions, and the water flow from the river basin into the lake water, are shown. In this way, the environment and extreme events can be captured comprehensively. In the image in Fig.3, obtained at the beginning of a short wet season from October to November, the change in the surface of the savanna along the lakeshore can be seen. Three colors indicate the condition of the Earth’s surface as follows: Red indicates the high temperature zone of the land, the water surface, and the atmosphere; Green indicates the active and dense vegetation cover area; Blue indicates what seem to be the reddish soil surface, turbid water, and clouds, which absorb the shorter wavelength light of blue and green. In the upper image, the pink area indicates a mixture of red and blue light, which seems to be the hot and reddish soil surface. In the lower image, the orange or yellow area is an area with a mixture of red and green light, where active and dense vegetation cover seems to be recovering after rain. Meanwhile, turbidity in the lake, caused by river water inflow, is observed in the blue area. In Japan, following global environment observation satellites and their onboard sensors; ADEOS/OCTS and ADEOS-II/GLI, GCOM-C/SGLI is planned to launch with the improved and continuous observation capability. This new earth observation satellite has the same specification as MODIS, but also has a unique enhanced function and performance, which improves the observation capability, as well as inter-operability for data use with other space agencies in the world, and is planned to be used for frequent, cloud-free composite imaging of the earth.
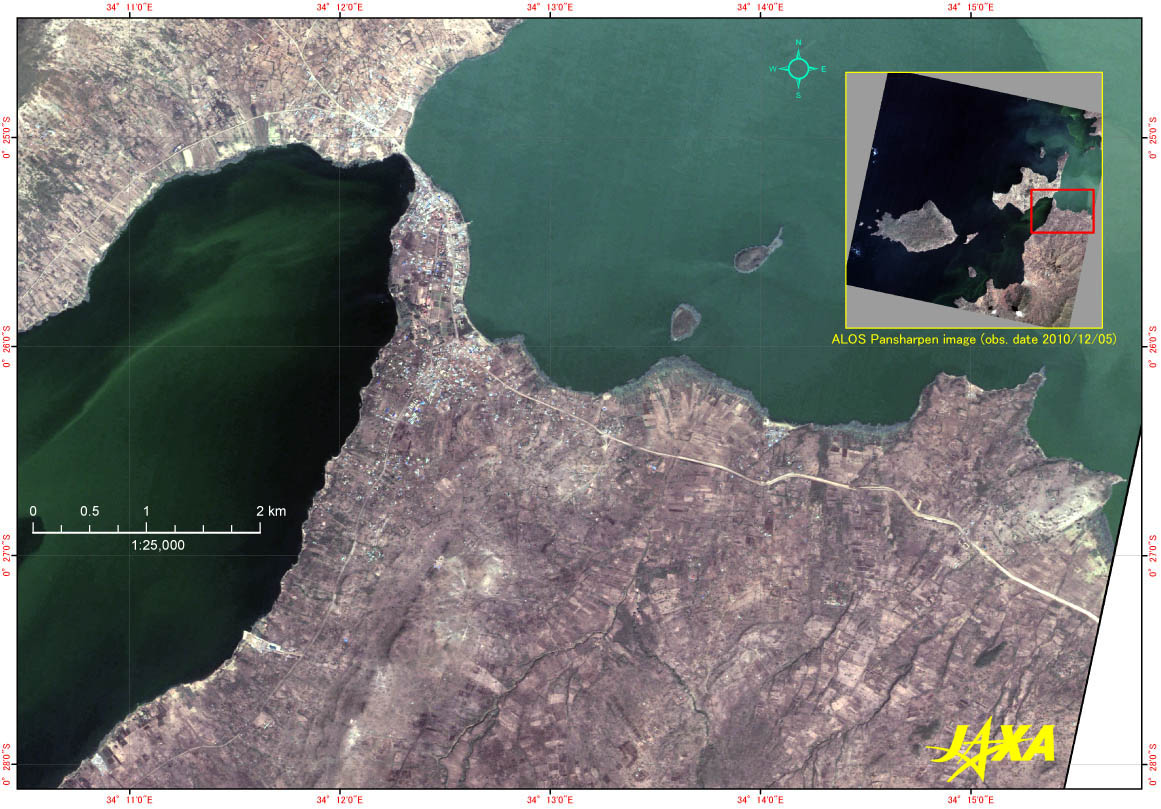
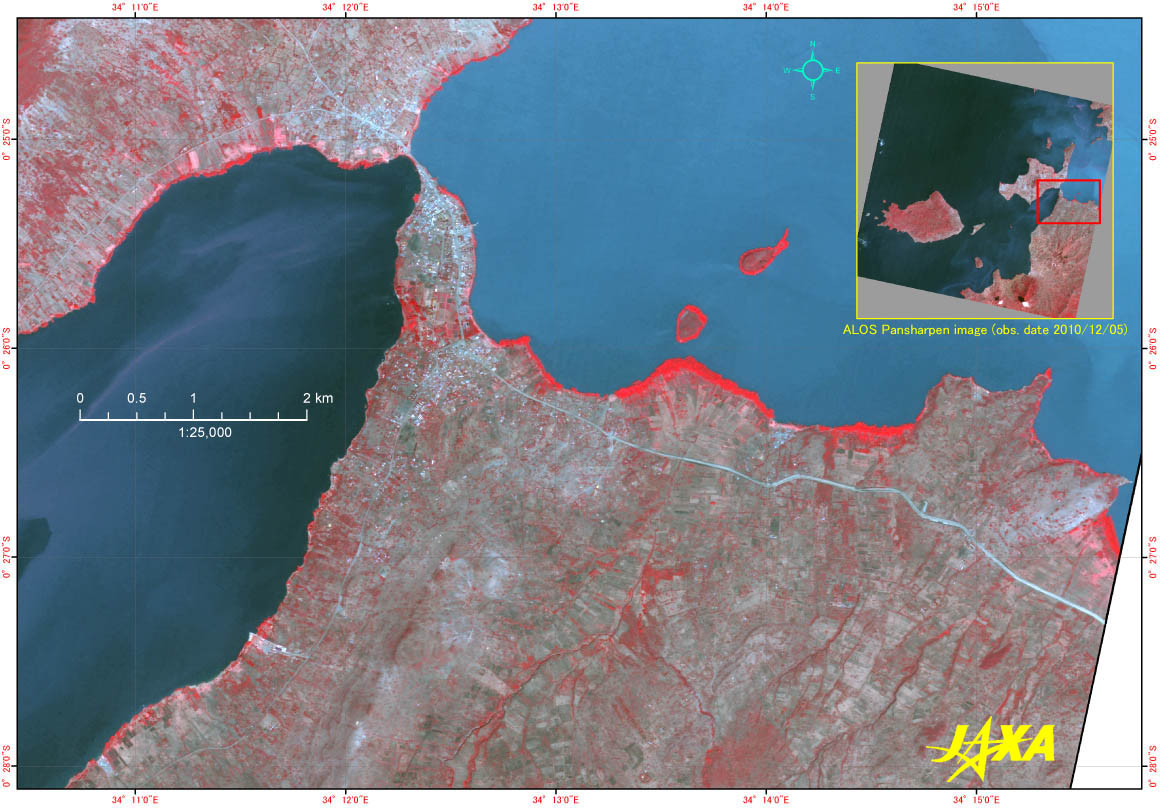
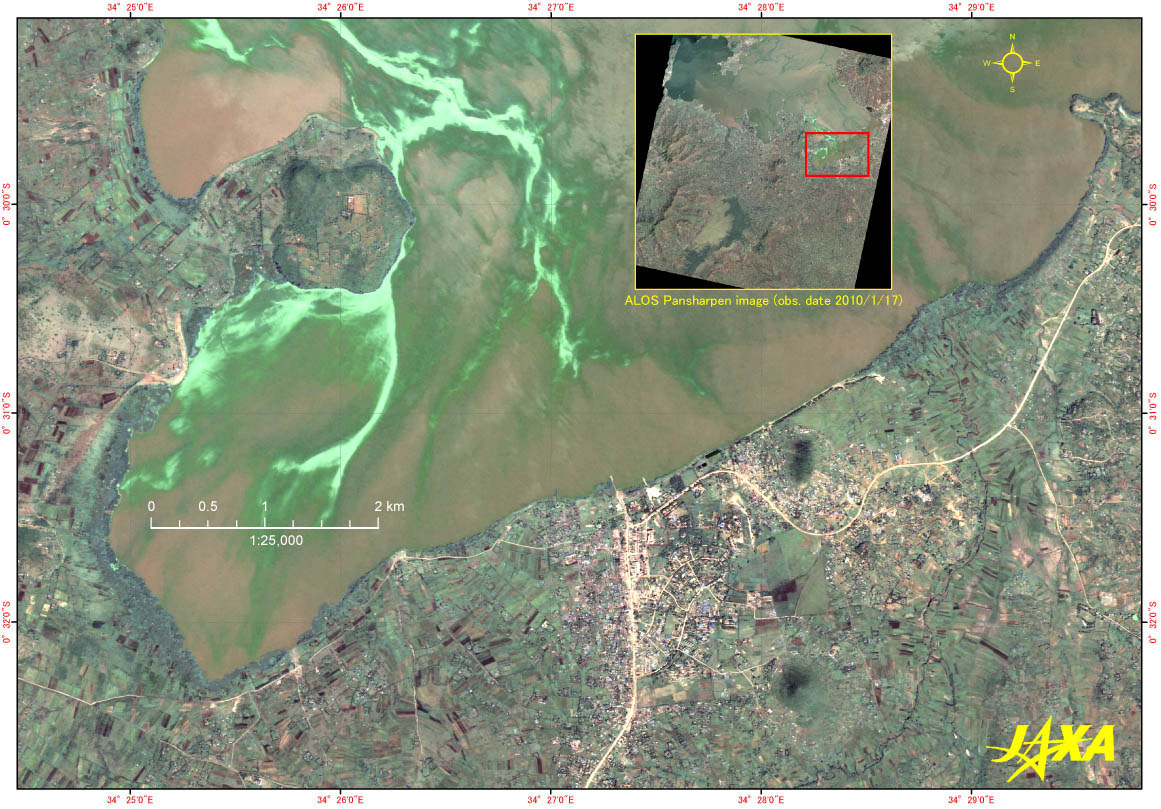
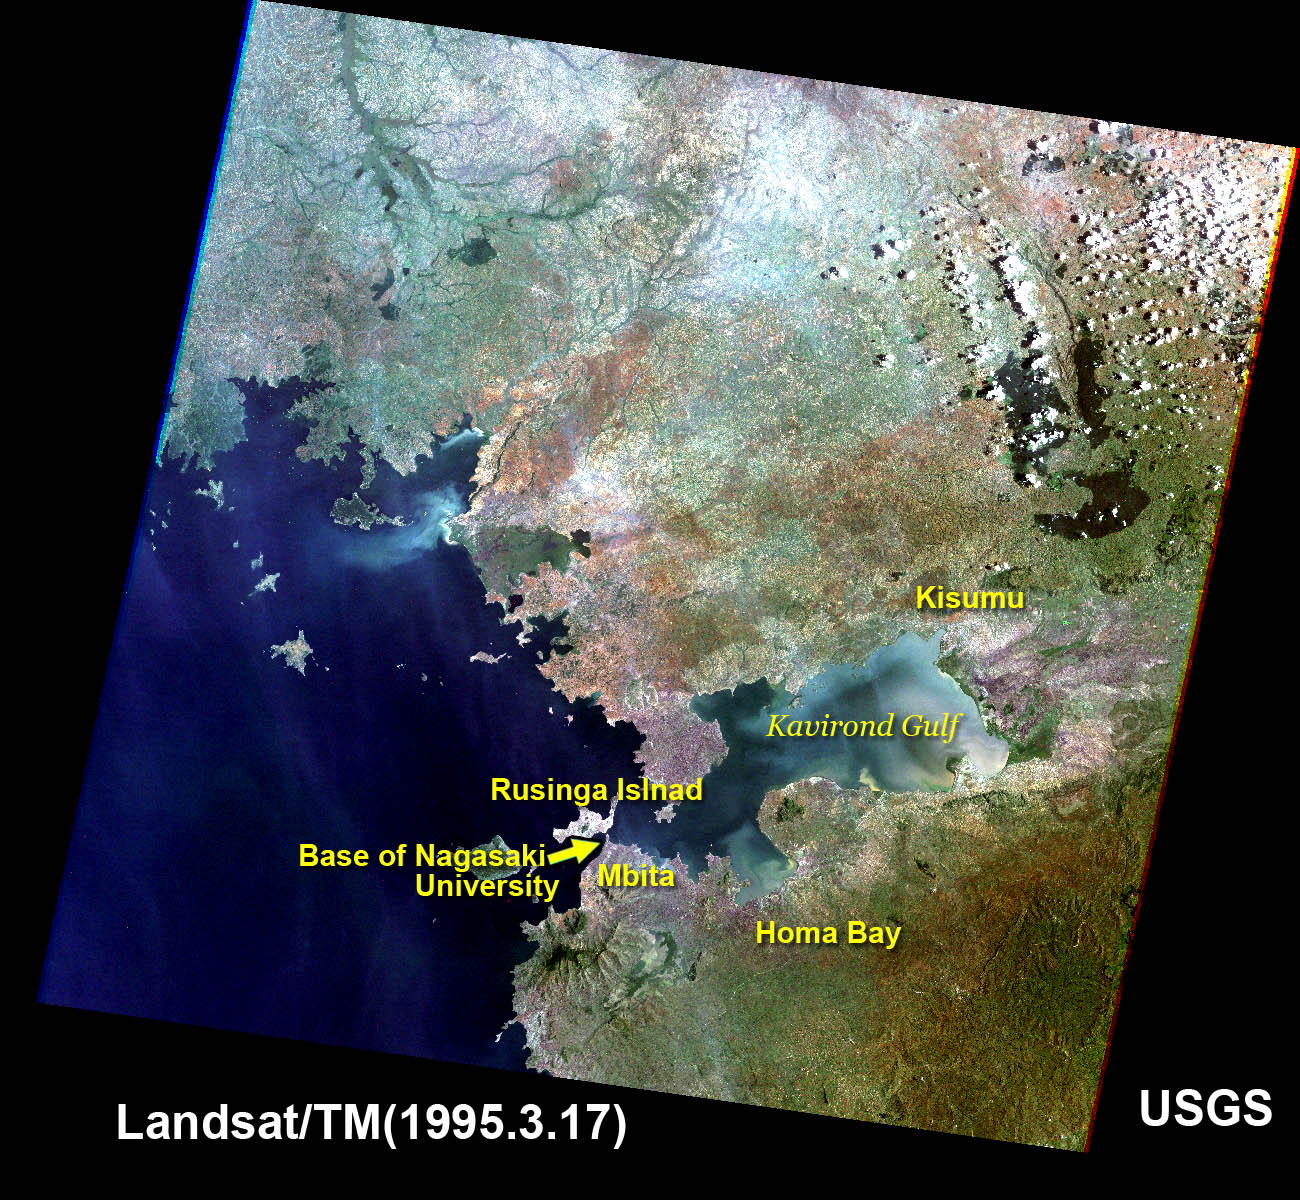
However, for the classification of aquatic plants, images taken by high-resolution sensors onboard satellites are required, using the optical sensors of, for instance, ALOS, Landsat, SPOT, and synthetic aperture radars. The two color images in Fig. 4 are of Red Green Blue (RGB) triplet color composite images. The left image is a color composite image which allocates red, green, or blue, colored light to the image observed by sensor in the spectral bands 3 (red), band 2 (green to yellow), and band 1 (blue to green), respectively, and is the closest image to that sensed by the human eye. The right image is an enhanced image that provides a clear picture of the vegetation cover density and activities, using brightness in the red color; allocating RGB color light to spectral band 4 (near infra-red), band 3 (red), and band 2 (green to yellow). The area of bright red color along the lakeshore in the right figure appears to be the dense and active vegetated area, where water hyacinths, reeds and bushes take root, while the smooth pattern that is observed over the lake water to the west, as a drifting, thin, veil appears to be the Microcystis blue-green algae cyanobacteria bloom. The road from Mbita district to Rusinga Island is constructed on reclaimed ground; and therefore, blocks the current from east to west. On the west side, the ebb and flow of the lake causes the waves to wash against the lakeshore and clear water flows constantly. On the east side, there is stationary turbid water with a subtle change in colors from blue green to yellow brown and milky white. It is inevitably a challenge, and in the interest of public health, to identify the causes of these changes in water color, (for example, whether derived from organic matter, eutrophication, carried by mud flow, or from the waste water from daily lives).
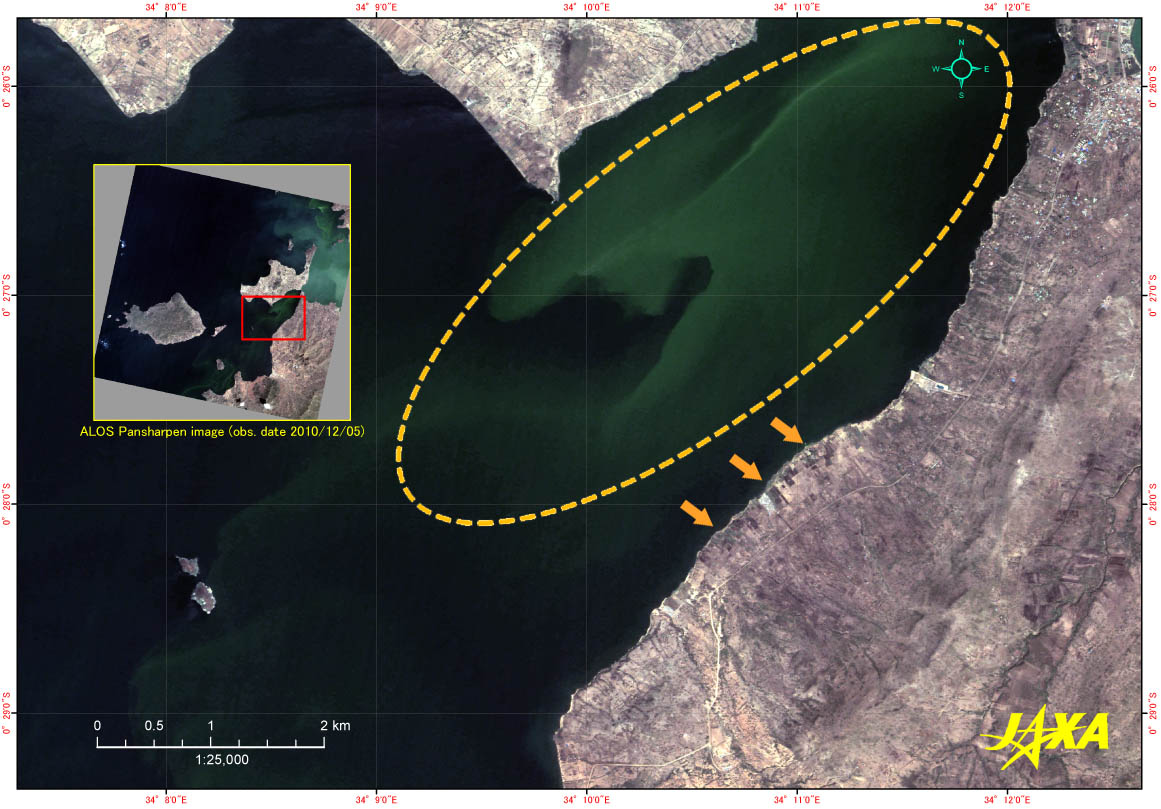
According to the satellite altimetry time-series water level observation data that has been continuously recorded since TOPEX/Poseidon (Ref. 6) was launched, the water level of Lake Victoria fluctuates by about ±1 m from an origin level of 0, set at a 10-year average in 1992. In March 19, 2006, during the period in which the water level was recovering from a minimum level recorded in 2006, and also between 2007 and 2012, lagoons along the lakeshore (indicated by the arrows) were observed by satellites. After this time, the rainfall rate and water level began to form a correlation with the number of captured malaria vector mosquito in the surrounding areas, and a survey showed that many infants were infected with malaria in this region at that time. In the satellite image in Fig. 5 (observed on December 5, 2010), the water level had returned to normal, and no lagoons were captured.
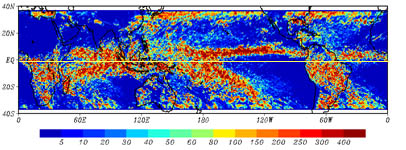
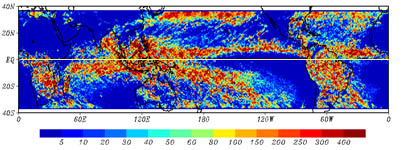
Rainfall is among the most important weather factors affecting lake water level, and can thus make ponds in basins. The Tropical Rainfall Measurement Mission (TRMM) satellite is continuously observing climatic changes in rainfall patterns. The images shown in Fig. 6 are examples of the typical difference in rainfall patterns between El Niño and La Niña periods. A large amount of rain falls around Lake Victoria during El Niño periods, but little falls during La Niña periods. The effects of these mid-term weather changes on local weather are also considered important in forecasting incidences of malaria vector mosquito. (TRMM monthly mean image and binary data are accessible from the EORC, JAXA website: Ref. 8). Since 1997, when TRMM was launched, the satellite has been operated for the past 15 years far beyond its designed lifetime, and its 15th anniversary was marked in 2012. In 2014, its successor, the improved Global Precipitation Mission (GPM) satellite was launched to continue observations not only rainfall, but also snowfall, which are both indispensable sources of water supply for terrestrial organisms.
The Institute of Tropical Medicine of Nagasaki University, Kenya Research Station (NUITM-KEMRI) has its Mbita Project Site at the International Centre of Insect Physiology and Ecology (ICIPE) in the West of Kenya, to the east of Lake Victoria. In NUITM-KEMRI, they have developed a Health and Demographic Surveillance System (HDSS) and have systemized the data by making regular door-to-door canvassing, in addition to providing medical treatment for the inhabitants, conducting epidemiological researches, and taking preventive measures against infectious diseases such as malaria and cholera. Based on the information derived, health visitors visit locals to provide mosquito nets and guidance for preventive measures against malaria, as well as deliver advice on improved sanitation; thereby achieving positive results related to primary health care. To make the best use of remote sensing technology for the improvement of public health, JAXA and Nagasaki University have begun collaborative research in order to clarify the correlation between epidemics of infectious diseases such as malaria and cholera, and the regional environment and ecosystem with the intention of applying the results of such research to taking necessary measures to prevent infectious diseases.
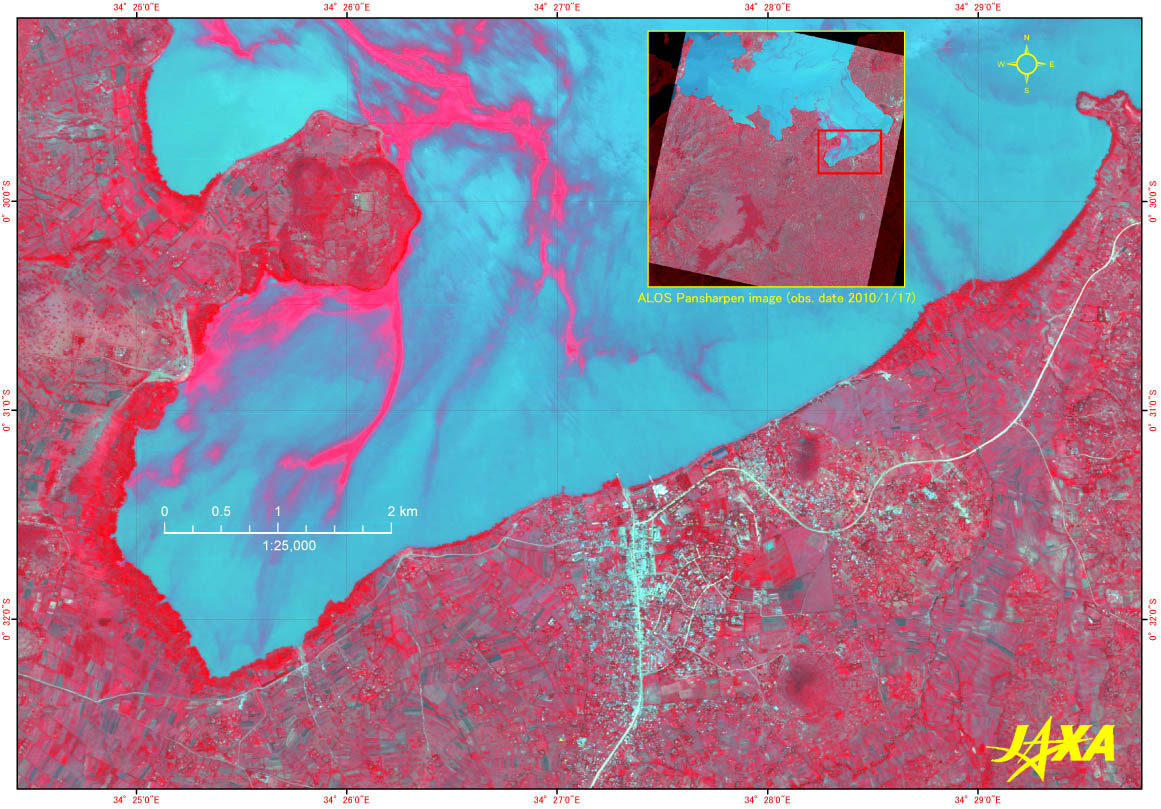
Homa Bay city area can be seen in the central lower part of the image in Fig 7. Around the crossing point of the road from south to north and along the lakeshore line, the port of fishing boats and ferries is captured, where fish were caught and processed after the unloading of ships. In the image observed on December 2010, a pattern can be seen drifting on the lake water surface. In the left image, it appears as green or whitish green, and in the right image it appears slightly bluish red; the reflectance of each image is strong in green and in near-infrared, respectively. The area appears to be covered with vegetation, and is assumed to be the sparsely distributed water hyacinths and the Microcystis blue-green algae cyanobacteria bloom, because the color is pale green (in the left Image) and pale red (in the right Image), in contrast with the bright color of the vegetation along the lakeshore.
As is evident from this report, the monitoring of environmental changes around Lake Victoria over a long time of period is considered urgent in order to forecast potential changes to human activities and the relationship to the causes and effects of environmental change. It is also necessary to collect an assemblage of information and conduct data analysis, to evaluate whether any precautionary measures are required. To do so, utilization of the data obtained by high-resolution satellites and environmental observation satellites, which have been operating and observing the environment for decades, has already started.
Reference Site
 (Ref.1) (Ref.1) |
Peter Saundry, Lake Victoria, The Encyclopedia of EARTH, July 14, 2012. |
| (Ref.2) |
Shin-ichi Nakano, Takuya Tanaka, Hitoha Amano, Kako Ohbayashi, Noboru Okuda, Takafumi Kataoka, Yuki Kobayashi, Ryuji Kondo, Yoshitake Takao, Yuhiko Tanabe, Shingo Hiroishi, Yoshikuni Hodoki, Takamitsu Homma, Makoto M. Watanabe, What is Microcystis aeruginosa? –For the better understanding of Cyanobacterial great outbreak–, Center for Ecological Research, Kyoto University, February 14, 2012. (in Japanese) |
| (Ref.3) |
Nagasaki University publicity CHOHO, The Institute of Tropical Medicine Nagasaki University, Now Hot! Nagasaki University and Kenya No.2, January 10, 2013. (in Japanese) |
| (Ref.4) |
Masahiro Hashizume, Luis Fernando Chaves & Noboru Minakawa, Indian Ocean Dipole drives malaria resurgence in East Africa highland, Scientific Reports 2, Article number: 269, 16 February 2012. |
| (Ref.5) |
Masahiro Hashizume, A.S.G. Faruque, Toru Terao, Md Yunus, Kim Streatfield, Taro Yamamoto, and Kazuhiko Moji, The Indian Ocean Dipole and Cholera Incidence in Bangladesh: A Time-Series Analysis, Environmental Health Perspectives, 2011 February, 119 (2):239-244. |
| (Ref.6) |
Lake Victoria (0314) Height Variations from TOPEX/POSEIDON/Jason-1 and Jason-2/OSTM Altimetry, USDA Foreign Agricultural Service, Crop Explorer. |
| (Ref.7) |
Minakawa N, Dida GO, Sonye GO, Futami K, Njenga SM (2012) Malaria Vectors in Lake Victoria and Adjacent Habitats in Western Kenya. PLoSONE 7(3): e32725. |
| (Ref.8) |
Level3 Selected Monthly Rainfall Data Set, EORC, JAXA. |
|