Seen from Space 2012
Severe Flood in Thailand
|
Thailand was affected by a violent flood from July to December, 2011. The results of the emergency observation using SPOT-5 were reported in “Seen from Space” on October 25, 2011. Spatial observations were also made by the airborne Pi-SAR-L sensor in September and November, 2011, and these results were reported on the “Latest Image” corner of the EORC (Earth Observation Research Center) home page. The image below (Fig. 1) shows the flood in Thailand as observed from space. An animation was created using images taken from November 1 to December 25, 2011 by the GOSAT/CAI* sensor. GOSAT (Greenhouse Gases Observing Satellite) was launched in January 2009. CAI(Cloud and Aerosol Imager) is a sensor on board GOSAT to monitor clouds and aerosols. 
Fig. 1. An image showing the flood in Thailand as observed by GOSAT/CAI; the image is derived from an animation created using images taken from November 1 to December 25, 2011.
The blue area seen in the GOSAT image taken on November 1 shows the region inundated by the flooding of the Chao Phraya River. Note that the city of Ayutthaya looks like an island in a great lake and that the flooding approached Bangkok, the capital of Thailand. As shown in the image taken on December 25, the inundated region shrank as the water withdrew from the Bangkok area. Japanese factories in Thailand were seriously damaged by this flood. *The GOSAT (Greenhouse Gases Observing Satellite) was launched to measure the atmospheric concentrations of carbon dioxide and methane, the two major greenhouse gases, from space. The image data from CAI(Cloud and Aerosol Imager) are used to correct the effects of the clouds and aerosols. 
The old capital, Ayutthaya, a world heritage siteFigure 2 shows an image of the city of Ayutthaya taken on September 22, 2010 by AVNIR-2 (Advanced Visible and Near Infrared Radiometer-2) on board ALOS (Advanced Land Observing Satellite). Ayutthaya was included in the list of world heritage sites. Ayutthaya was prosperous for approximately 420 years beginning in the middle of the fourteenth century. It was the capital of the Ayutthaya dynasty and became an international trade between Europe and East Asia at the beginning of the seventeenth century. The city is surrounded by the Chao Phraya River and its tributaries. The remains of many pagodas and temples still persist within the city. The industrial park in Ayutthaya is seen at the lower right of the image in Fig. 2. Pi-SAR-L also observed the flooded areas of the industrial factories located to the south of Ayutthaya. The observation result of Part 4 (Japanese only) was reported in the Latest Image corner on the EORC homepage on December 12, 2011. 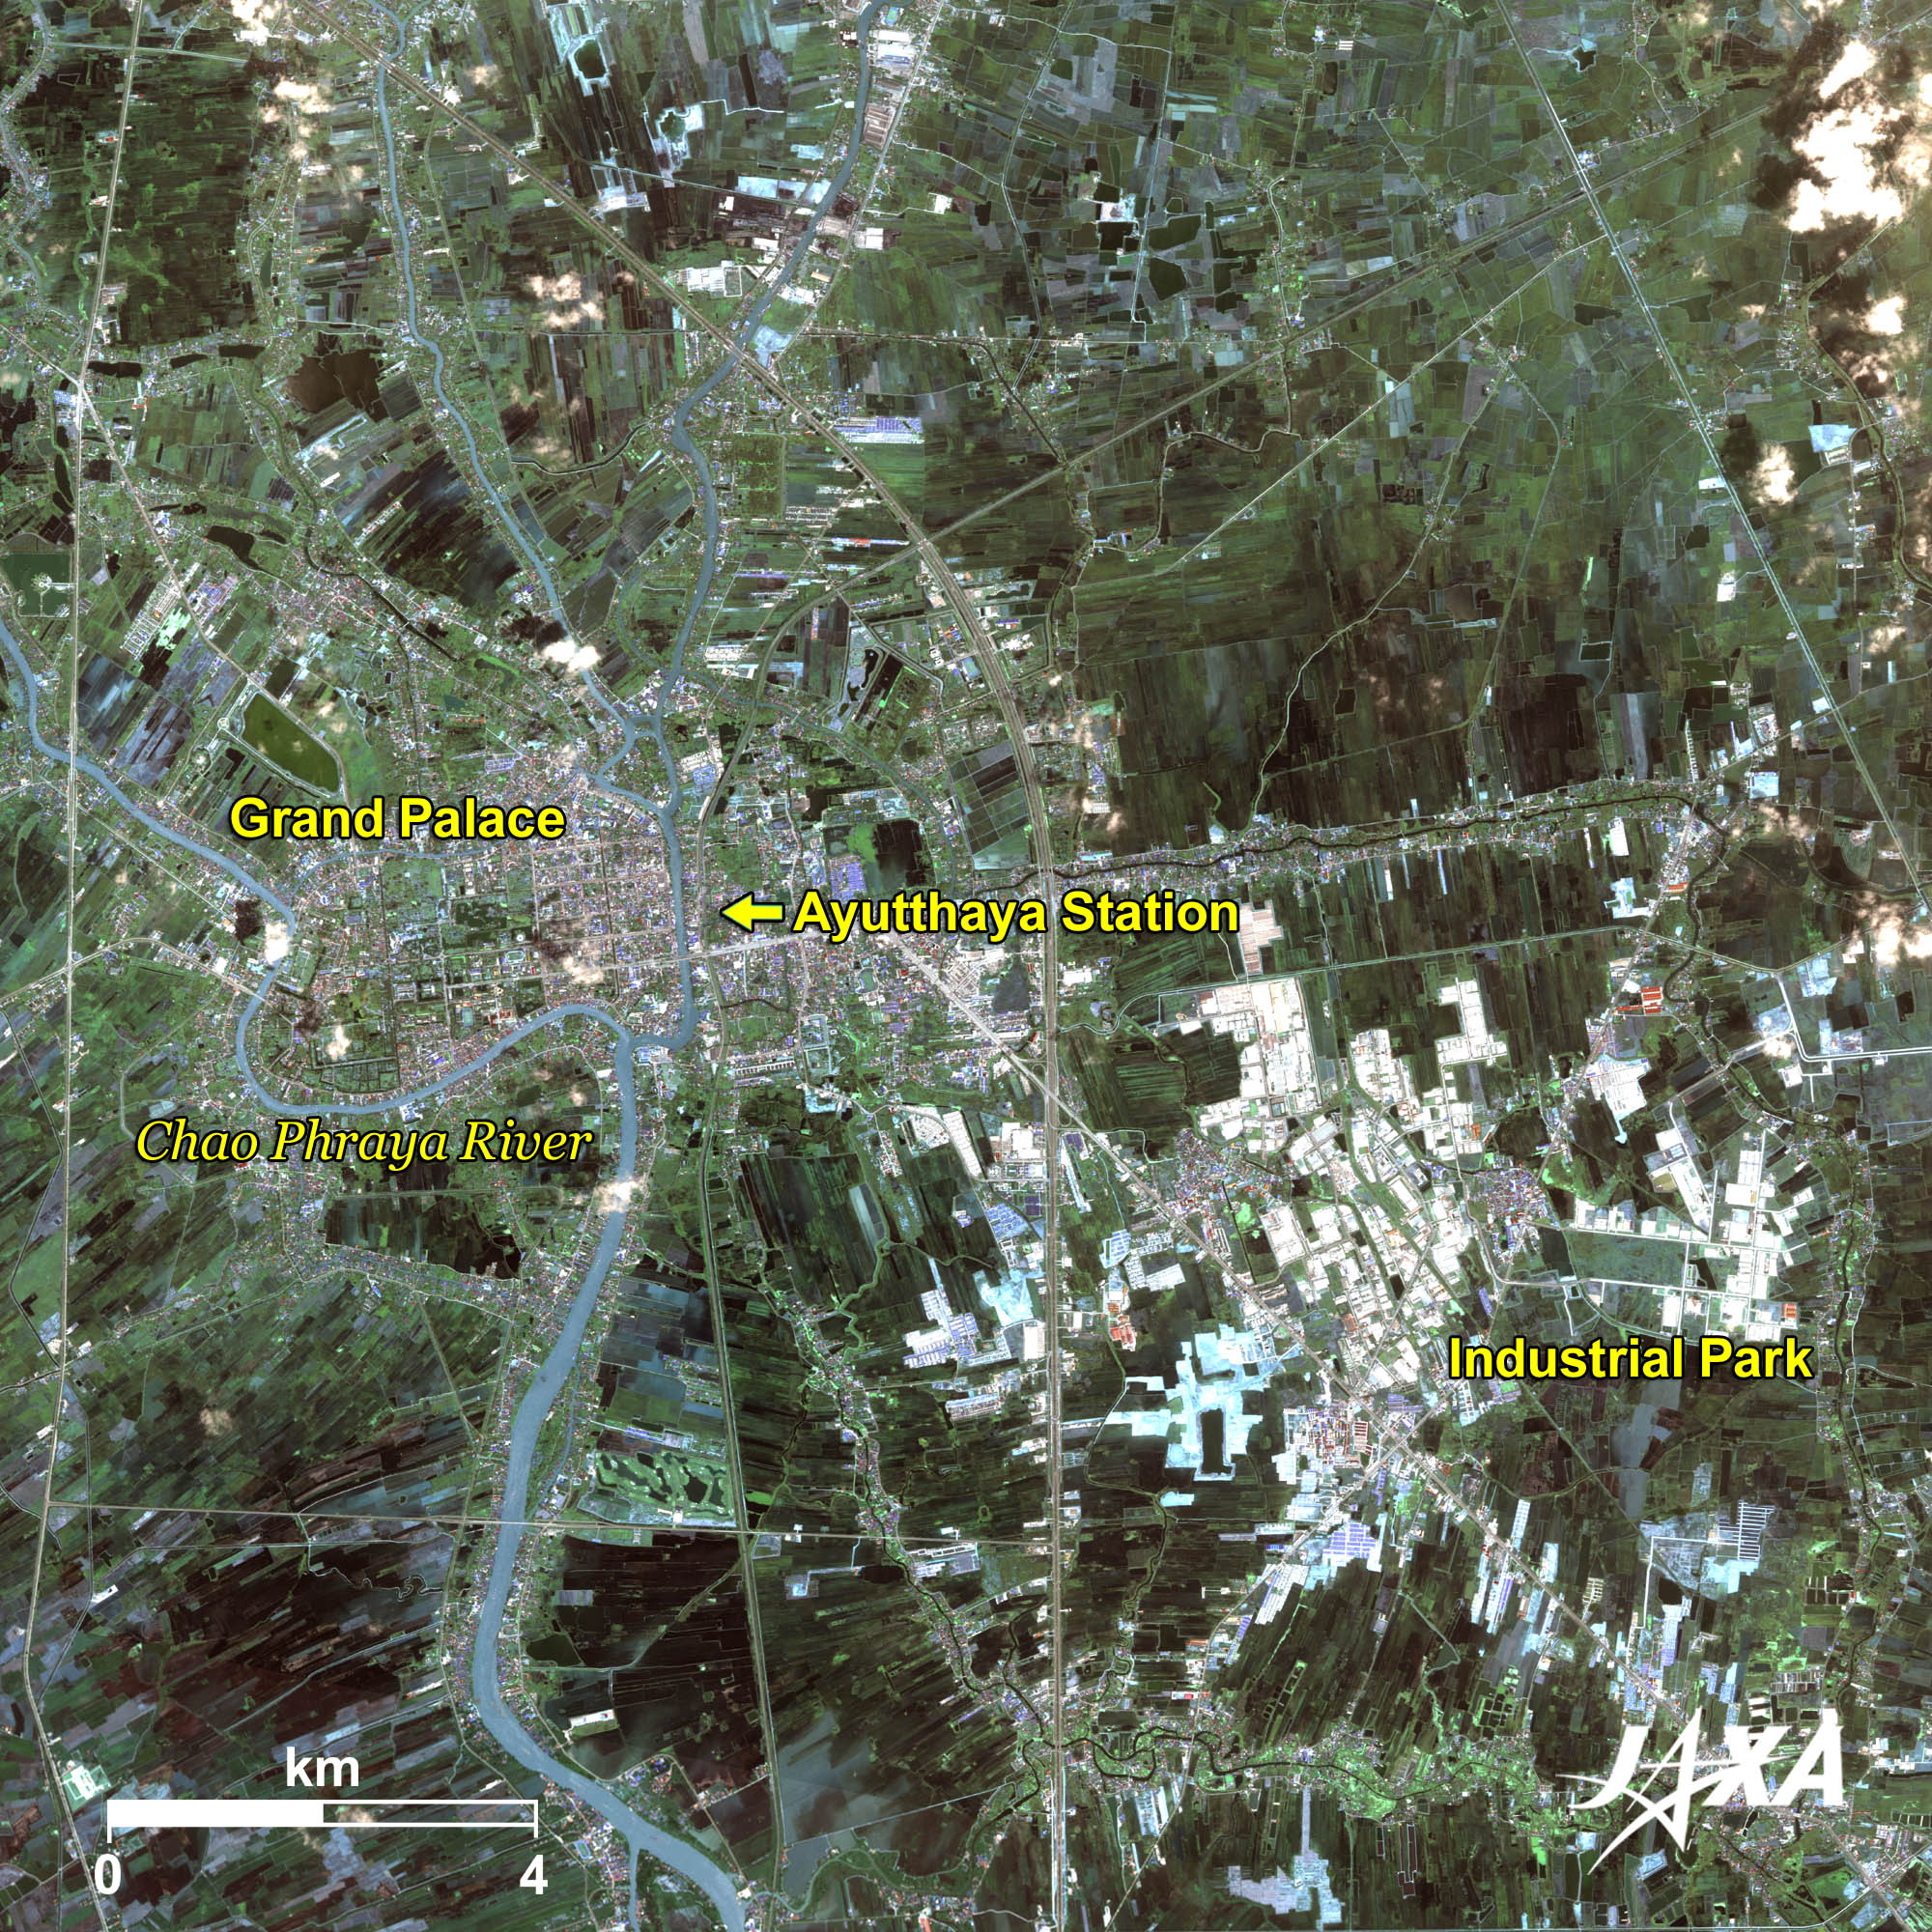
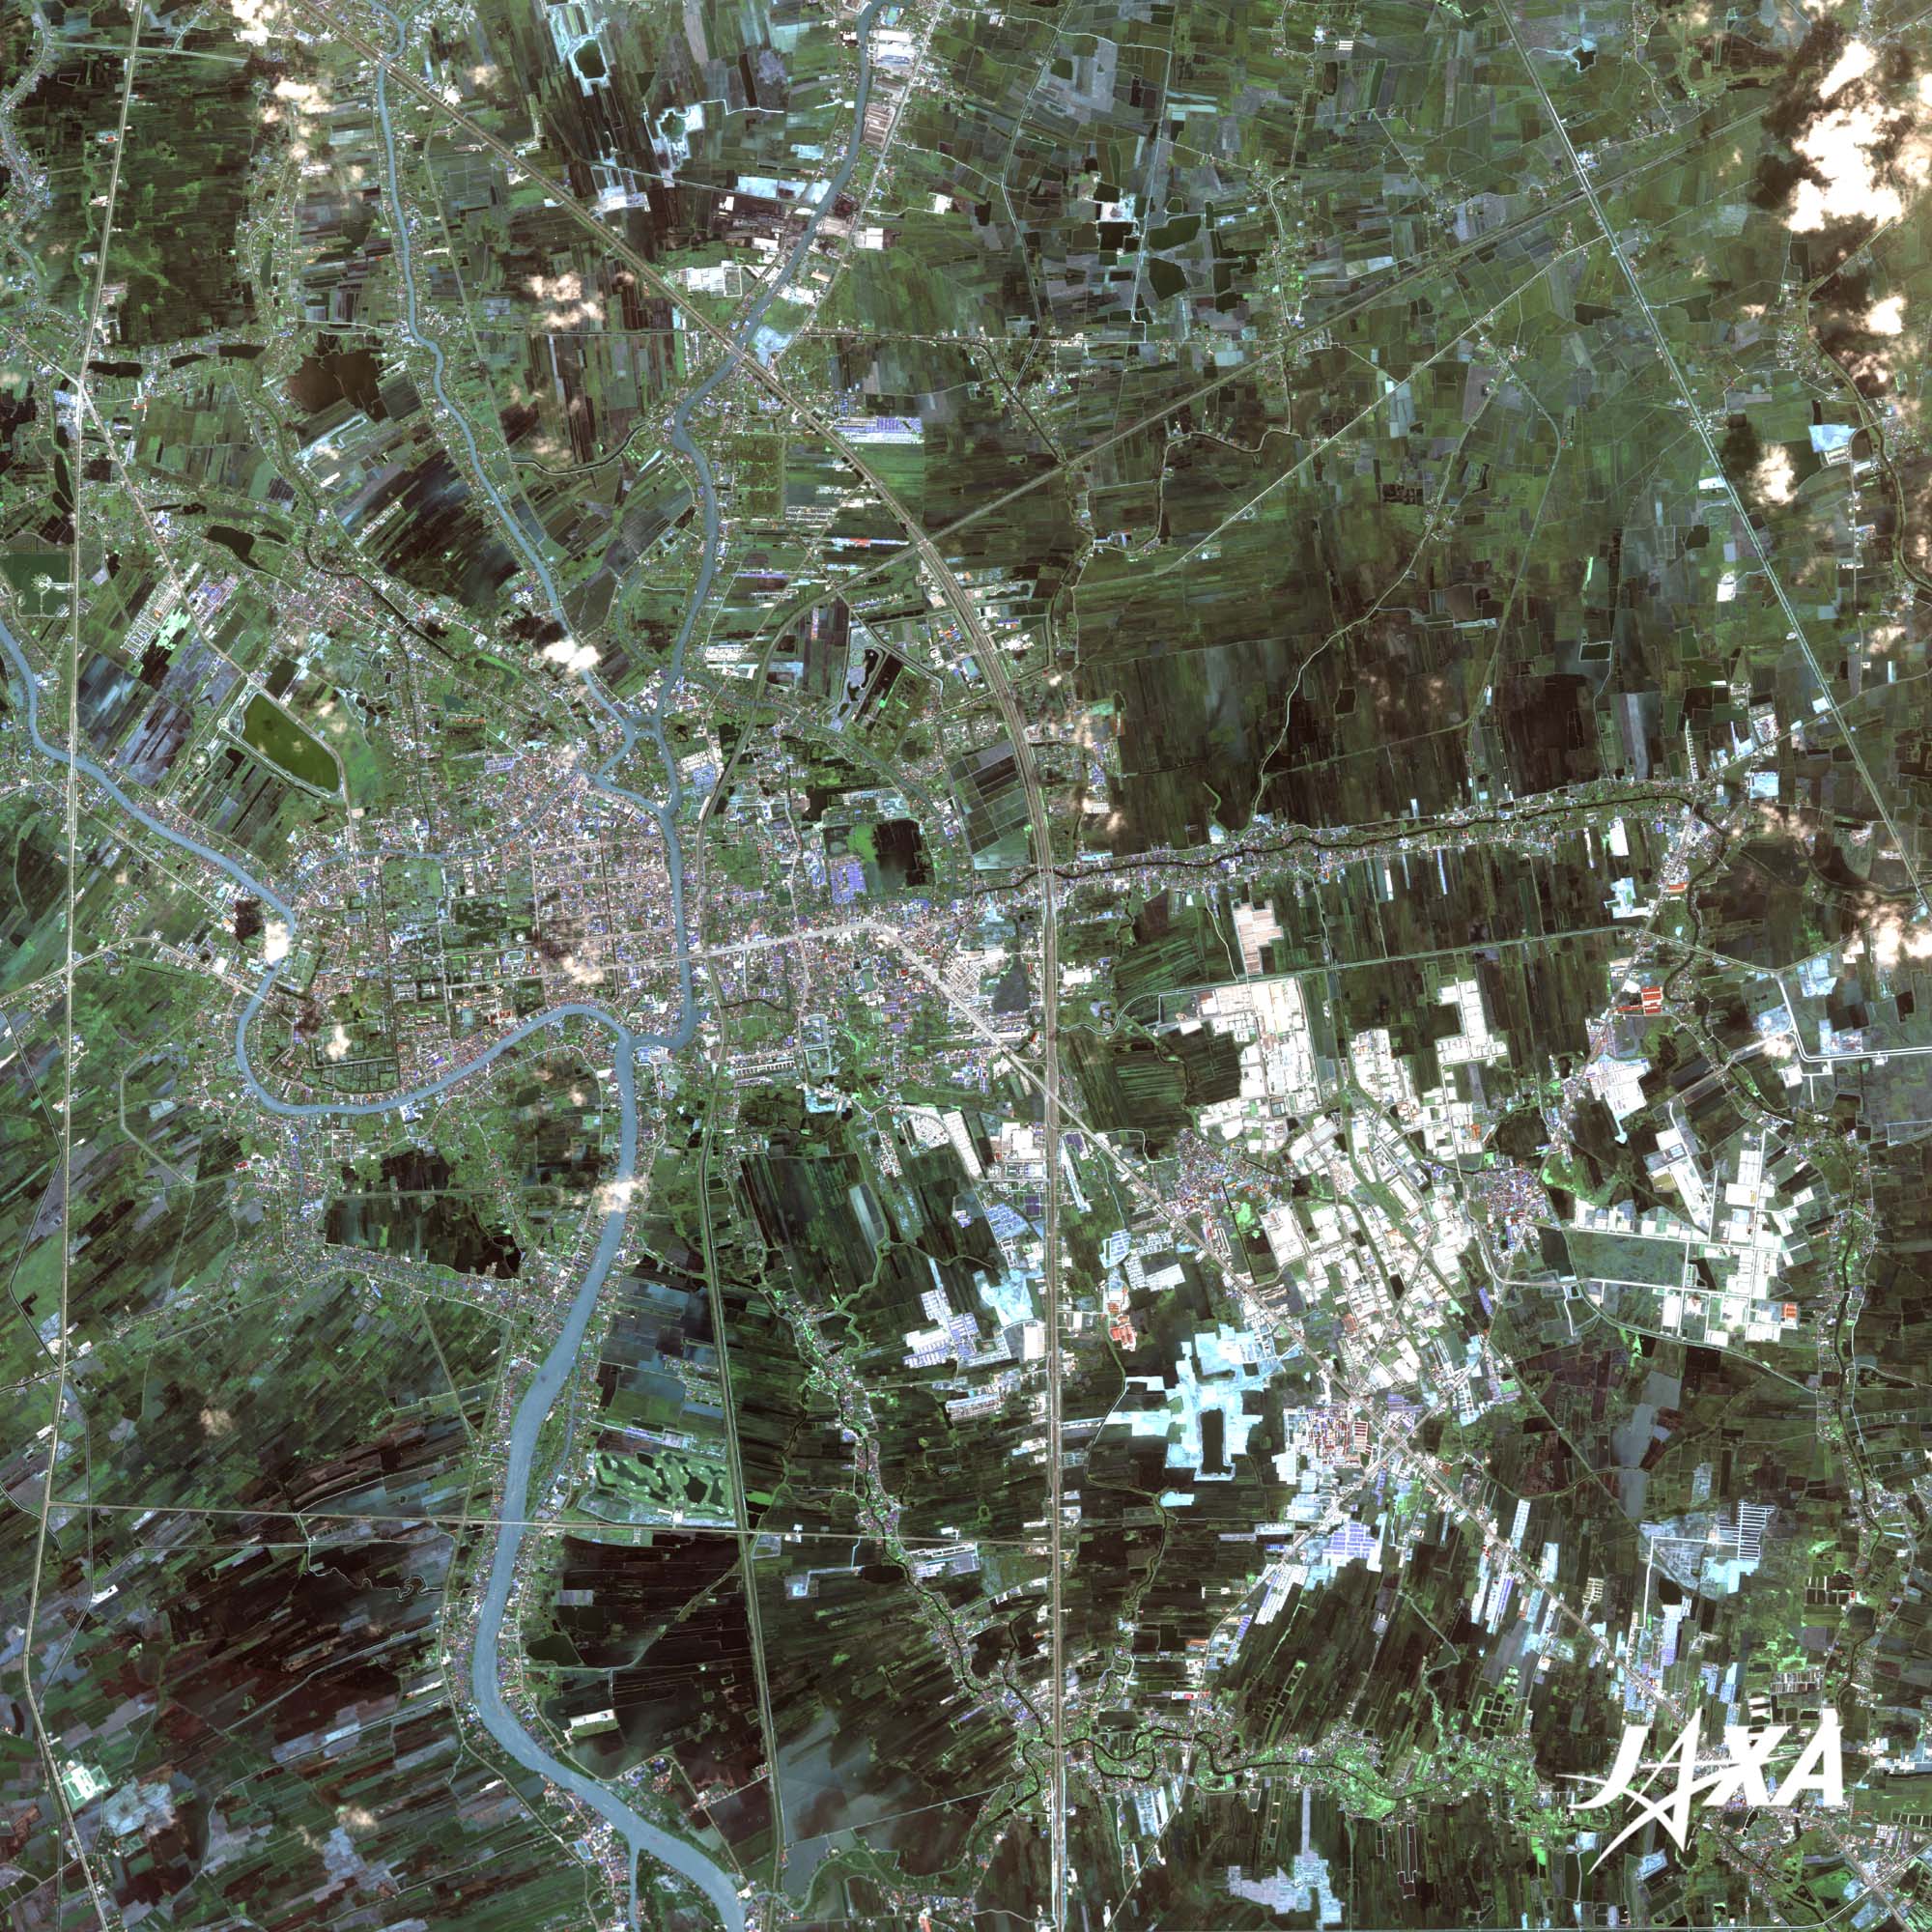
Fig. 2. Ayutthaya and its surroundings
Ayutthaya (kmz, 4.77 MB, Low Resolution) as seen on Google Earth
End of operation of ALOS (Daichi)Operation of the satellite ALOS (Daichi), which was launched on January 24, 2006, ended at 01:50 am (UTC) on May 12, 2011. The satellite operated beyond the three years of its design life and the five years of its target life. ALOS made important contributions to Earth observation, accumulating 6.5 million images around the world and contributing to emergency disaster observation. ALOS obtained over 400 scenes of the Great East Japan Earthquake (March 11, 2011), and its images were provided to ten governmental agencies. Archived images obtained by ALOS will be used in the REDD+ project. Explanation of the Images:
TANSO-CAI is a remote sensor for observing clouds and aerosol and for detecting error sources in measurements of greenhouse gases. TANSO-CAI has four observation bands. Figure 1 was produced by assigning red to Band 2 (664 to 684 nm), green to Band 3 (860 to 880 nm), and blue to Band 1 (370 to 390 nm). The resulting image has natural coloring as if seen by the naked eye. The following colors designate ground objects:
AVNIR-2 has four observation bands. The color composite images in Fig. 2 were produced by assigning red to Band 3 (610 to 690 nm), green to Band 2 (520 to 600 nm), and blue to Band 1 (420 to 500 nm). The resulting images have natural coloring as if seen by the naked eye. Each color indicates the following ground objects:
(Fig. 2) |


