Seen from Space 2011
Iceland: Volcanoes under Glaciers
|
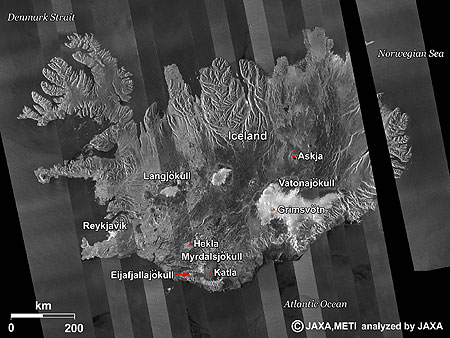
Fig. 1. Full View of Iceland
Figure 1 is a composite radar image of Iceland taken by ALOS (“Daichi”) from March 15, 2010 to April 29, 2010. Iceland is located at the northern edge of the Atlantic Ocean. The island’s name and its geological location give people the impression of a cold, icy island, but thanks to the warm Gulf Stream, its climate is rather mild. The annual average temperature at the capital, Reykjavik, is around 5°C. A volcanic chain runs from the north-northeast to the south-southwest in the middle of the island, a hotspot on the boundary between the Eurasian and North American Plates. Many volcanoes, hot springs, and earthquakes are features shared by Iceland and Japan. Some remarkable glaciers represent Iceland. Vatnajökull (Jökull means glacier in Icelandic) is the largest ice cap in Europe. It is located in the southeast of the island and covers more than 8 percent of the country with an area of 8,100 km2. The total glacial area, including Langjökull in the middle of the island and Mýrdalsjökull in the south, amounts to 11 percent of the total land surface. Those larger glaciers lie in the central and southern parts of the island. 
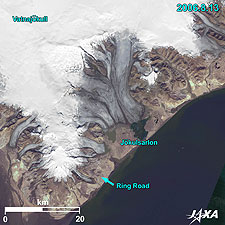
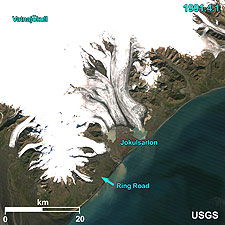
Retreating GlaciersIceland’s glaciers are continuously retreating. They have been retreating even more rapidly during the last decade than in the 1930s and the 1940s when the temperature was unusually high. Fig. 2. Enlarged Image of Southeastern Vatnajökull
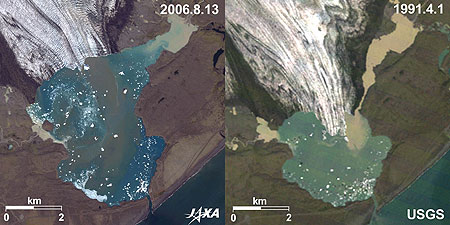
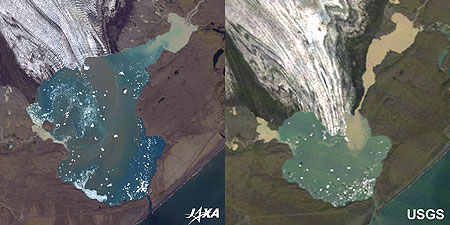
Southeastern Vatnajökull (kmz, 5.63 MB, High Resolution) as seen on Google Earth Figure 2 is an enlarged image of the southeastern Vatnajökull. The left image was taken by ALOS in August 2006 and the right image by Landsat in April 1991. Jökulsárlón, at the tip of the glacier in the middle of the image, is the largest glacier lake (or lagoon) in Iceland. The lake was created when the glacier began its retreat in 1960. The surface area of the lake has expanded remarkably compared to the image of 20 years ago. The present area is about 20 km2 and about 200 meters deep. Figure 3 shows the retreating glacier over 15 years and some large lumps of ice floating upon the lake. Fig. 3. Enlarged Image of Jökulsárlón

Volcanoes under the GlaciersVolcanoes are subglacial in Iceland. Grímsvötn volcano, which lies under Vatnajökull, erupted in October 1996 and resulted in a glacial burst. The eruption melted the ice, which filled the caldera with thawed water, and a huge amount of water burst one month later. Some bridges were washed away and more than 10 km of the ring road around the island was submerged. Fig. 4. Glaciers in Southern Iceland
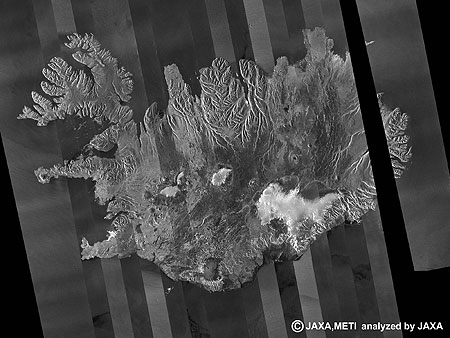
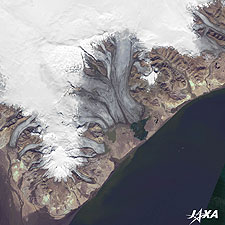
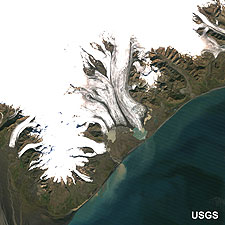
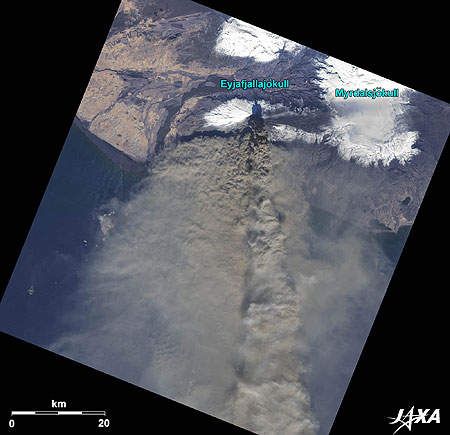
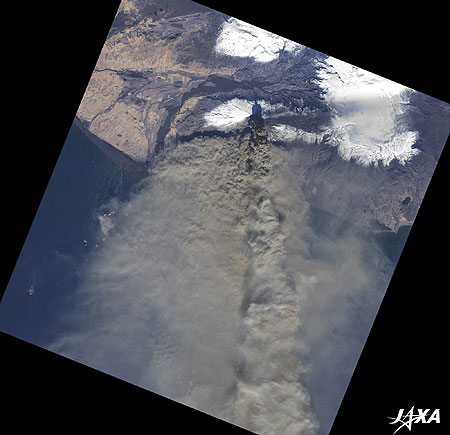
Figure 4 shows an image of the glaciers in southern Iceland taken by ALOS in 2010. Katla, an active volcano, is hidden below Mýrdalsjökull. Katla’s first recorded eruption was in 894 and the most recent eruption was in 1918. Eyjafjallajökull is located next to Mýrdalsjökull. A subglacial volcano under Eyjafjallajökull erupted in April 2010. Volcanic ash plume covered the entire European continent and closed airports in Europe for many days. Another volcano under Eyjafjallajökull, just 10 km away from this volcano, erupted in March. In the past, Katla has erupted just after an Eyjafjallajökull eruption, and thus, Katla might erupt again. There is no evidence, however, that the two volcanoes are related. Explanation of the Images:
Figure 1 is a black and white image of PALSAR. In general, smooth areas indicate water surfaces and blocky areas indicate land.
AVNIR-2 has four observation bands. In Fig. 2-4, the color composite images are produced by assigning red to Band 3 (610 to 690 nm), green to Band 2 (520 to 600 nm), and blue to Band 1 (420 to 500 nm). The resulting images have natural coloring as if seen by the naked eye. Each color indicates the following ground objects:
These image data are downloaded free of charge from the USGS Global Visualization Viewer (Glovis). The color composite images are produced by assigning red to Band 3 (630 to 690 nm), green to Band 2 (520 to 600 nm), and blue to Band 1 (450 to 520 nm). The resulting images have natural coloring as if seen by naked eye. Related Sites
|
