| |
 |
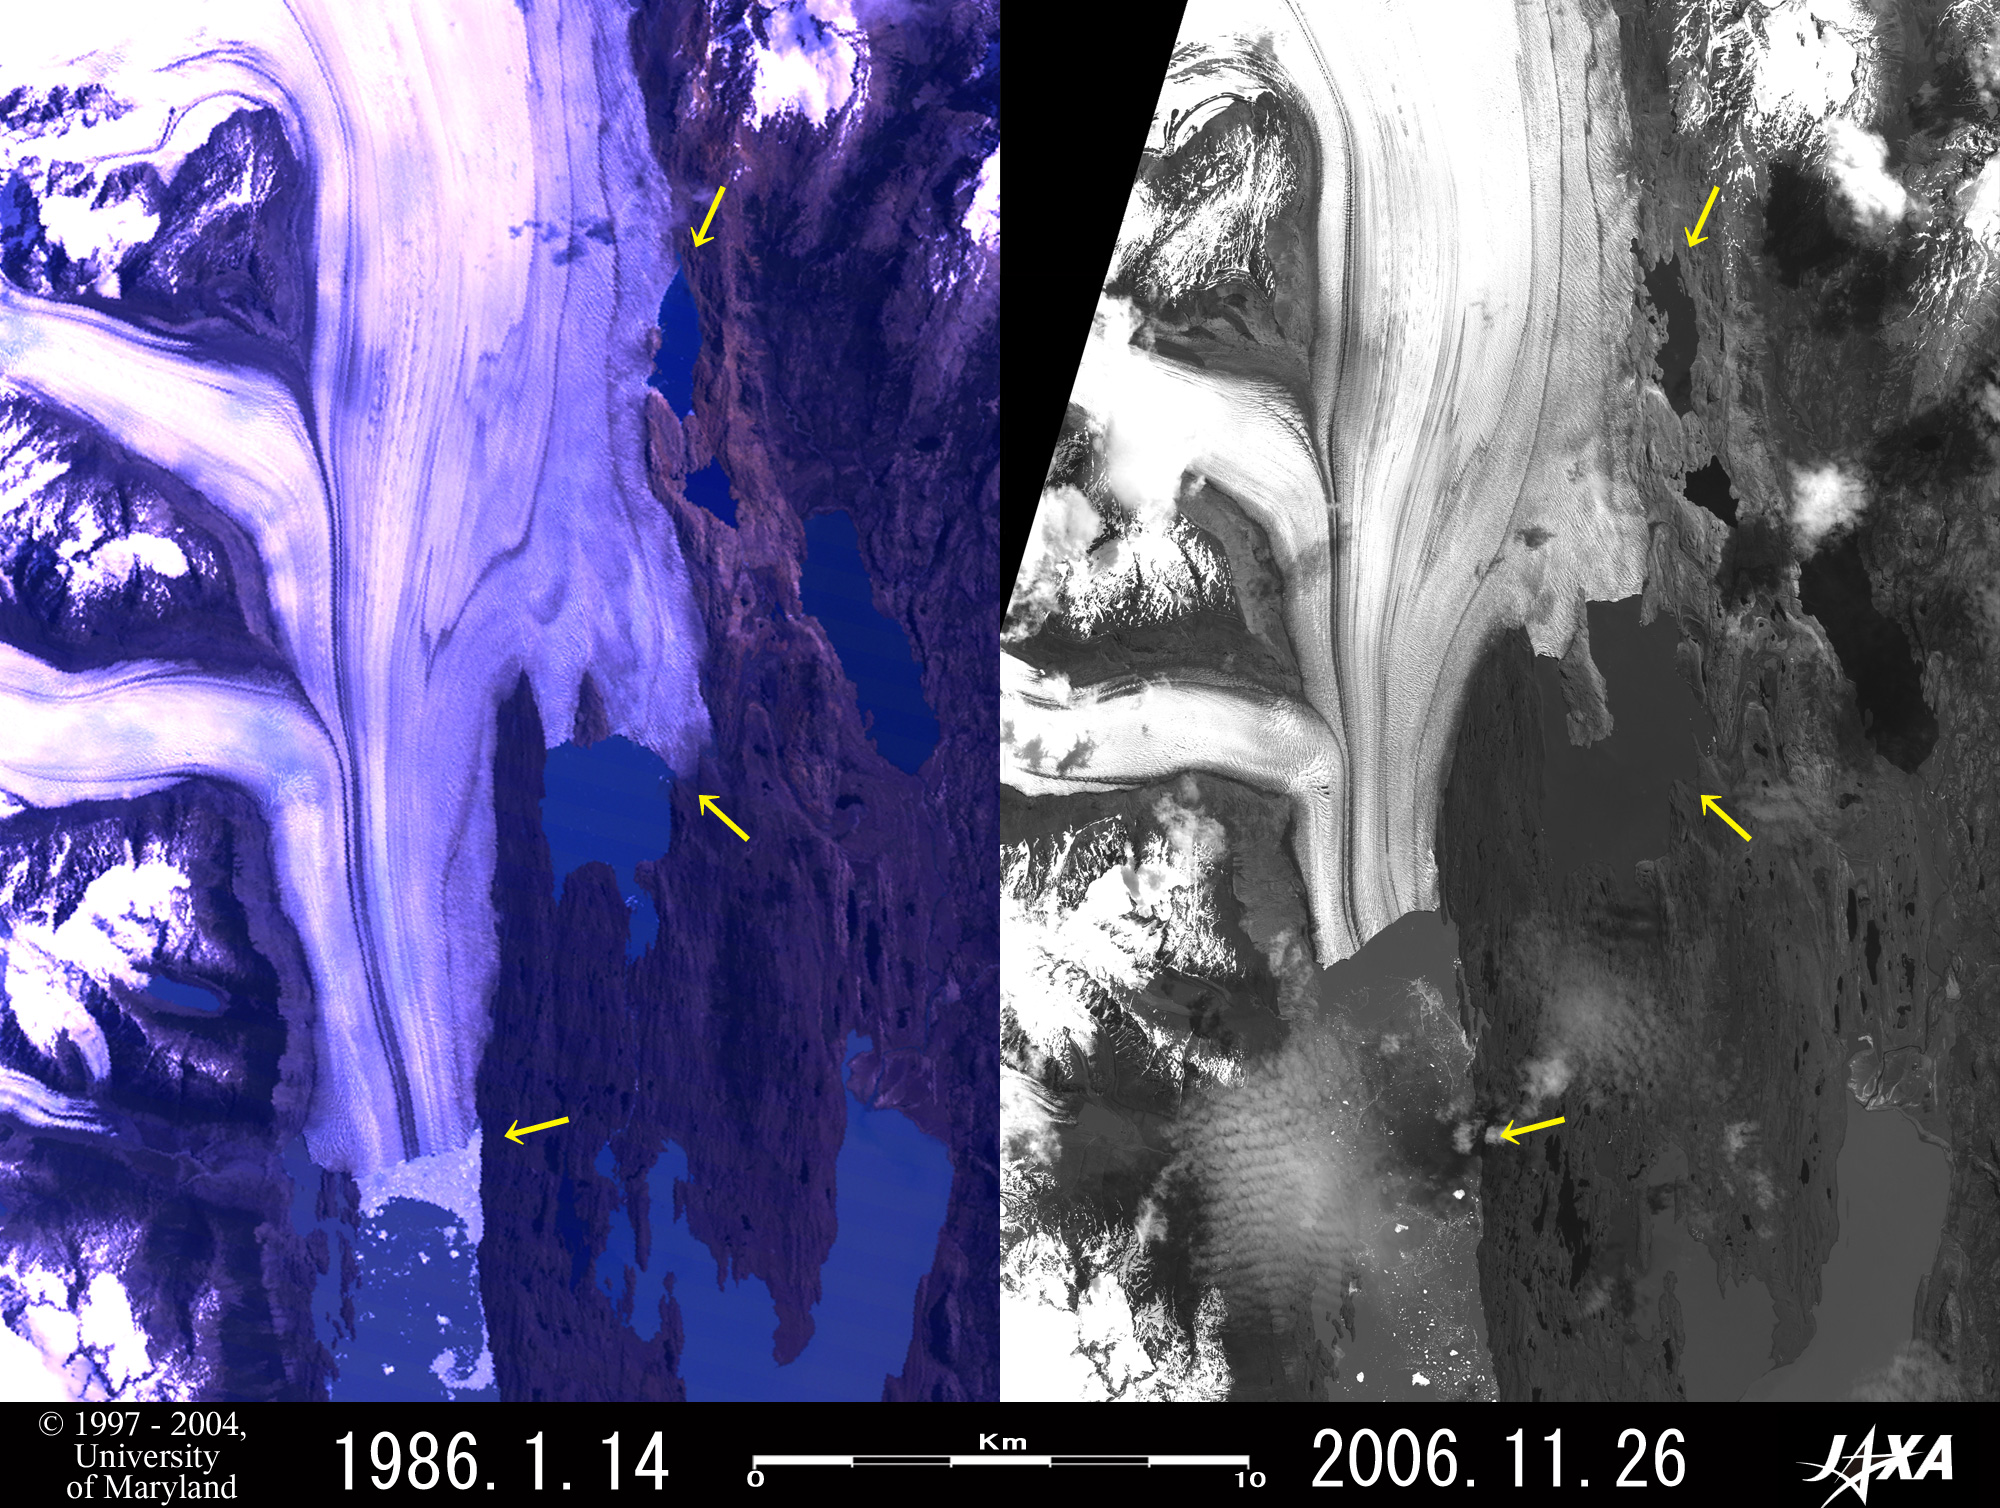
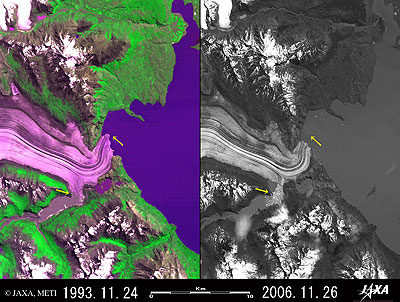
Fig. 1. Retreat of Upsala Glacier
Patagonia (kmz, 1.16 MB, Low Resolution) as seen on Google Earth. |
Figure 1 depicts the Upsala Glacier that flows into Lake Argentino in Patagonia south of 40°S, South America. The left-side image of Fig. 1 and the center of Fig. 2, observed by Landsat 5 in January 1986, indicate that the glacier was 9km wide in the central part and more than 52km long; the detritus scraped off by the flowing glacier appear as blackish stripes. The right side of Fig. 1 depicts the status observed by Advanced Land Observing Satellite "Daichi" in November 2006. The yellow arrows are in the same position on either side, so you can see that the terminal of the glacier retreated 4.6km over a period of about 21 years at the lowest arrows. This means that the glacier retreated 220m a year on average. Also, the arrow at the center indicates that the glacier retreated about 3.5km; the arrow at the top indicates that it shrank about 1.3km. The Upsala Glacier is well known as the most quickly retreating glacier in the world, and is now much more slender.
 |
 |
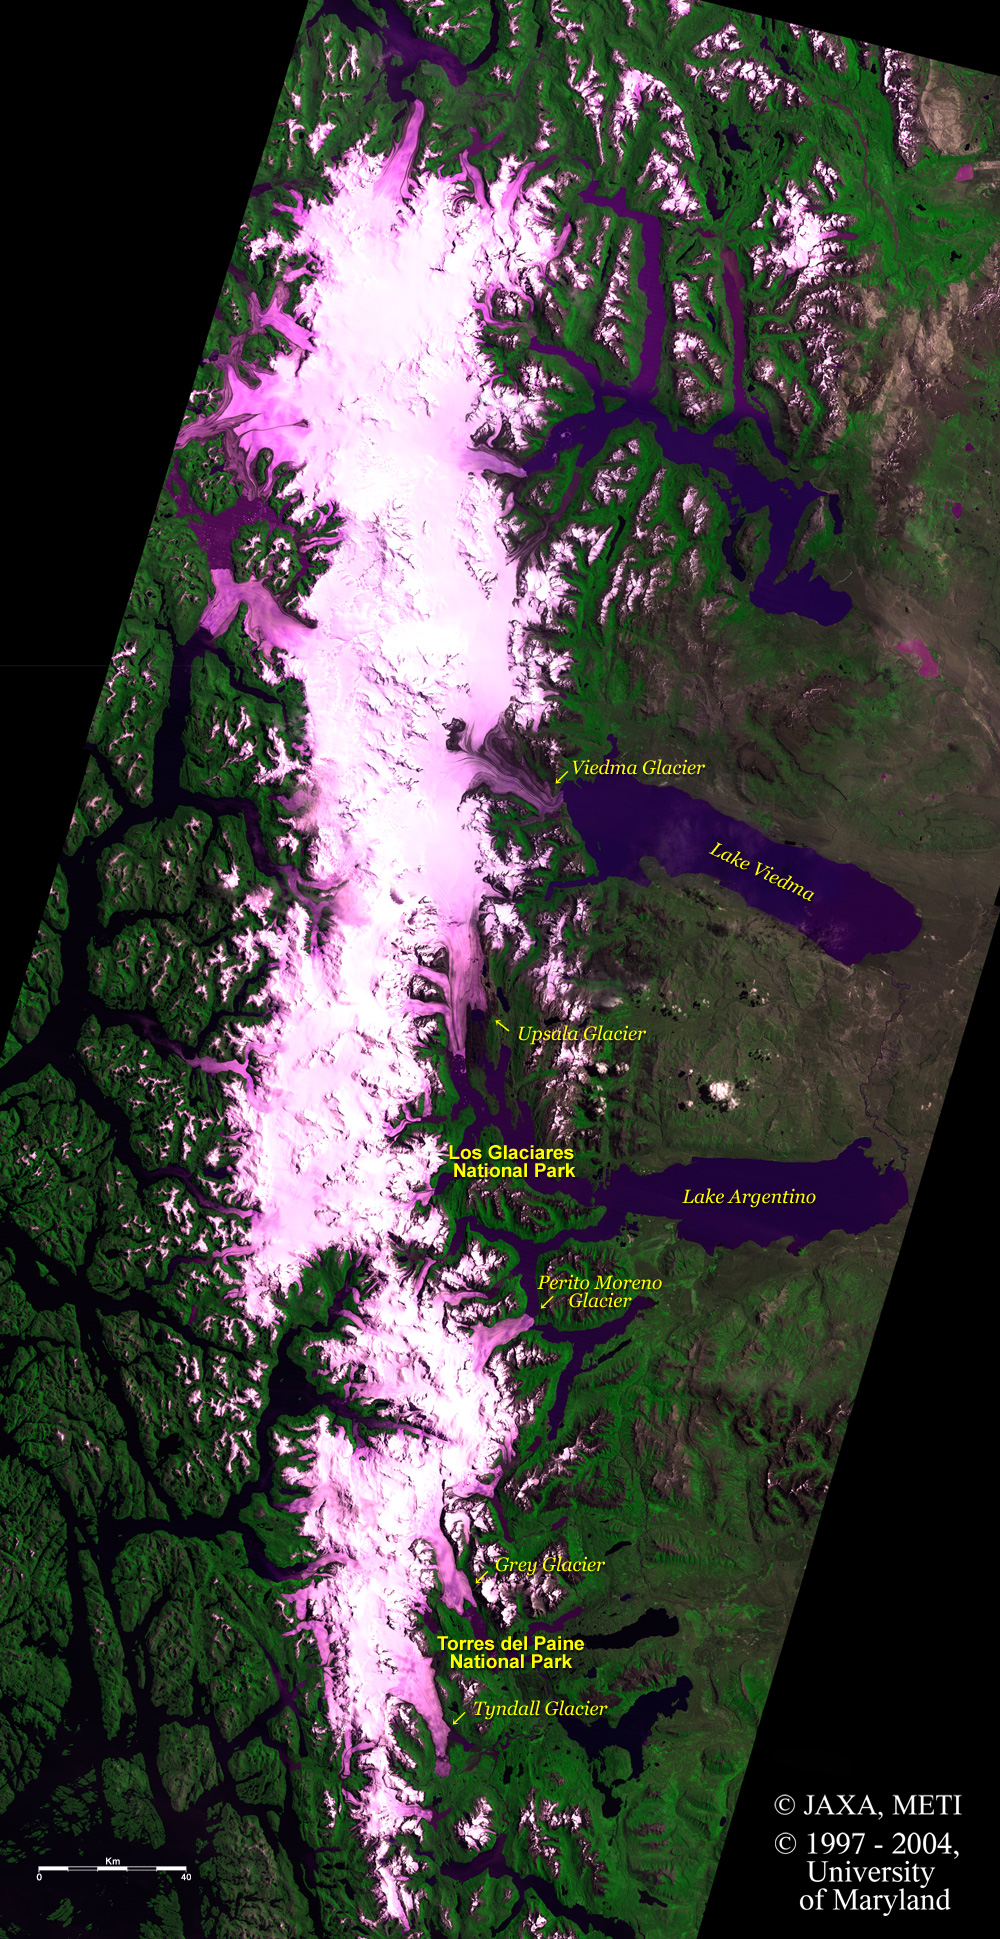
| Fig. 2. Southern Patagonian Ice Field |
Figure 2 is the image of the Southern Patagonian Ice Field that was created by pasting together the images observed by Landsat 5 in December 1984 and January 1986 and the image observed by the Japanese Earth Resources Satellite-1 (Fuyo-1) in November 1993. The Southern Patagonian Ice Field extends north to south, looking white or pale pink with numerous glaciers branching off from there. You can see Lake Viedma (altitude 250m) in the center of the figure and Argentina's largest lake, Lake Argentino (altitude 187m), appears in royal purple south of Lake Viedma. West of the Southern Patagonian Ice Field, the fiords branch into many black lines and connections to the Pacific Ocean can be seen. The other green areas represent growing grass and trees.
Patagonia is proud of its third largest land-ice area, following Antarctica and Greenland, which is also the world's largest mountain glacier. The area reaches 24,000km2, and it is separated into the Northern Patagonian Ice Field near 47°S and the Southern Patagonian Ice Field near 49 to 51°S. A major characteristic is that the land-ice in Patagonia is located in an area of low altitude and high latitude, compared to the glaciers in the Himalayas in areas of high altitude and low latitude.
Patagonia extends over Chile and Argentina, and the Southern Patagonian Ice Field separates into Los Glaciares National Park on the Argentine side and the Torres del Paine National Park on the Chilean side. Los Glaciares National Park
was added to the World Natural Heritage list of the United Nations Educational, Scientific and Cultural Organization (UNESCO) in 1981. Los Glaciares National Park is an area of exceptional natural beauty, with rugged, towering mountains; numerous glacial lakes, including 160km-long Lake Argentino; and glaciers launching massive igloo icebergs into the lake with thunderous splashes.
 |
| Fig. 3. Viedma Glacier |
The left image of Fig. 3 was observed by the Japanese Earth Resources Satellite-1 (Fuyo-1) in November 1993, and the right side was observed by ALOS "Daichi" in November 2006. From Fig. 2, you can find that Viedma Glacier, which flows into Lake Viedma, is 7.5km wide at the center and reaches a length of 57km. Blackish stripes appear to join and meander. The yellow arrows were drawn in the same position on either side of Fig. 3, and you can see that the terminal of the glacier (upper right arrows) has retreated about 800m and that the terminal of the southern branch (lower left arrows) has retreated about 1200m in 13 years.
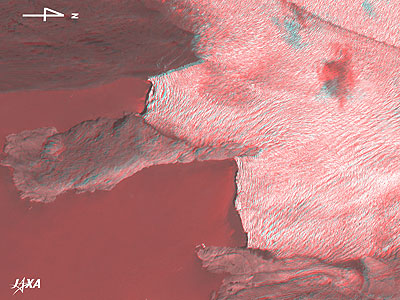 |
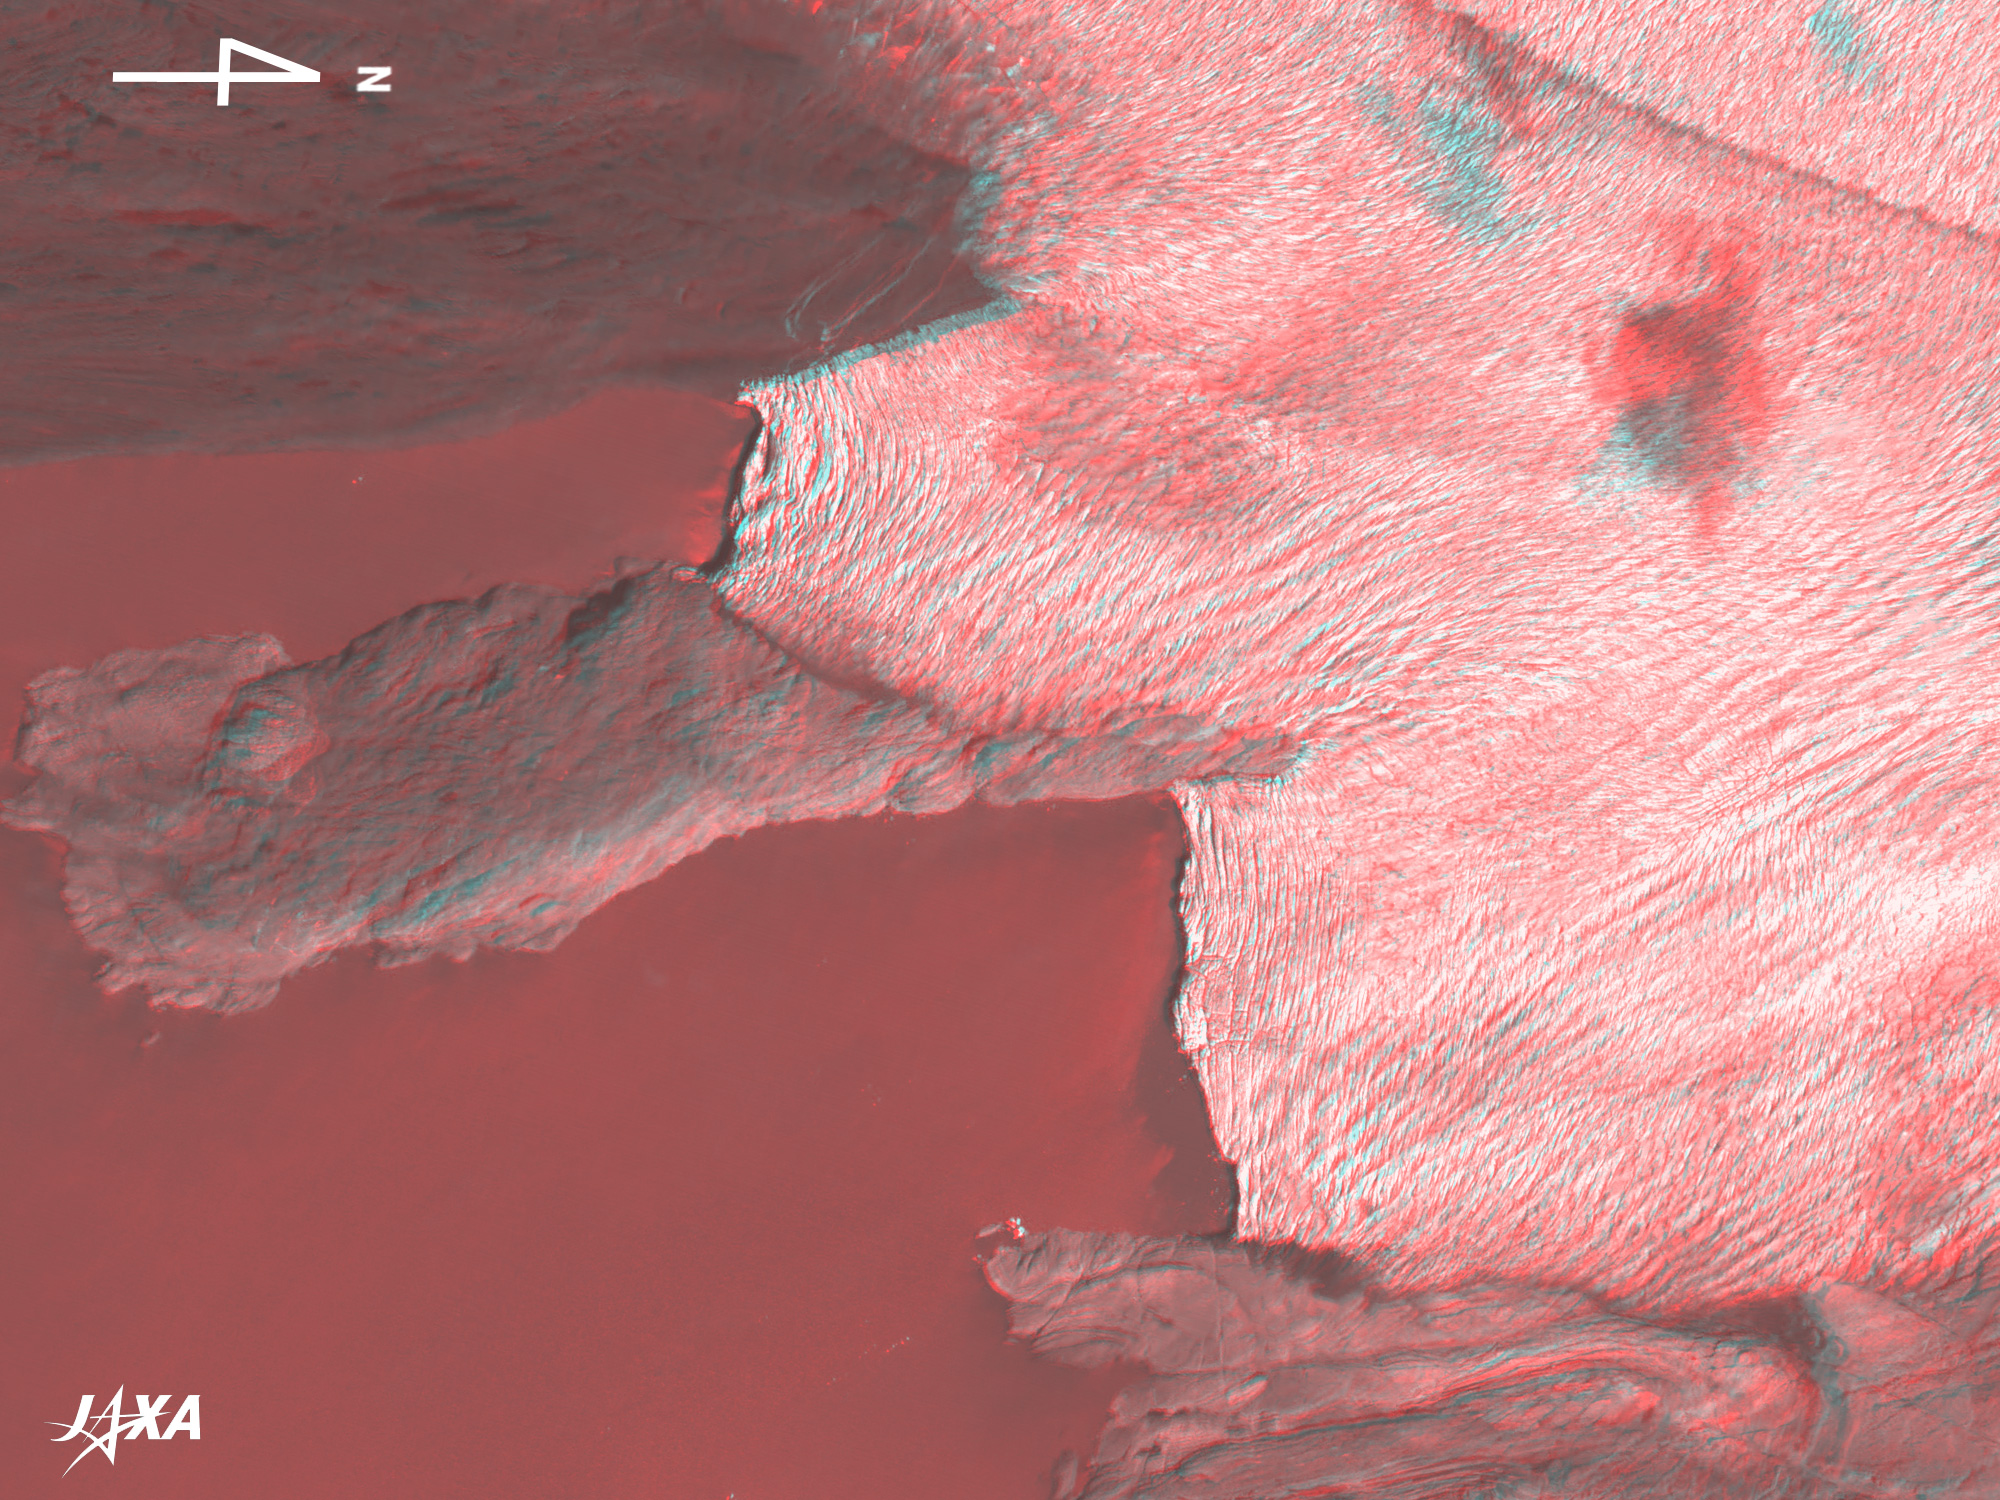
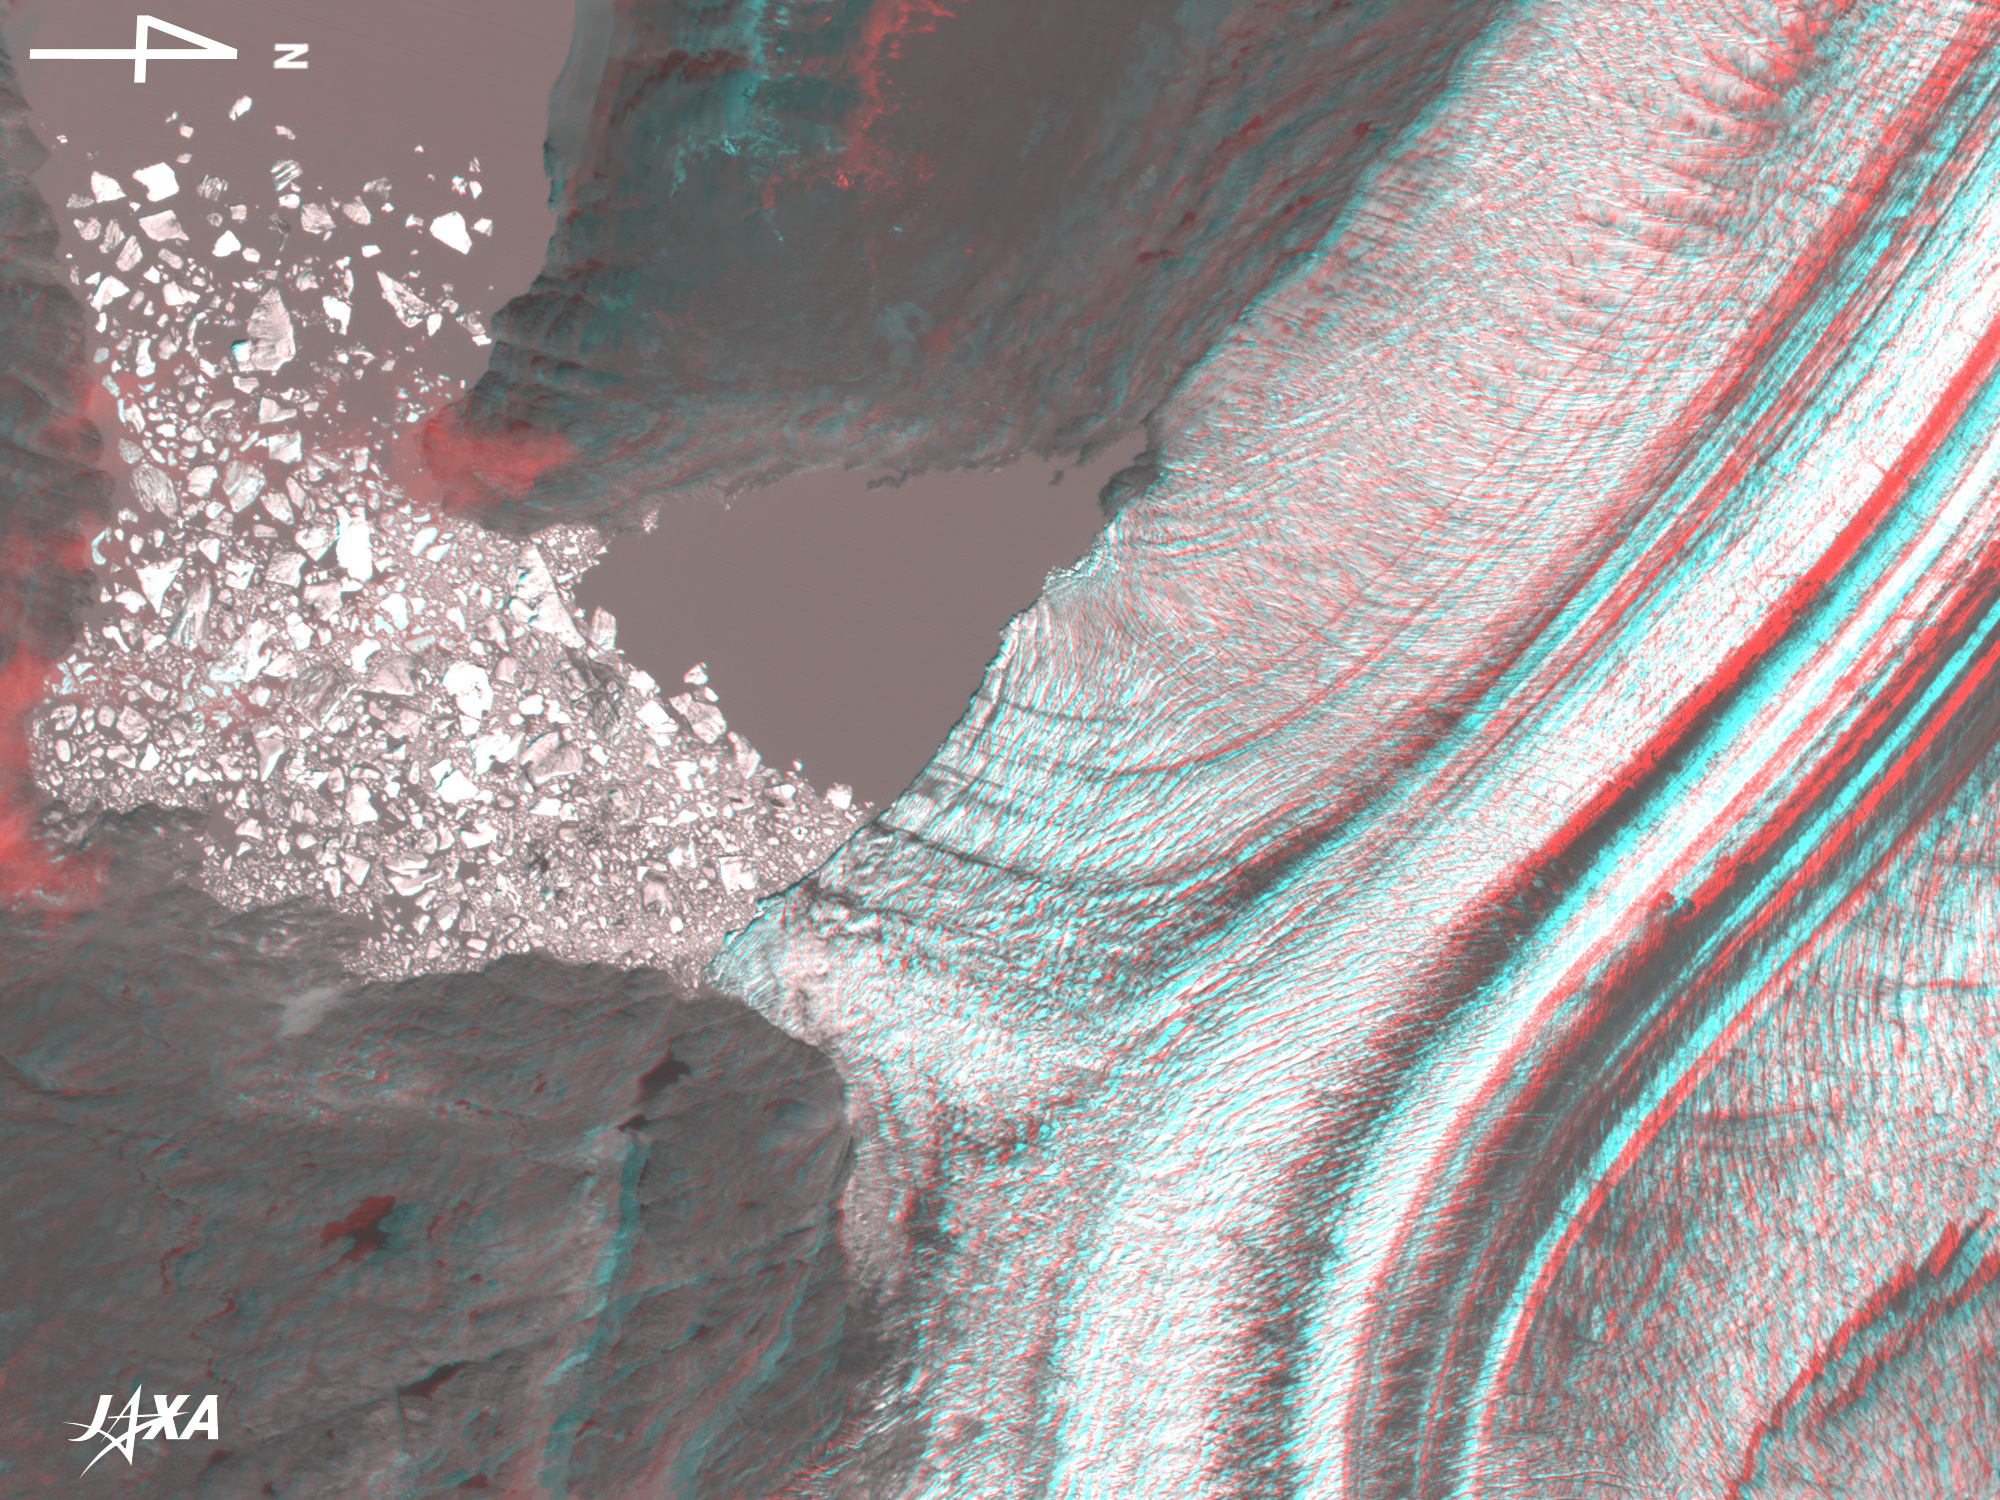
Fig. 4. Three-Dimensional View of the Terminal of Upsala Glacier
(Staring at the image for a long time may cause eye-strain. A color print is available in pdf format. Pdf files for the left and right eyes are also available for stereoscopic viewing.)
|
Figure 4 presents the status of the terminal of the branch on the eastern side of Upsala Glacier observed by ALOS in November 2006. If you view the image through red and blue glasses, you can clearly see that the terminal of the glacier is a cliff. You can also see that the surface of the glacier has a lot of deeply inscribed wrinkles and looks like a pin cushion, instead of a flat surface.
 |
Fig. 5. Three-Dimensional View of the Terminal of Viedma Glacier
(Staring at the image for a long time may cause eye-strain. A color print is available in pdf format. Pdf files for the left and right eyes are also available for stereoscopic viewing.)
|
Figure 5 presents an image of the terminal of the branch on the southern side of the Viedma Glacier observed by ALOS in November 2006. Viewing the image with red and blue glasses, you can clearly recognize that the terminal of the glacier is a cliff. You can also see many wrinkles inscribed on the surface of the glacier, though they are not as steep as those of the Upsala Glacier. In the glacial lake, there are countless icebergs, which were formed after the collapse of the terminal of the glacier.
Reference
* Hokkaido University Patagonia Project Committee, Hyoga to iwa to mori no kuni (in Japanese) (the country of the glaciers, rocks and forests), Hokkaido University Press, 1974
Reference Site
 How to make the red and blue colored glasses(See Appendix of Three-Dimensional View of Mt. Haruna.) How to make the red and blue colored glasses(See Appendix of Three-Dimensional View of Mt. Haruna.)
|
Explanation of the Images:
(Right side of Figs. 1 and 3; Figs. 4 and 5)
PRISM is an optical sensor for observing ground surfaces with visible and near-infrared signals in the 520 to 770 nanometer (one-billionth of a meter) band. The acquired image is monochrome. PRISM has three independent optical systems (telescopes) to acquire images for nadir, forward, and backward views at the same time so that terrain data including altitude data can be obtained. Figures 4 and 5 were composed using the nadir-looking image (red) and the forward-looking image (green and blue). In Figs. 4 and 5, the satellite is traveling to the left because the nadir view from the satellite is seen with the left eye and the forward view with the right eye. Note that the right side is north in Figs. 4 and 5, but the upper side is north in Figs. 1 to 3.
(Left side image of Fig. 1 and major part of Fig. 2)
| Satellite: |
Landsat-5 (USA) |
| Sensor: |
Thematic Mapper (TM)
|
| Date: |
January 14, 1986 (UTC) (left side of Fig. 1 and center and lower part of Fig. 2)
December 26, 1984 (UTC) (upper part of Fig. 2)
|
| Ground resolution: |
30m |
| Map Projection: |
Universal Transversal Mercator (UTM) |
Here we used data downloaded free of charge from the site of Global Land Cover Facility (GLCF) Earth Science Data Interface operated by the University of Maryland, USA.
The left side image of Fig. 1 was composed by assigning red to visible Band 3 (630 to 690nm), green to visible Band 2 (520 to 600nm), and blue to visible Band 1 (450 to 520nm). The resulting images have natural coloring as if seen by the naked eye. In this image, vegetation is green, snow and clouds are white, exposed rocks are brownish, and water surfaces are blue.
Figure 2 was composed by assigning green to near-infrared Band 4 (760 to 900nm), red to visible Band 3 (630 to 690nm), and blue to visible Band 2 (520 to 600nm). In this image, vegetation is vivid green, snow and ice are white or pinkish, exposed rocks are dark brown, and water surfaces are black.
(A part of upper Fig. 2 and left side of Fig. 3)
The figure was produced by assigning red to the visible channel (630 to 690nm), green to the near-infrared channel (760 to 860nm), and blue to the visible channel (520 to 600nm). As a result, the figure has the same coloring as the Landsat image of the major part of Fig. 2.
|
|