| |
 |
 |
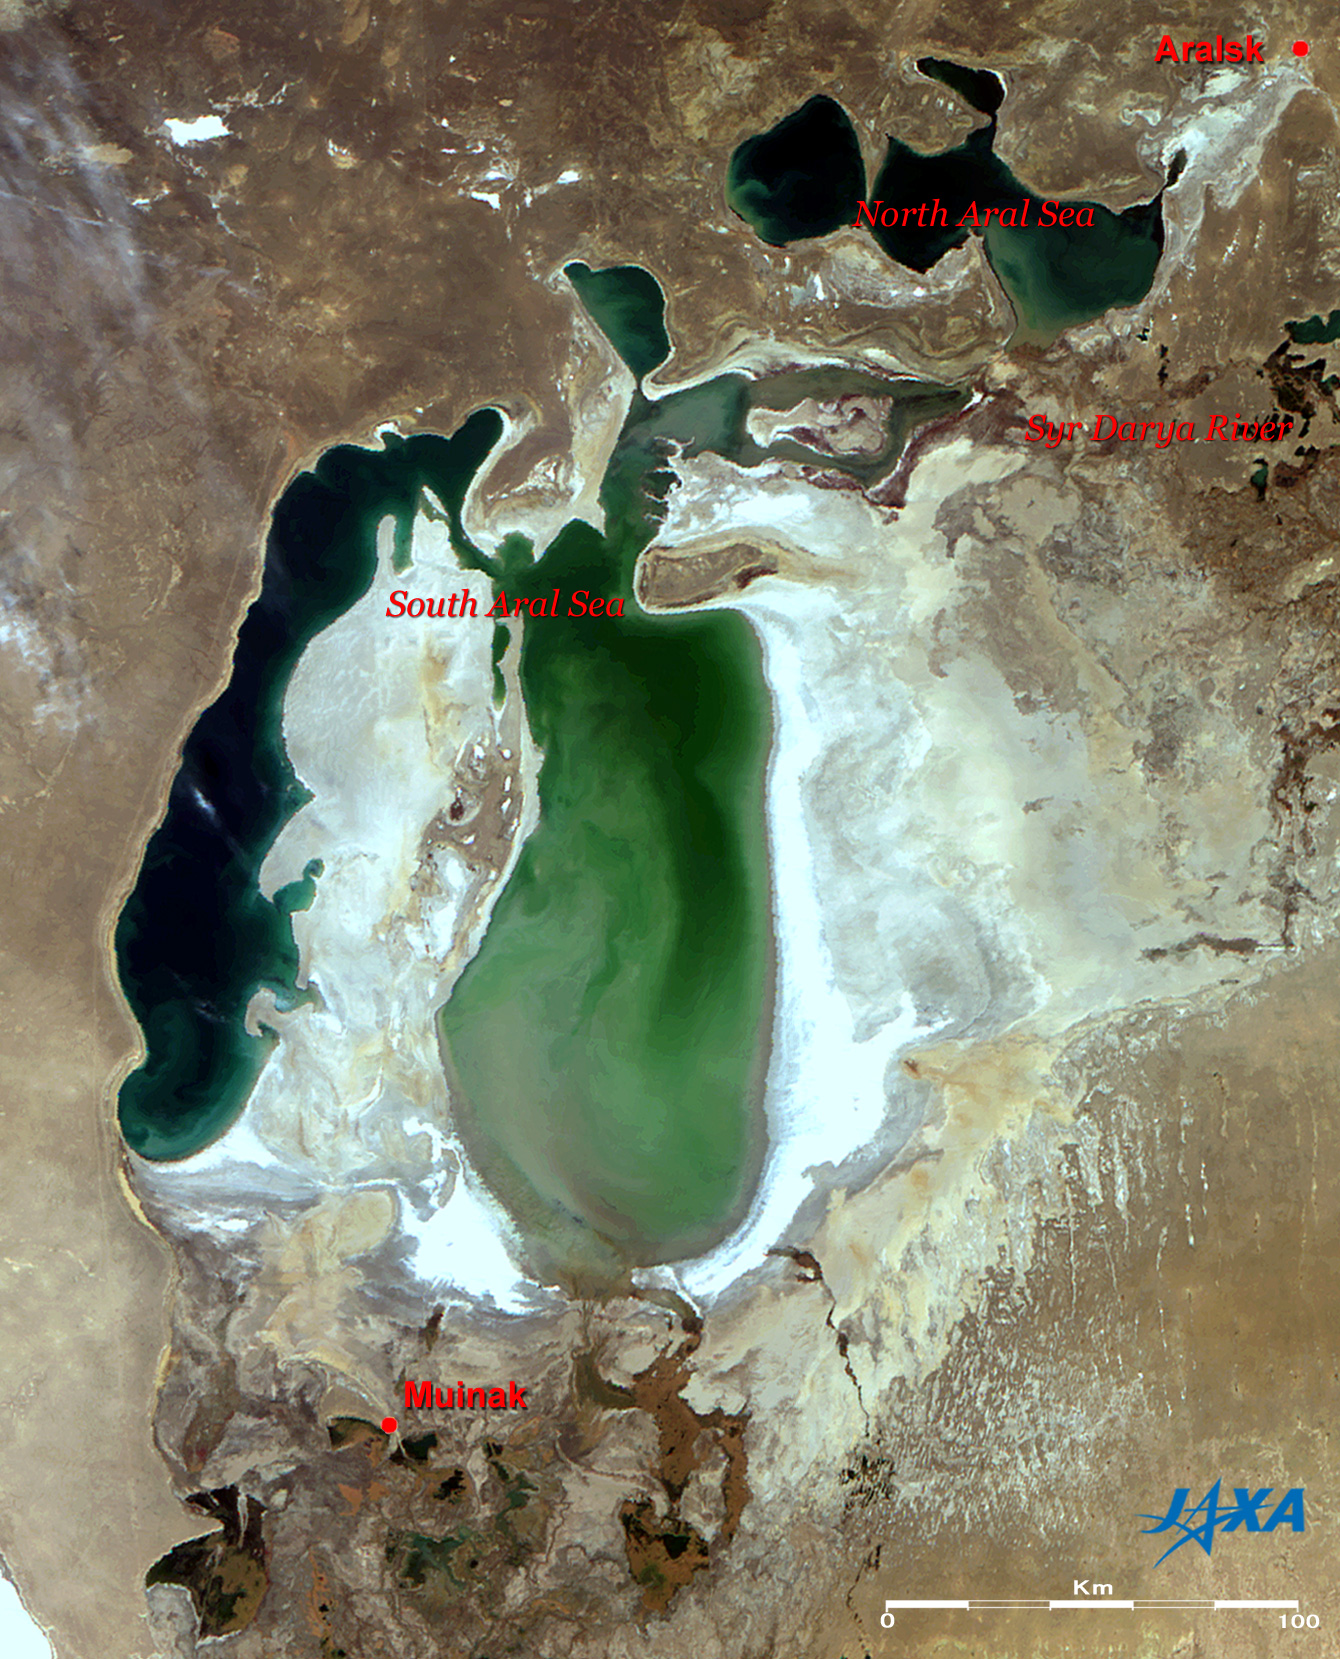
| Fig. 1 Aral Sea in October 2003 |
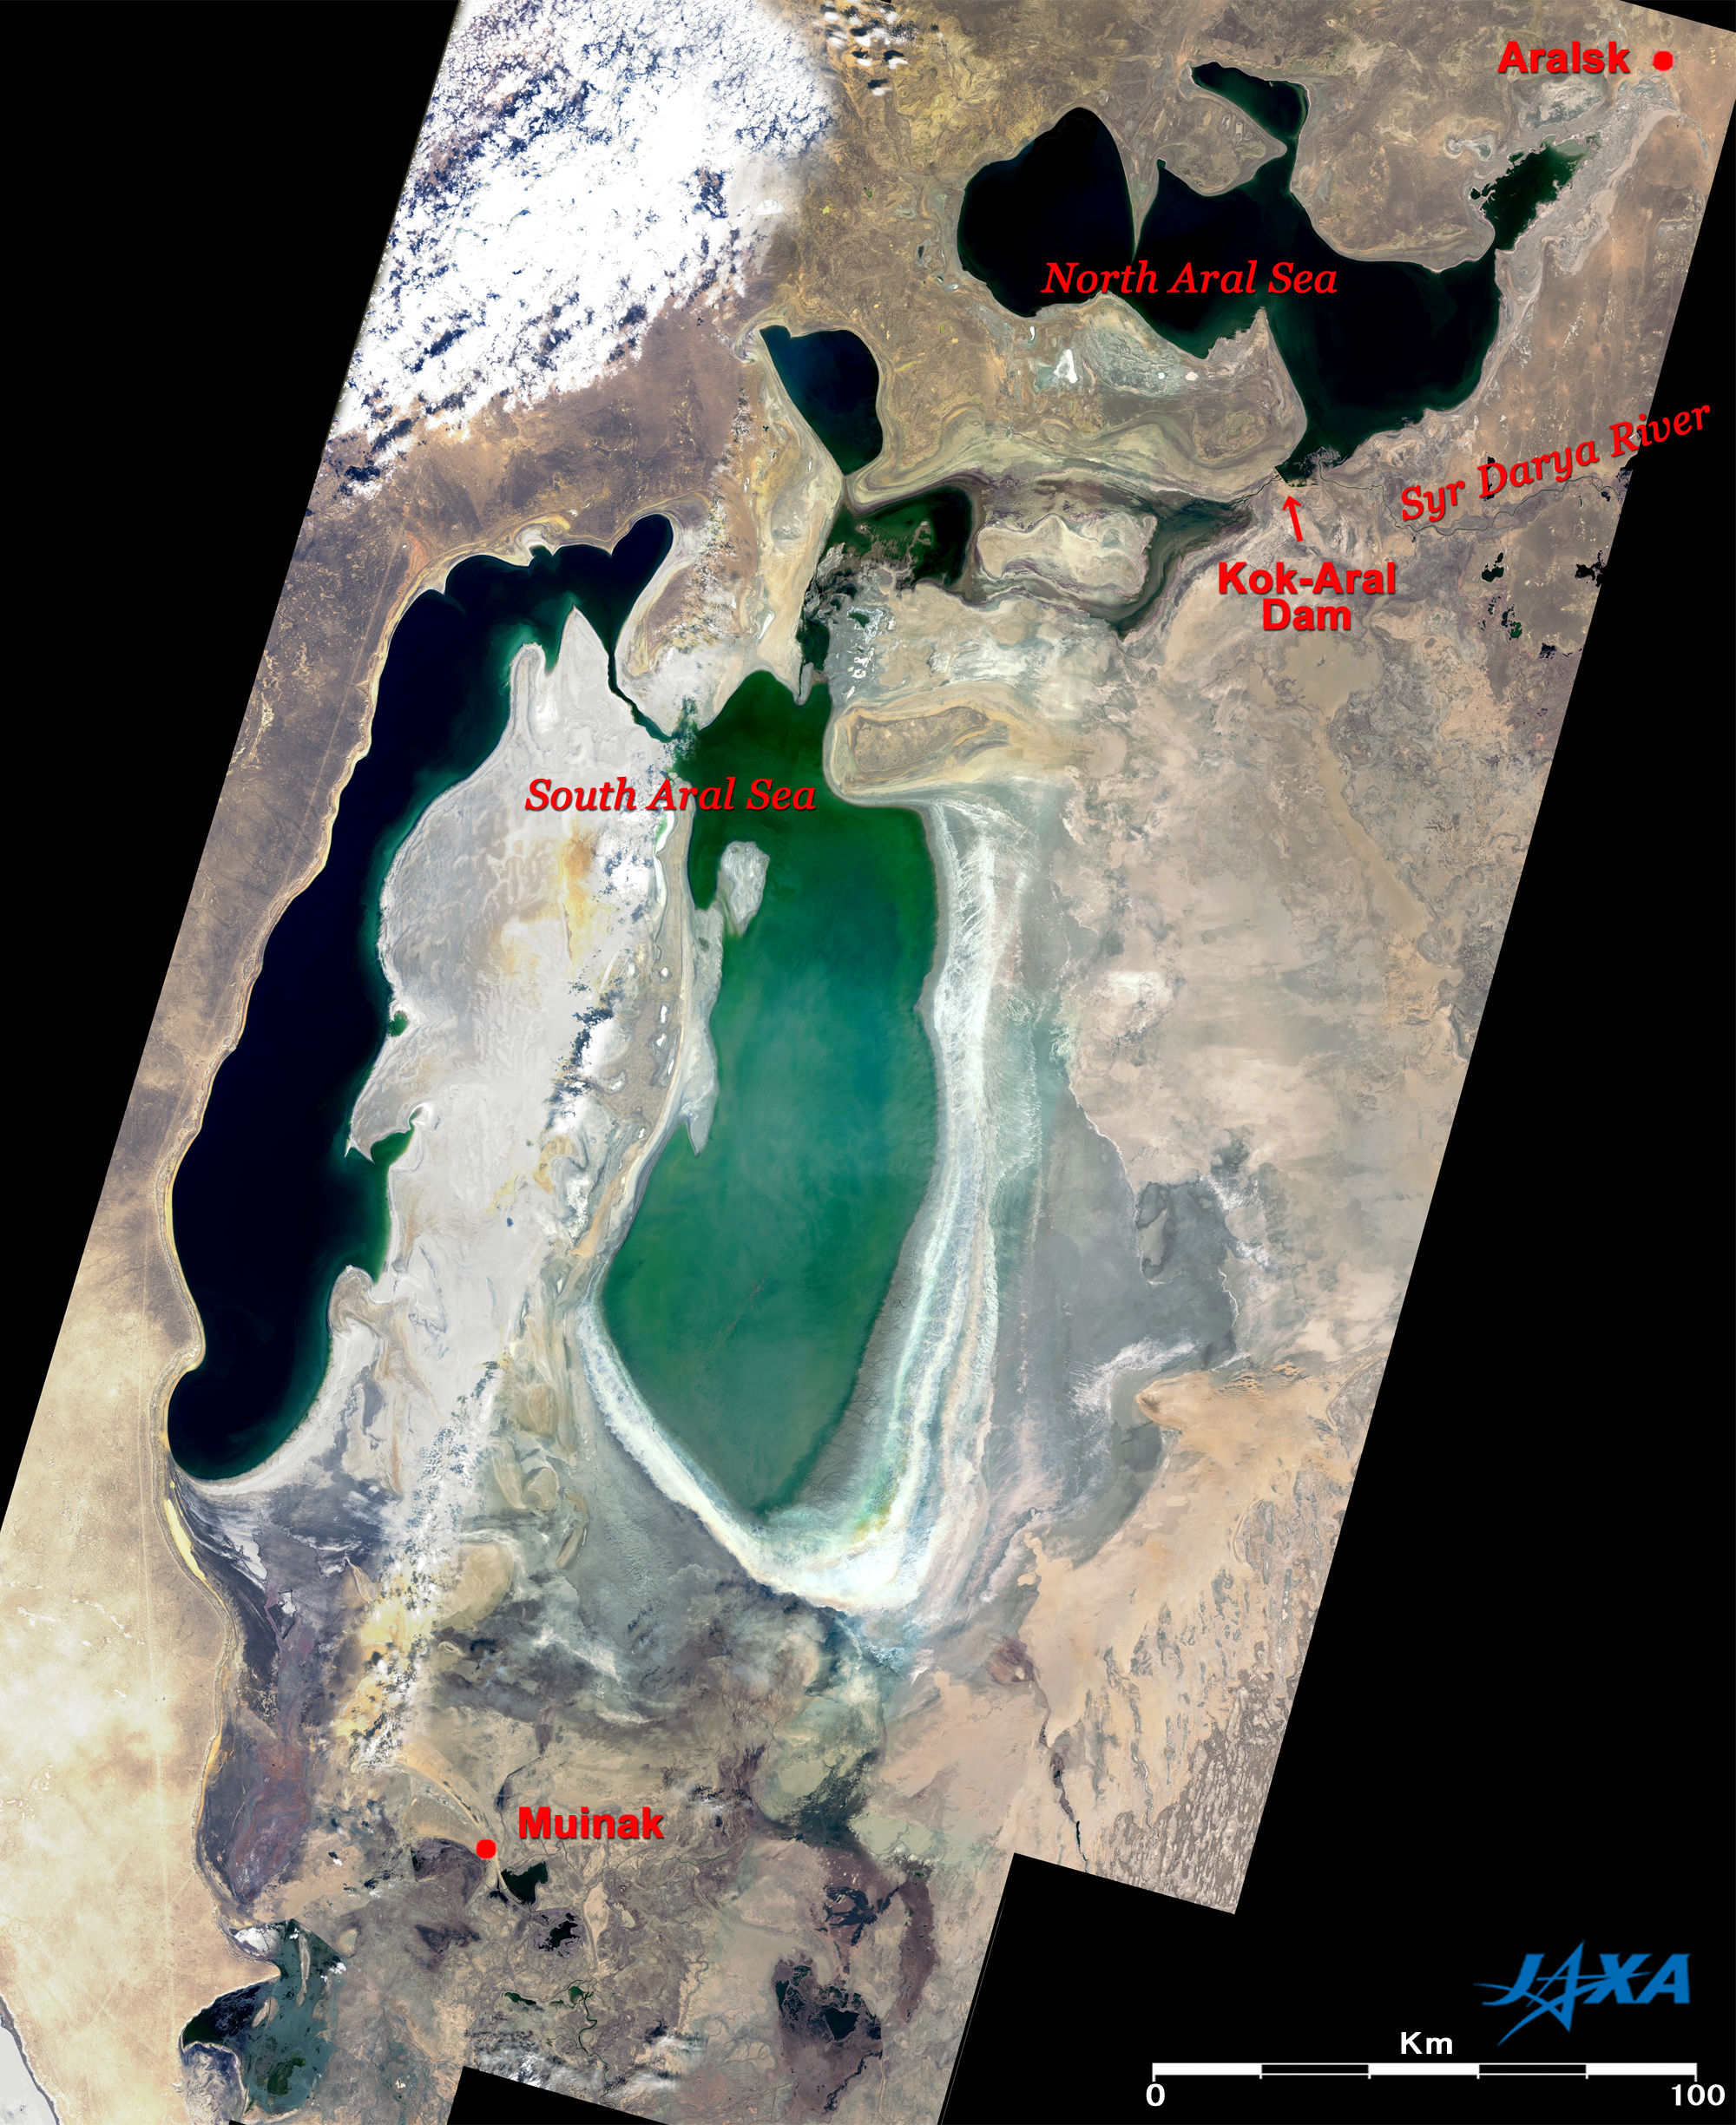
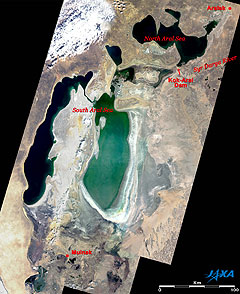
Fig. 2 Aral Sea in September 2006 to October 2007 |
|
Aral Sea (kmz, 3.14 MB, Low Resolution) as seen on Google Earth |
Figures 1 and 2 depict the Aral Sea in October 2003 and in September 2006 to October 2007. The Aral Sea has continued to shrink since the 1960s. If you compare Figs. 1 and 2, you will find that the South Aral Sea shrank after dividing into east and west areas, but the North Aral Sea expanded. Aral'sk (Aralsk), formerly a port town facing the Aral Sea, is in the top right corner of the figures, and Muynoq (Muinak), also a former port town, is in the lower left. The distance from Muinak to the nearest coastline was 50km in Fig. 1 but increased to 77km in Fig. 2. In contrast, the distance from Aralsk to the nearest coastline was 35km in Fig. 1 but decreased to 25km in Fig. 2.
The reduction of the South Aral Sea is remarkable, especially on the east side. In Fig. 2, the coastline retreated on a large scale, leaving a trace that can be seen as a striped pattern like tree rings. Additionally, the emerald-green sea surface suggests shallow water, so the rapid reduction is expected to continue in the future.
The expansion of the North Aral Sea indicates that the water level is recovering since the Kazakhstan government completed the partially concrete Kok-Aral Dam in August 2005, as a 86 million dollar project including financing from the World Bank. Since completing the dam, Kazakhstan has been able to keep the water in the North Aral Sea. They also increased the irrigation system efficiency by improving the agricultural water routes, and increased the quantity of the water pouring into the North Aral Sea from the Syr Dar'ya (Darya) River.
It was not so new concept that Kazakhstan would give up the South Aral Sea, which does not receive water from the Amu Darya River, and that they would rescue only the North Aral Sea, which still receives some water from the Syr Darya River, by constructing a dam. The Kazakhstan government, which has been controlling the northern half of the Aral Sea since the former USSR collapsed at the end of 1991, constructed an earthen dam in 1996, but it was destroyed by high waves due to a storm in 1999.
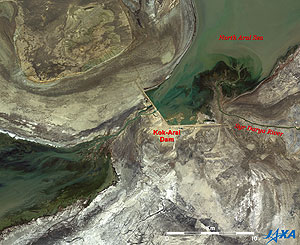 |
| Fig. 3 Expanded image around Kok-Aral Dam |
Figure 3 is an expanded image around the Kok-Aral Dam acquired in October 2006. The 13km-long Kok-Aral Dam forms a wide V-like character. The lock is the part where the dam looks to break off, and small, white splashes of drained water can be seen. The northeastern side of the dam is the North Aral Sea, and the mouth of the Syr Darya River is near.
This dam was designed to raise the water level of the North Aral Sea from 38m to 42m above sea level. The water level of the North Aral Sea is estimated to have reached very near the planned 42m because the inclination on the northeastern side of the dam is fairly gentle, *1 and the water in the North Aral Sea has approached the top of the dam.
News reports say that sometimes it rained in Aralsk, the climate became quiet, the frequency of sandstorms decreased, and the fish and wild fowl returned as the water level recovered. Reports also say that fishermen are returning to the city and are planning to stock millions of young fish and to re-introduce the sturgeon to revive fishery.
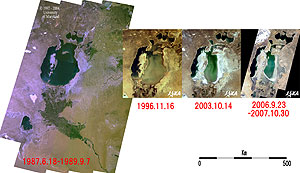 |
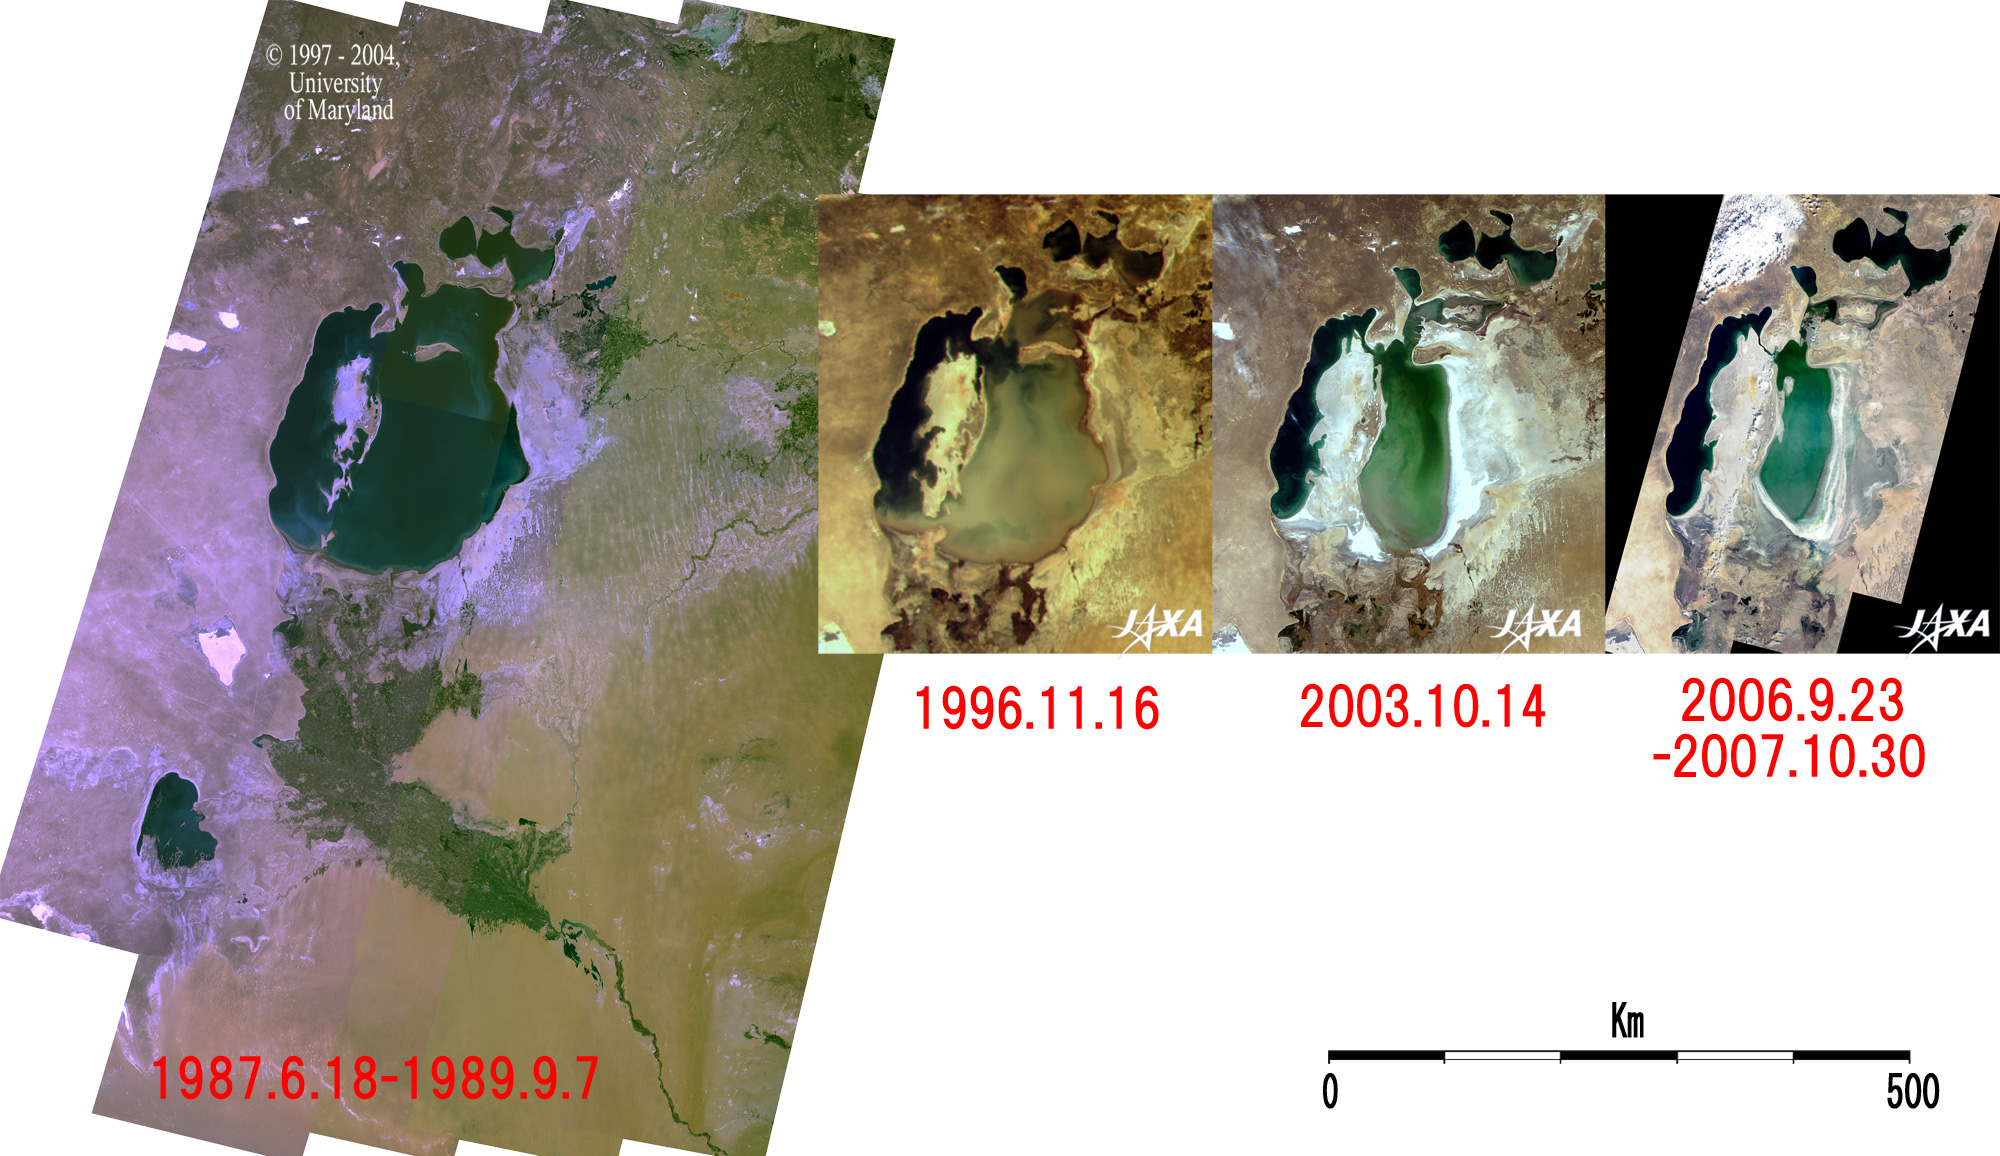
| Fig. 4 Transition of reduction of Aral Sea |
The Aral Sea spreads over portions of Kazakhstan and Uzbekistan in Central Asia and was the fourth largest lake in the world. However, its level began dropping in the 1960s as more and more irrigation water was extracted from the Syr Darya and Amu Darya Rivers that flow into the Aral Sea to grow cotton and cereal, with a subsequent reduction in surface area. Salt, sand, and agricultural chemicals stirred up from the parched bottom of the sea created a serious health hazard for the surrounding residents, and the increased salinity of the water remaining in the Aral Sea killed fish and ruined fisheries. The climate became harsher because the water mitigating the environment of this area disappeared and the growth season for cotton and cereal shortened.
As illustrated in Fig. 4, the Aral Sea separated into north and south areas in the second half of the 1980s. The South Aral Sea subsequently separated into east and west areas around the year 2000 and is continuing to shrink. However, the North Aral Sea has been recovering since the Kok-Aral Dam was completed in August 2005. Table 1 indicates the sea-surface areas measured based on Fig. 4.
| Table 1 Change of sea-surface areas of Aral Sea (unit: square km) |
| |
1960 |
June 1987 to September 1989 |
November 1996 |
October 2003 |
September 2006 to October 2007 |
| North Aral Sea |
- |
3,400 |
3,200 |
3,200 |
3,600 |
| South Aral Sea |
- |
42,100 |
31,300 |
17,700 |
13,000 |
| Total |
68,000*2 |
45,500 |
34,500 |
20,900 |
16,600 |
The first-stage project was to complete construction of the Kok-Aral Dam. The second-stage of the $126 million project is planned to be started in 2009. The project includes constructing a 20km-long second dam to further raise the water level of the North Aral Sea and constructing a canal that will have a water level of 46m above sea level, which is higher than the second dam, and will extend from the Syr Darya River, bringing water to the harbor in Aralsk again. The water level of the Aral Sea was 53.41m*2 in 1960.
The Amu Darya River disappears before it can pour into the South Aral Sea due to the extraction of water for irrigation. At present, millions of people depend on the cereal grown by the irrigation system supported by the river. Thus, restoring the South Aral Sea will probably be very difficult.
Reference Site:
*1 Site of Unimaps.com
Reference:
*2 Lake Biwa Research Institute, Lakes of the World (in Japanese), Jinbunshoin, 1993 |
Explanation of the Images:
Fig. 1 and the second image from right side of Fig. 4. Click images to enlarge.
These are composite images generated from GLI's three visible spectral channels, channel 22 (660nm; red), channel 21 (545nm; green), and channel 20 (460nm; blue). The images render colors similar to those as seen by the naked eye.
Figs. 2 and 3, and right side of Fig. 4. Click images to enlarge.
AVNIR-2 has four observation bands. These images were composed by assigning red to visible Band 3 (610 to 690nm), green to visible Band 2 (520 to 600nm), and blue to visible Band 1 (420 to 500nm). The resulting image has natural coloring as if seen by the naked eye. In these images, dried salt soil and clouds are white; water surfaces are emerald green or black; exposed rocks, soil and sand are brownish; and hay is dark brown. Areas with no data are black. Figure 2 and the right side of Fig. 4 were generated by mosaicking 44 images in cooperation with the Satellite Application Promotion Center (SAPC).
Left side of Fig. 4. Click figures to enlarge.
Here we used data downloaded free of charge from the Global Land Cover Facility (GLCF) Earth Science Data Interface site operated by the University of Maryland, USA. These figures were composed by assigning red to visible Band 3 (630 to 690nm), green to near infrared Band 4 (760 to 900nm), and blue to visible Band 2 (520 to 600nm). The resulting image has coloring similar to that seen by the naked eye and vegetation looks green. In these images, water surfaces are black, dried salt soil is white, forests are auburn, and dry soil and exposed rocks are ash purple or brown. The right side image of Fig. 4 was generated by mosaicking 27 images.
Second left image of Fig. 4. Click figures to enlarge.
This is a composite image generated from OCTS's three visible spectral channels, channel 5 (565nm; red), channel 4 (520nm; green), and channel 2 (443nm; blue). Although the image renders colors similar to those as seen by the naked eye, it looks a little yellowish compared to other images of Fig. 4 because of the difference between OCTS and other sensors. |
|