ページの先頭です。
本文へジャンプする。
【Important Notices】This page is an archive page of information published in the past. Since the update has been completed, it may contain broken links or outdated information. For the latest information, please use the new site Earth-graphy (earth.jaxa.jp).
ここからサイト内共通メニューです。
サイト内共通メニューを読み飛ばす。
サイト内共通メニューここまで。
ここから本文です。

Seen from Space 2007

The Coming of Sea-Ice Season 2007

 
Fig. 1 Sea-Ice Distribution in the Sea of Okhotsk on Feb. 14, 2007 (Daichi)
Sea-Ice (kmz,1.38MB,Low Resolution) is seen from Google Earth.
Figure 1 depicts the sea-ice distribution in the Sea of Okhotsk, as observed by the Phased-Array L-band Synthetic Aperture Radar (PALSAR) on board the Advanced Land Observing Satellite (ALOS) "Daichi" on February 14, 2007. The top half of Fig. 1 depicts the area south of Sakhalin, and the bottom half, the northern area of Hokkaido.
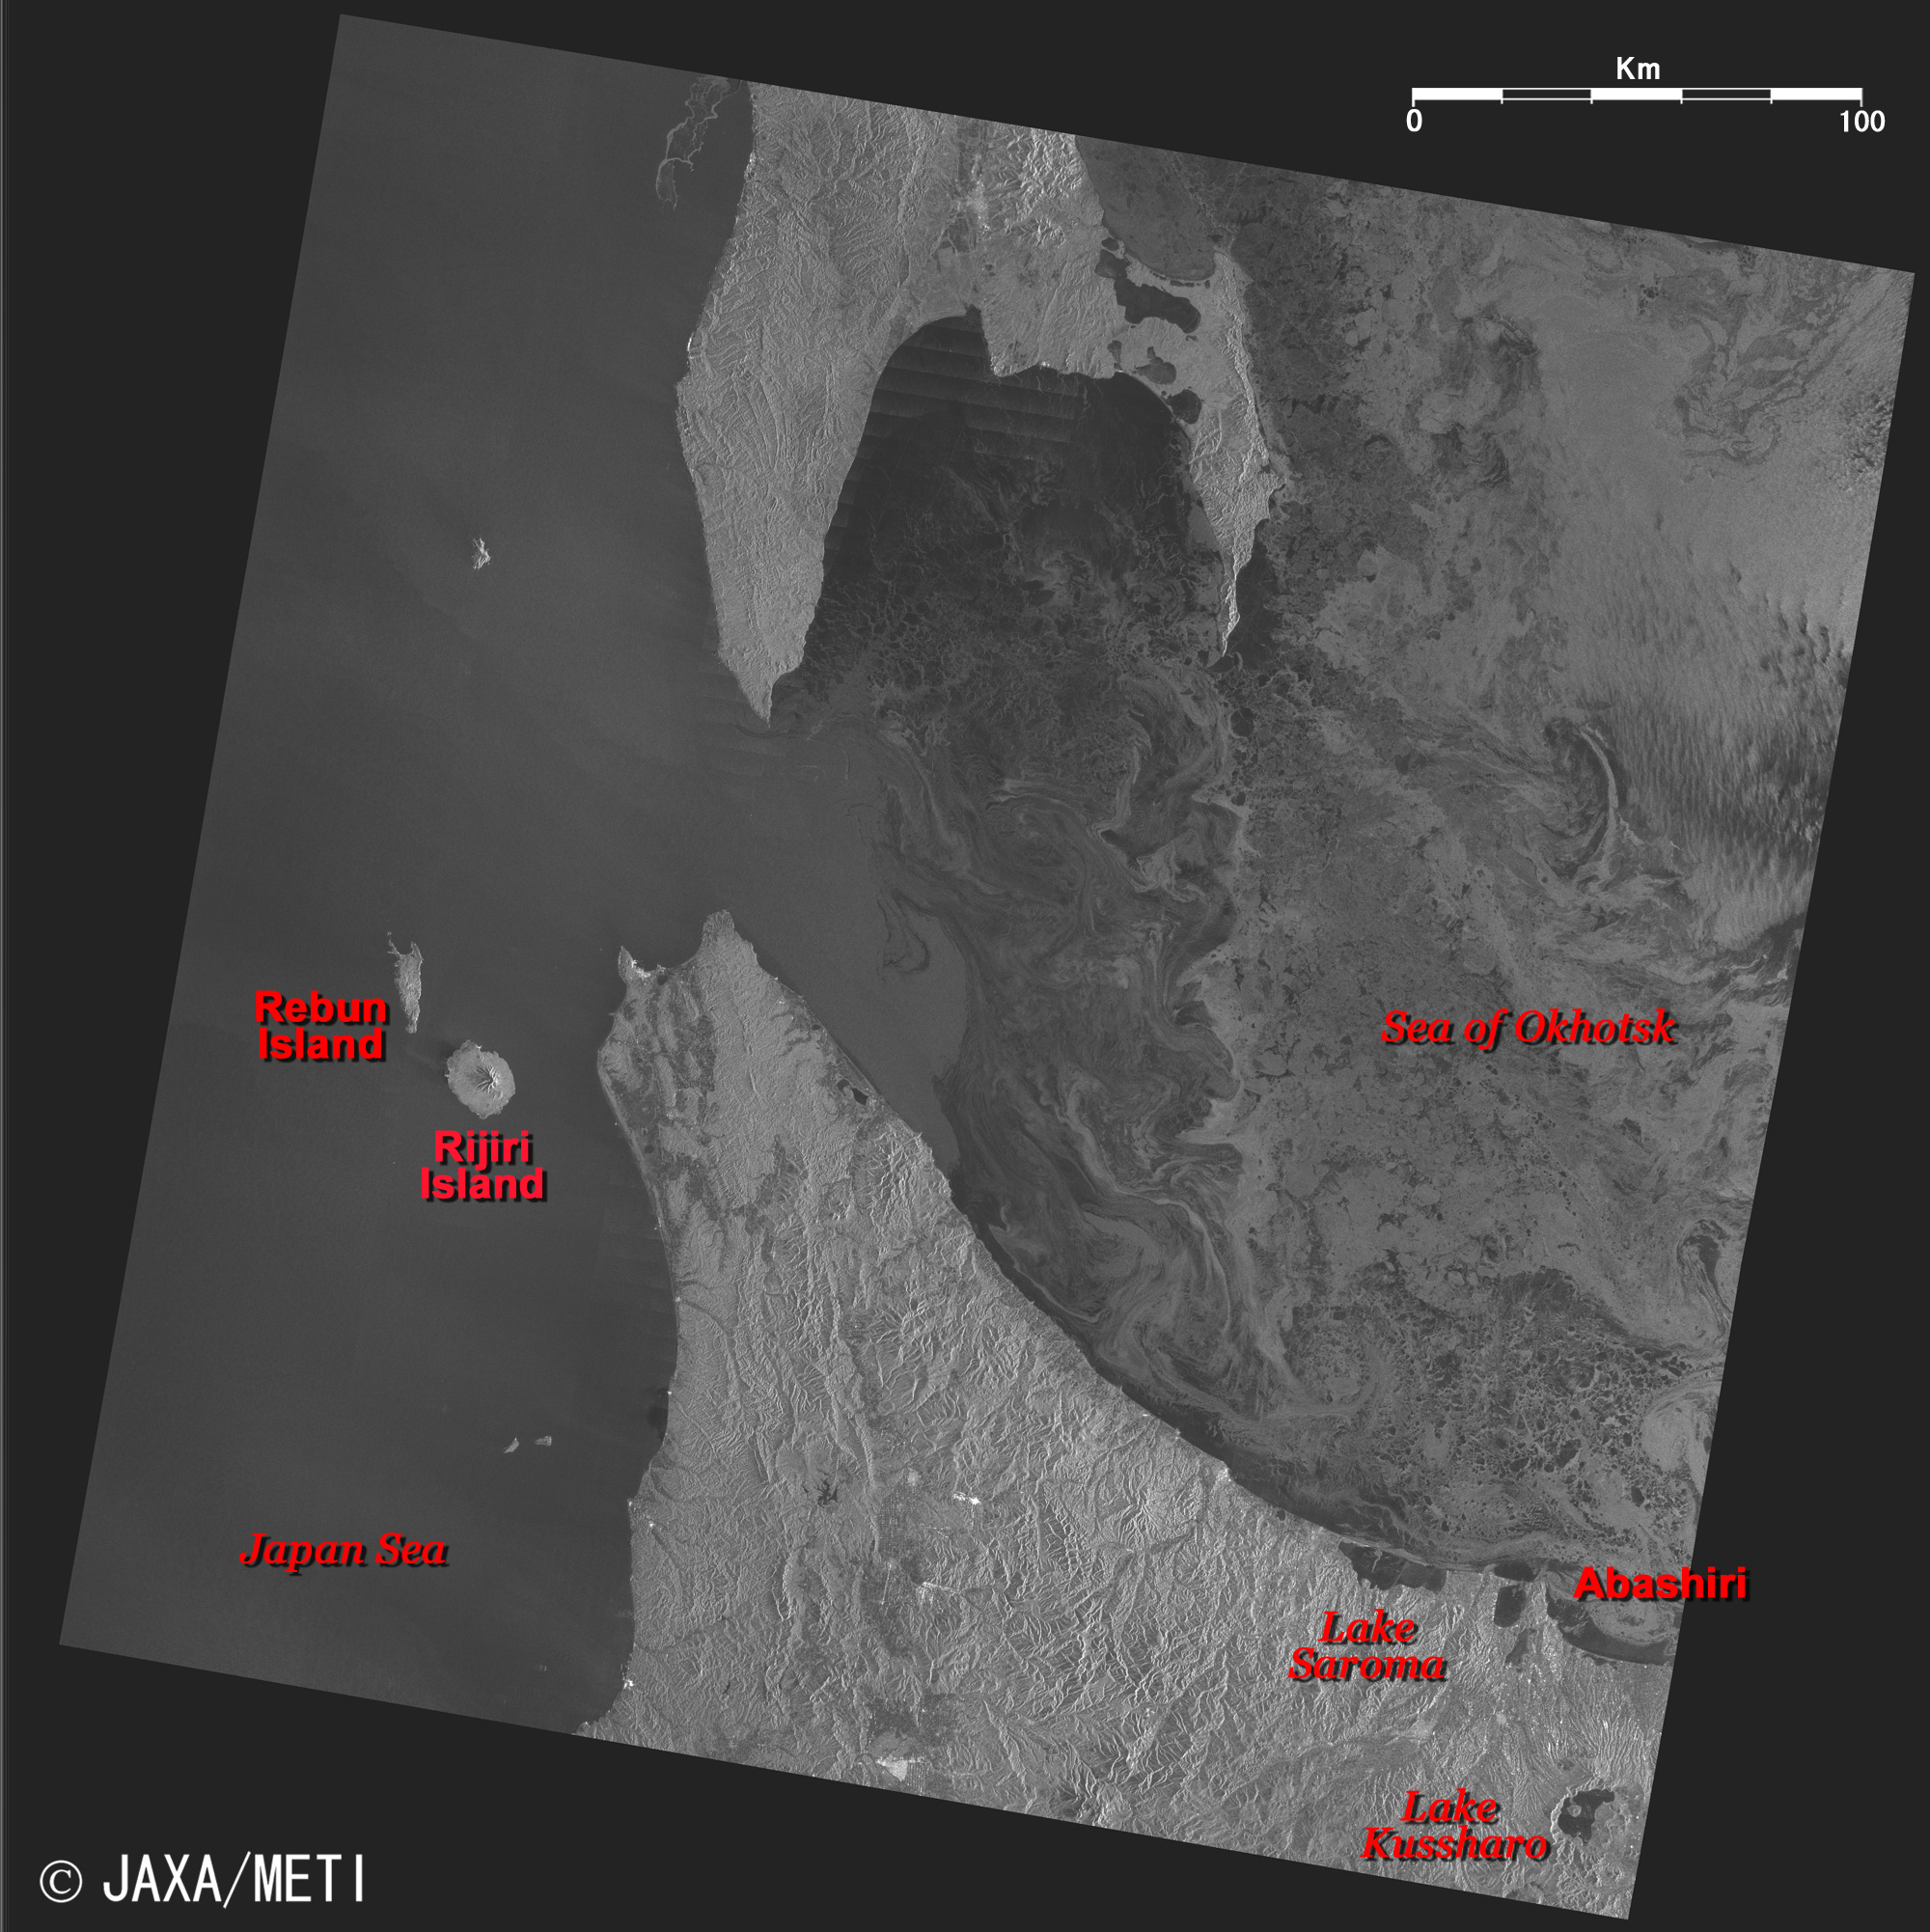
The sea ice is approaching the coast of Hokkaido in the Sea of Okhotsk, but a narrow waterway still exists along the coast and you can see that the sea ice has not reached the coast.

The First Regional Coast Guard Headquarters of the Japan Coast Guard announced that there is less sea ice near the coast of Hokkaido than usual. The Ice Information Center of the First Regional Coast Guard Headquarters of the Japan Coast Guard updates the status of sea ice in the Sea of Okhotsk. In addition, the observation data of PALSAR on Daichi will be used practically once a week from this year.

PALSAR is a phased-array synthetic-aperture radar using L-band microwave signals to achieve cloud-free and day-and-night sea-ice observation.
The Japan Meteorological Agency web site announced that the first sea ice of the season was observed on January 1, two days later than usual and that the first arrival of sea ice in the season was observed on February 16, 15 days later than usual in Abashiri-city. In Monbetsu city, according to the web site, the first sea ice was observed on January 26, four days later than usual, but the arrival of sea ice was not observed yet.

Very little snow fell in the Japan Sea side of Japan this winter, and we experienced the spring-heralding gales in Tokyo before the first snowfall for the first time in Japanese climate monitoring history. Global warming in winter effects not only Japan but all countries worldwide. Global warming may also influence sea-ice trends in the Sea of Okhotsk.


Fig. 2 Sea-Ice Distribution in the Sea of Okhotsk on February 19, 2007 (Left, AMSR-E; Right, MODIS)
Animation (QuickTime 500KB)
Figure 2 depicts the Sea of Okhotsk as observed by AMSR-E and MODIS.
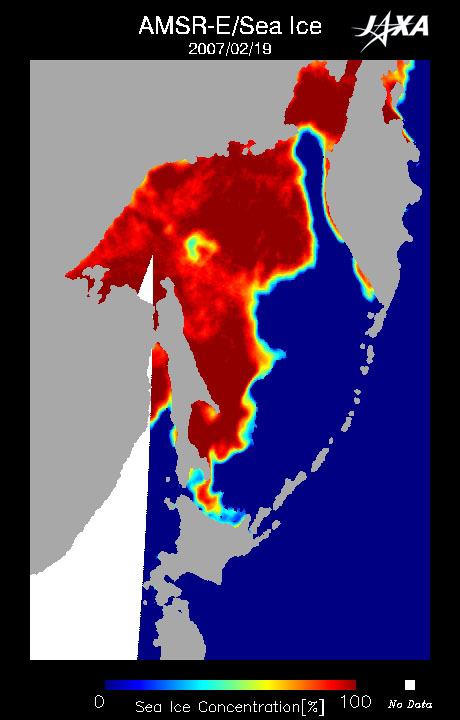
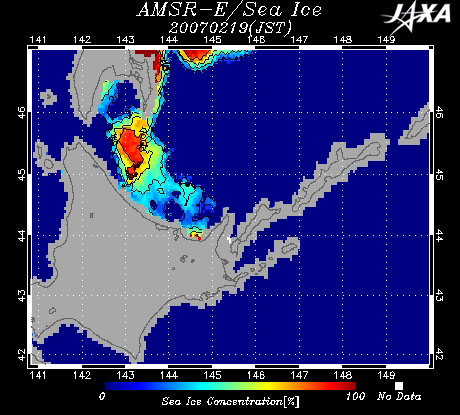
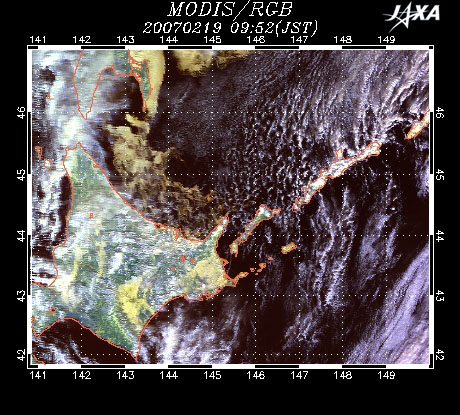
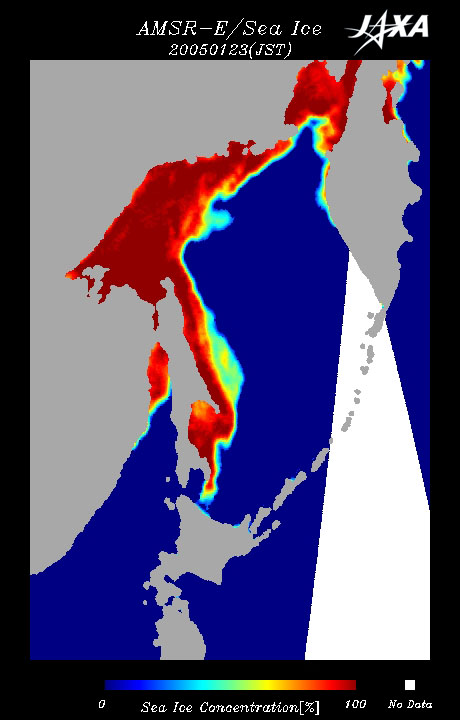
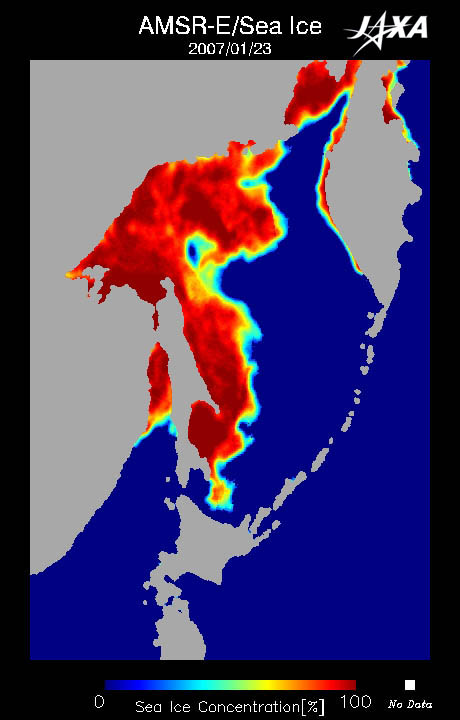
In the AMSR-E image, the left side of Fig. 2, the red sea ice extends from off the eastern coast of Sakhalin to the south.
To discriminate between sea ice and other features, sea ice is highlighted in red or orange. Greater sea ice concentrations are indicated by deeper shades of red.
The MODIS image, the right side of Fig. 2, depicts yellow sea ice under white or bluish-gray clouds.

The sea ice, which was formed off the Siberian coast northwest of the Sea of Okhotsk, 1,000 to 1,500km north of Hokkaido, flows to the south and is carried toward the coast of Hokkaido by the ocean current flowing off the eastern coast of Sakhalin.

Fig. 3 January 23, 2004 Fig. 4 January 23, 2005 Fig. 5 January 23, 2006 Fig. 6 January 23, 2007
Sea-Ice Distribution in the Sea of Okhotsk (Aqua/AMSR-E)
Figures 3 to 6 indicate the sea-ice area in the whole Sea of Okhotsk on January 23 of every year since 2004.

The Sea of Okhotsk is the lowest frozen sea in latitude of all the seas in the world. The increase and decrease of the sea-ice extent is closely related to the climate, and this affects the catches of fish around the Islands of Japan. Therefore, it is very important to monitor the growth of the sea ice over the Sea of Okhotsk to determine the status and future condition of the global environment.

The latest information on the sea ice extending to the Sea of Okhotsk is released on EORC's homepage "Sea-Ice Distribution in the Sea of Okhotsk," which has been updated daily since December 2003. It includes images of sea ice extending over the Sea of Okhotsk and the detailed distribution of sea ice approaching the coast of Hokkaido.
You can also view changes in the sea-ice distribution by using the slide-show function.


References:
Ice Information Center of First Regional Coast Guard Headquarters of Japan Coast Guard
Japan Meteorology Agency (Japanese only)

Explanation of the images:
Fig. 1
Satellite: Advanced Land-Observing Satellite (ALOS) (Daichi)
Sensor: Phased Array L-band Synthetic Aperture Radar (PALSAR)
Date: 0110 (JST) on February 14, 2007
Ground resolution: 100 m
Map Projection: Universal Transversal Mercator (UTM)
PALSAR is a phased-array synthetic-aperture radar using L-band microwave signals to achieve cloud-free and day-and-night observation. PALSAR has a variable field of view angle and ScanSAR observation mode with a wide swath.

Fig. 2 right
Satellite: EOS- Terra (NASA)
Sensor: MODIS (NASA)
Date: February 14, 2007
The color composition was made by using 3 of 36 MODIS channels: channel 4 (545 to 565 nm in the green band) for red, channel 2 (841 to 876 nm in the near infrared band) for green, and channel 5 (1230 to 1250 nm in the shortwave length infrared band) for blue. As a result, you can distinguish the light orange sea ice from the white clouds. The resolution of the original figure is 500 m.

Fig. 2 left, Figs. 3 to 6, and animation
Satellite: EOS-Aqua (NASA)
Sensor: Advanced Microwave Scanning Radiometer for EOS (AMSR-E) (JAXA)
Date: February 19, 2007 (Fig. 2 left)
January 23, 2004 (Fig. 3)
January 23, 2005 (Fig. 4)
January 23, 2006 (Fig. 5)
January 23, 2007 (Fig. 6)
December 1, 2006 to February 18, 2007 (Animation)
These figures present the sea-ice concentration calculated based on the algorithm developed by Dr. Josefino C. Comiso from NASA GSFC, one of the Principal Investigators (PIs) for AMSR/AMSR-E algorithm development, by using 36.5GHz horizontal and vertical polarization data and 18.7GHz horizontal and vertical polarization data from the six observational frequencies of AMSR-E. The above images indicate the sea-ice concentration estimated from the data acquired by AMSR-E. Sea-ice concentration is the ratio of ice cover per unit area. Zero percent indicates open water, and 100% indicates total sea-ice coverage. Areas with a low sea-ice concentration are light blue and change to yellow and orange for higher concentrations, with the highest sea-ice concentration displayed as red or deep vermilion. The land is gray, the open water surface (sea surface) is deep blue, and areas with no data are white. The spatial resolution is approximately 15km.

Related Sites:
Sea Ice, Hokkaido and Vicinity Observed with PALSAR ScanSAR Mode
The Coming of Sea Ice Season 2006
Natural Features in Winter: The Arrival of Sea Ice in Hokkaido
Coming of Pack Ice Season
Cryosphere, Seen from Space
本文ここまで。
image:Satellite Navigator
image:Satellite Applications and Operations Center(SAOC)
Earth Data Collection by JAXA Satellites
image:ページTOP