| |
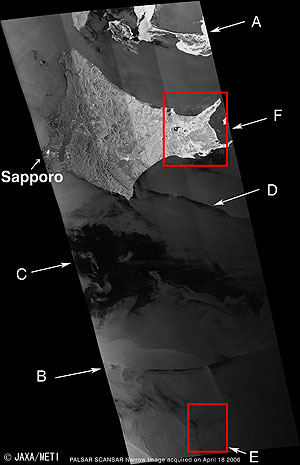 |
Fig. 1. Sea Ice, Hokkaido and Vicinity observed with PALSAR ScanSAR Mode
Hokkaido (kmz, 1.88 MB, Low Resolution) as seen on Google Earth. |
Figure 1 depicts the 350 km-wide and 1,000 km-long area containing Hokkaido as observed in ScanSAR*1 mode1 by the Phased-Array L-band Synthetic-Aperture Radar (PALSAR) aboard the Advanced Land-Observation Satellite (ALOS) "Daichi" from an ascending orbit around 10 o'clock at night on April 18, 2006. Most of Hokkaido is included at the top of Fig. 1, and the bright city area of Sapporo can be seen in the upper left. The bottom of the figure is the Pacific Ocean from offshore Sanriku to offshore Ibaraki.
We confirmed that it is possible to observe details of the sea surface and sea ice in the seas close to Japan day or night regardless of weather conditions with PALSAR's ScanSAR mode with a high SN ratio after a detailed study of Fig. 1.
·Sea ice (Area A)
Along the Sea of Okhotsk coastline in Hokkaido, sea ice flows annually from December to the following April. Inside and below the sea ice, the phytoplankton grows in large quantities. This plays an important role in the formation of good fishing grounds, but the sea ice creates problems for safe ship navigation. Because of this, the Japan Coast Guard observes sea ice by using aircraft and satellite images.
The surface of sea ice is rough and appears slightly brighter when seen by synthetic-aperture radar (SAR). You can discern sea ice comparatively easily in an SAR image because sea ice is brighter than the sea surface, which returns only weak radio signals to the satellite. Specifically, the sea ice looks brighter with the L-band SAR compared with the other wavelength SAR. In this image taken on April 18, you can confirm that the sea ice on the Hokkaido coast has generally disappeared, and there is sea ice drifting off Sakhalin's Cape Aniva.
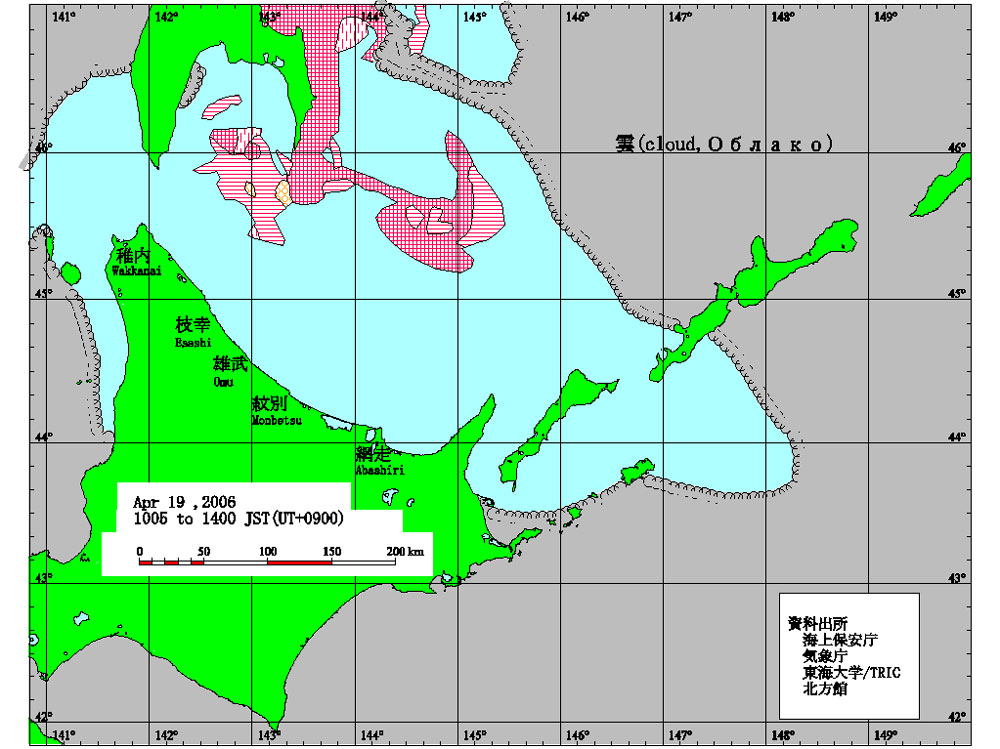
Fig. 2 is the sea-ice distribution chart issued on the following day by the Japan Coast Guard. Comparing the two figures, you can find that the distributions of sea ice coincide, and that the resolution of the SAR image is high. It thus seems possible to determine the sea-ice distribution at a more detailed level by using the PALSAR Sca SAR mode.
·High sea-surface temperature area and low sea-surface temperature area (Areas B and C )
Let us now look at the sea south of Hokkaido. The incident angle of the PALSAR radio signals increases from the left of the image to the right (18° in the left end, and 43° at the right end). It is reasonable that it becomes darker as it moves to the right because the reflection coefficient of the sea surface decreases gradually. However, area B looks white and area C looks black, though both areas are at the left end.
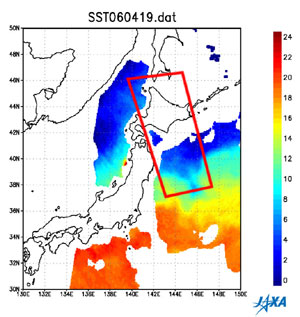 |
| Fig. 3. Sea-surface temperature off Sanriku by AMSR-E on April 19, 2006 |
Figure 3 presents the sea-surface temperature determined by AMSR-E on the following day. You can see that the sea-surface temperature in area B was high, and that it was low in area C. If the sea-surface temperature is higher than the air temperature, the surface area increases in order to maximize the heat movement from the sea surface, and the sea surface becomes rough. As a result, the sea surface looks white because the reflection coefficient is larger.
In contrast, if the sea-surface temperature is low and the same as the air temperature, there is no energy transfer between the sea surface and the atmosphere and the sea surface becomes smooth. The reflection coefficient then becomes low and it looks darker as a result. PALSAR is suitable for observing the sea surface because the SN (Signal to Noise) ratio is higher than conventional SARs.
·The front (Area D)
In this area, you can clearly find some boundaries. Considering the factors that made such a boundary, you can attribute it to the differences in the distribution of the waves and the differences of the sea-surface temperatures, but we have not yet discovered any relationship.
·The ships (Area E)
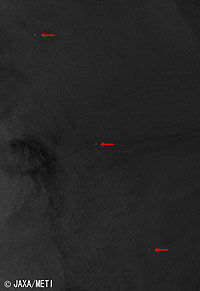 |
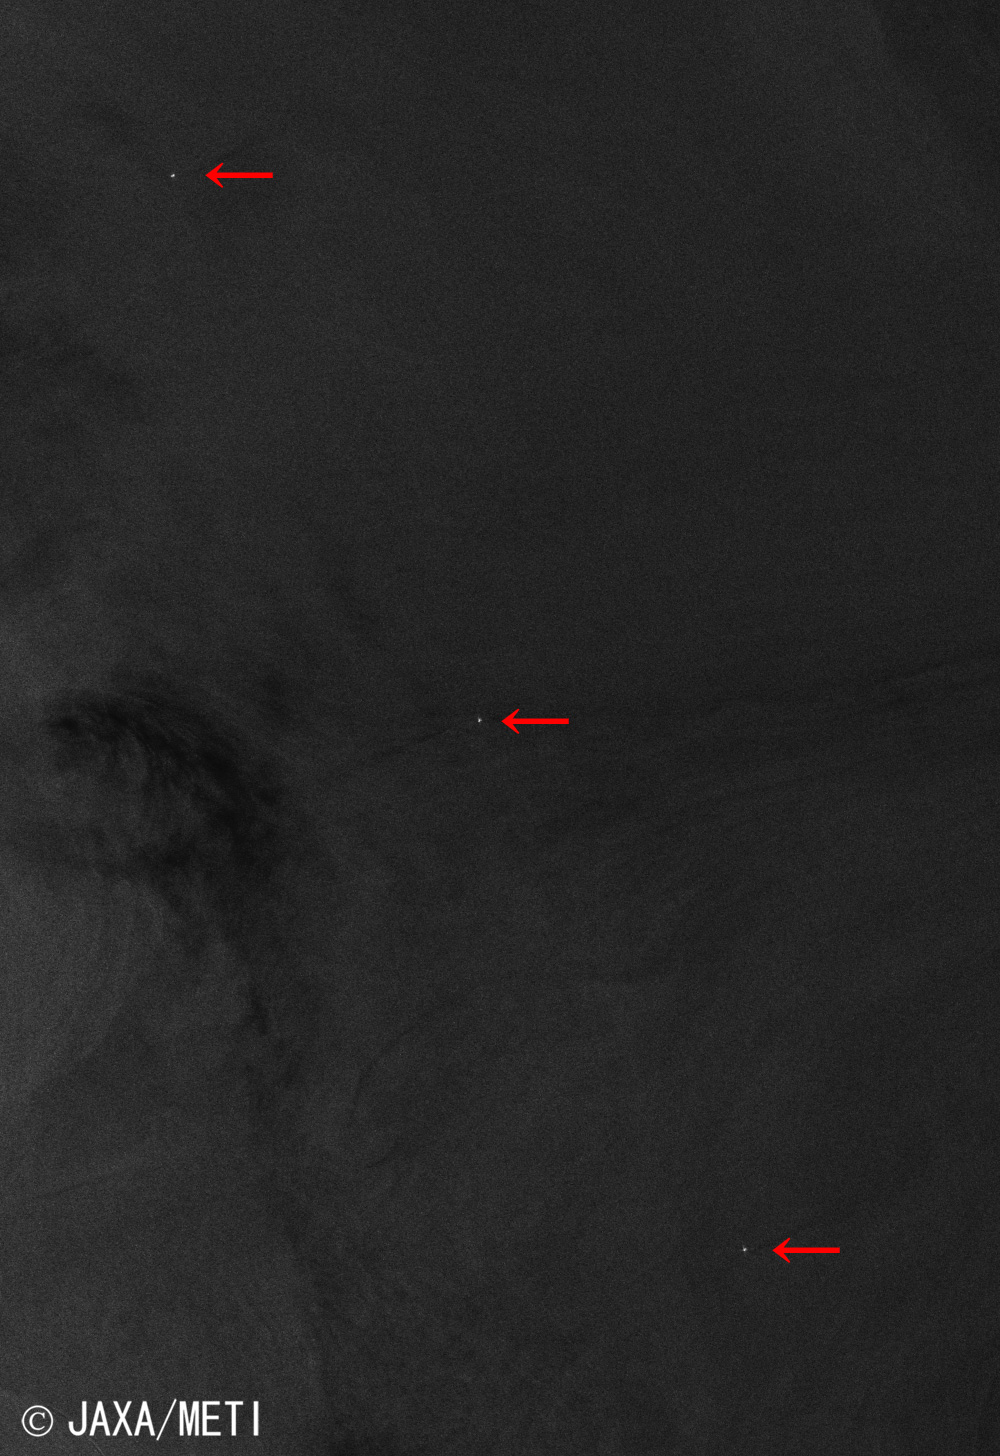
| Fig. 4. Ships observed by PALSAR |
Looking now at the southern end, Fig. 4 is an expanded image of Area E.
The three white points on the sea surface are ships. They must be quite large ships because the image resolution is 70 m. The waves created by the ships are not seen at the resolution level of this image, nor can their direction of movement be confirmed. However, monitoring ships by satellite is important in maintaining the safety of marine traffic.
·The land (Area F)
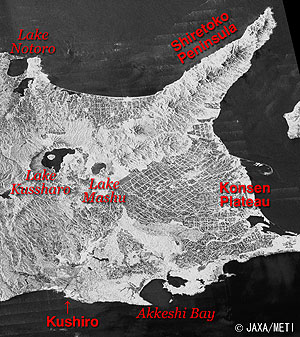 |
| Fig. 5. Eastern Hokkaido |
Finally, let's look at an image of eastern Hokkaido. Figure 5, an expanded image of Area F, depicts detailed characteristics of the land. The lattice-shaped structure on the Konsen Plateau is the wind-break forest, which is a characteristic of this district. Lake Kussharo and Lake Notoro appear dark, indicating that the ice has melted. However, Lake Mashu looks gray, indicating that there is still some ice remaining.
|
*1ScanSAR is an observation mode of PALSAR. In this mode, PALSAR expands the observation area, compared to the conventional SAR, by instantly changing the direction of the transmitted radio signals. The standard observation width of PALSAR is 70 km, but in this mode, ScanSAR can observe a 350-km-wide area which is quintuple that of standard mode. Deviating the beam decreases the amount of energy to a specific area, and the signal quality falls (SN ratio degrades), but this mode can remove the limitation on the observation width. The resolution of the range direction (the cross direction to satellite direction) is 20 m as same as in the standard mode, but the resolution of the azimuth direction (the direction parallel to the satellite direction) is degraded to 70 m. This mode is very effective for certain observations, especially for environmental monitoring, because the observation width becomes so much wider. Incidentally, Fig. 1 was produced by projection onto an equilateral coordinate system with 100-m units.
|
Explanation of the images:
Figs. 1, 4 and 5
| Satellite: |
Advanced Land-Observing Satellite (ALOS) (Daichi) |
| Sensor: |
Phased-Array L-band Synthetic-Aperture Radar (PALSAR) |
| Date: |
2140 (JST) on April 18, 2006 |
| Frequency: |
1,270 MHz (L band) |
Ground resolution
(ScanSAR mode): |
20 m (cross-track direction) x 70 m (along-track direction) |
| Map Projection: |
Equilateral |
|
The PALSAR is an upgraded Synthetic-Aperture Radar (SAR) with improved functions and performance on board the Japan Earth-Resources Satellite-1 (JERS-1). It is an active microwave sensor that can carry out observations day or night regardless of weather conditions. PALSAR is able to change its observation direction and observation mode to cover a wider range (Scan SAR.) This radar was developed in cooperation with the Japan Resources-Observation System Organization (JAROS) of the Ministry of Economy, Trade and Industry (METI.)
|
Fig. 3
|
 |
|