| |
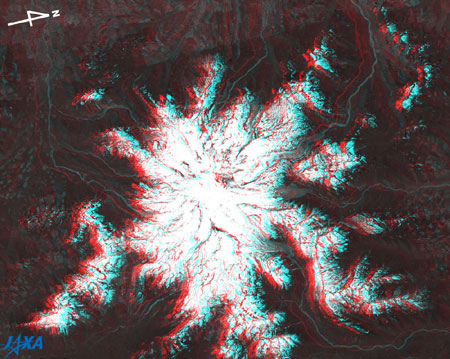 |
Fig. 1. Three-Dimensional View of Mt. Rainier
(Staring at the image for a long time may cause eyestrain. A colored print is available in pdf format. Pdf files for the left and right eyes are also available.) |
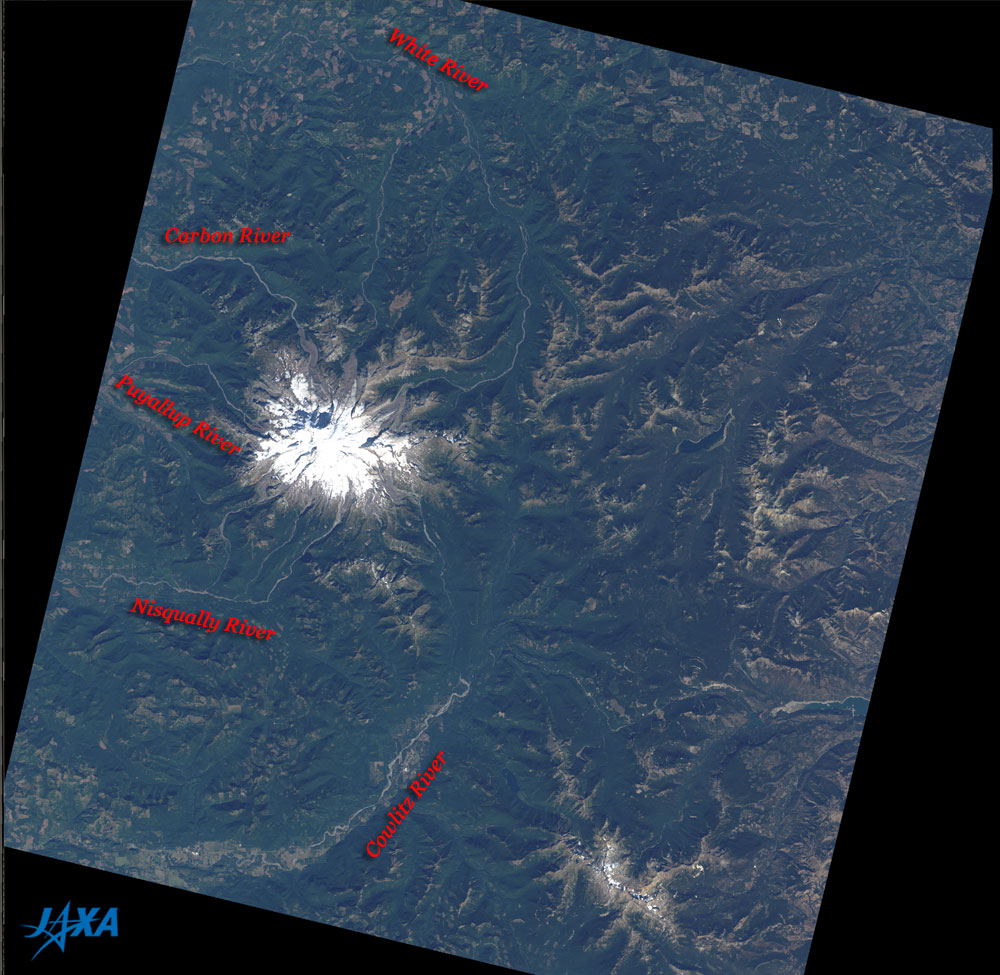
Figure 1 depicts Mt. Rainier, Washington, U.S.A., as observed by the Panchromatic Remote-sensing Instrument for Stereo Mapping (PRISM) on board the Advanced Land Observing Satellite (ALOS) "Daichi" in June 2006. When viewing Fig. 1 with red and blue glasses,*1 you can see distinctly that Mt. Rainier is an independent peak. The steep ridges extend on all sides like the legs of a starfish, and the glaciers that extend on all sides from the summit flow through the deep valleys, descending into rivers.
Mt. Rainier (4,392m above sea level), the highest peak in the Cascade Range, is a stratovolcano. It is located 87km southeast of Seattle and has a beautiful shape, much like Mt. Fuji in Japan. The Cascade Range is the cordillera that lies from north to south along the western coast of the North American continent. Mount St. Helens, which erupted spectacularly in 1980, also belongs to this cordillera. Mt. Rainier and its vicinity were designated as Mt. Rainier National Park in 1899, the fifth National Park in the U.S.A.
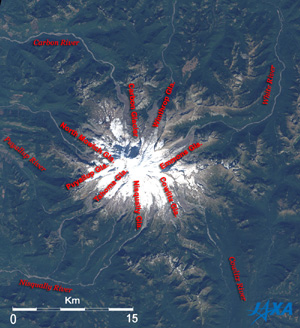 |
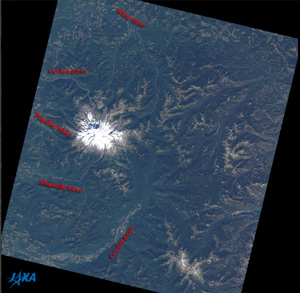
Fig. 2. Vicinity of Mt. Rainier
Mt. Rainier (kmz, 1.58MB, Low Resolution) as seen on Google Earth.
|
Figure 2 depicts the vicinity of Mt. Rainier as observed by the Advanced Visible and Near Infrared Radiometer-2 (AVNIR-2) on board the Advanced Land Observing Satellite (ALOS) "Daichi" in September 2006.
There are 26 major glaciers including the Summit of Mt. Rainier, and numerous, unnamed snow and ice fields. Among them, Emmons Glacier has the largest area (11.1km2.) and Carbon Glacier has the lowest terminus altitude (1,100m) in the lower 48 states of the U.S.A.*2 Reports show that the terminus of the Nisqually Glacier retreated 1.5km from 1912 to 2001.*3
According to the homepage of the National Park Service, U.S. Department of the Interior, the total area of these glaciers is 90km2 and accounts for approximately 10 percent of the area of the Mt. Rainier National Park. Their total volume is estimated to be 4.2km3.
The damp air from the Pacific Ocean collides with Mt. Rainier causing great winter snowfall, and thereby enabling formation and maintenance of glaciers on this scale and at such low altitudes in the middle-latitude zone.
 |
| Fig. 3. Wide-angle picture around Mt. Rainier |
The Carbon, Puyallup, Nisqually, and Cowlitz Glaciers each connect with a river with a corresponding name. Winthrop Glacier and Emmons Glacier connect with the White River. Rivers that at first begin to flow to the east eventually change direction to the west. All rivers that originate in Mt. Rainier eventually flow to the west.
Outside the area of the figure, the White River and Carbon River join the Puyallup River and flow into Puget Sound north of Tacoma. The Nisqually River pours into Puget Sound south of Tacoma. The Cowlitz River joins the Columbia River and flows into the Pacific Ocean.
Explanation of the Images:
(Fig. 1)
| Satellite: |
Advanced Land-Observing Satellite (ALOS) (Daichi) |
| Sensor: |
Panchromatic Remote-sensing Instrument for Stereo Mapping (PRISM) |
| Date: |
1909 (UTC) on June 24, 2006 |
| Ground resolution |
2.5 m |
| Map Projection: |
Universal Transversal Mercator (UTM) |
|
Fig. 1 was composed of nadir (red) and forward-looking (green and blue) images. Therefore the three-dimensional view looks natural when viewed from just the right side. The left side is the satellite flight direction because the nadir image of the satellite is seen with the left eye and the forward-looking image with the right eye. The left side nearly corresponds to south. Note that the right side is north in Fig. 1 even though the top is north in Figs. 2 and 3. |
( Figs. 2 and 3 )
| Satellite: |
Advanced Land-Observing Satellite (ALOS) (Daichi) |
| Sensor: |
Advanced Visible Near-Infrared Radiometer type-2 (AVNIR-2) |
| Date: |
1910(UTC) on September 24, 2006 |
| Ground resolution |
10 m |
| Map Projection: |
Universal Transversal Mercator (UTM) |
| AVNIR-2 has four observation bands. Figs. 2 and 3 were composed by assigning red to Band 3 (610 to 690nm), green to Band 2 (520 to 600nm), and blue to Band 1 (420 to 500nm). The resulting images have natural coloring as if seen by the naked eye. In these images, snow and ice are white, exposed rocks, soils and sands are brownish, farmland and grassland are light green, and forests are dark green. Areas with no data are black. |
|
 |
|