Seen from Space 2004
ALASKA, The Last Frontier, Observed by Radar
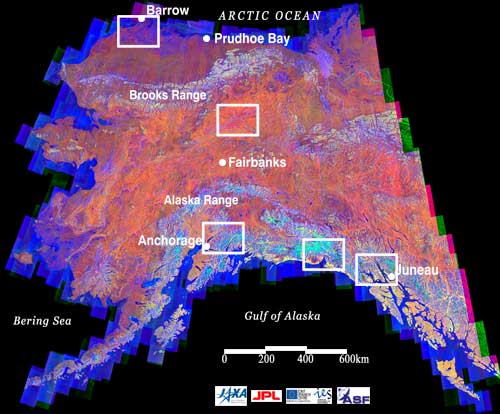
Figure 1 presents a mosaic image of Alaska in the United States acquired by Synthetic Aperture Radar (SAR) on Japanese Earth Resources Satellite -1 (JERS-1) (*1). To view pictures (A) through (E) point the cursor to boxed areas. (A) Northernmost town of North America, Barrow (*2). (B) The Yukon River and Fort Yukon passing Alaska from east to west. (C) Alaska's largest city, Anchorage, and the Columbia Glacier flowing to Prince William Sound. (D) Yakutat and Malaspina Glacier, Alaska's biggest glacier. (E) Capital Juneau and the Glacier Bay National Park, which has been designated a World Heritage Site. Figure 1 was obtained by overlaying the 1997 summer season image and the 1997 and 1998 winter season image. The different colors represent the different conditions of the land surface. For example, in image (A), areas of water like ponds and lakes, which freeze in winter and melt in summer, appear as blue spots. In image (B), the difference in vegetation appears red or yellow. In the images of the glacier areas (C), (D), and (E), thick snow during winter is light blue and melting snow during summer is red. Looking again at Fig. 1, we can see that the areas represented in light blue are concentrated in the mountain area along the south coast of Alaska. Due to large amounts of snowfall, this area is influenced by the Alaska Current running in a counterclockwise direction to the south coast of Alaska. This image was processed within the framework of the Global Boreal Forest Mapping Program (GBFM), one of the Global Forest Mapping Programs (GFMP) (*4), the same as the SAR image of Southeast Asia that was introduced on the previous page (*3). Monitoring frigid forests and the permafrost zone plays a very important role in understanding global climate changes, global water cycles, and global carbon cycles. The data from the SAR, which is capable of observing extensive areas with high resolution, is most effective for clarifying their cycles. The Advanced Land Observing Satellite (ALOS) is Japan's next Earth Observation satellite and is scheduled for launch soon. ALOS is equipped with two optical sensors and an improved L-band SAR instrument, called PALSAR. As a continuation of JAXA's on-going JERS-1 SAR GFMP into the era of ALOS, JAXA EORC has initiated the "Kyoto & Carbon Initiative." In an effort to support international environmental conventions and climate change science, this international collaborative project uses ALOS to map and monitor the status and changes in forest, wetlands, and land cover over the entire Earth.
(*1) SAR is capable of high-resolution and high-contrast observations regardless of weather conditions and lighting. Figure 1 was formed by arranging strip images over a 75 km observational width acquired from a polar orbit of 568 km altitude. (*4) Alaska Satellite Facility (ASF) of University of Alaska Fairbanks, a participant in this program, is located in Fairbanks, Alaska's second largest city. JERS-1 observed all land areas during its six-and-a-half year mission (1992 to 1998) using an onboard tape recorder. We gained the cooperation of the University of Alaska Fairbanks in receiving satellite data. All mosaics processed in GFMP are available free of charge for research and educational purposes, via Internet (500m and 2km spatial resolution) and on CD-ROM/DVD-ROM (including 100m resolution). Related sites: (*2) (*3) (*4) (*5)
|
|||||||||||||||||