Seen from Space 2004
Special Feature on Coral Reef -Part 2-
Can a Satellite Detect Coral Reef Distribution?
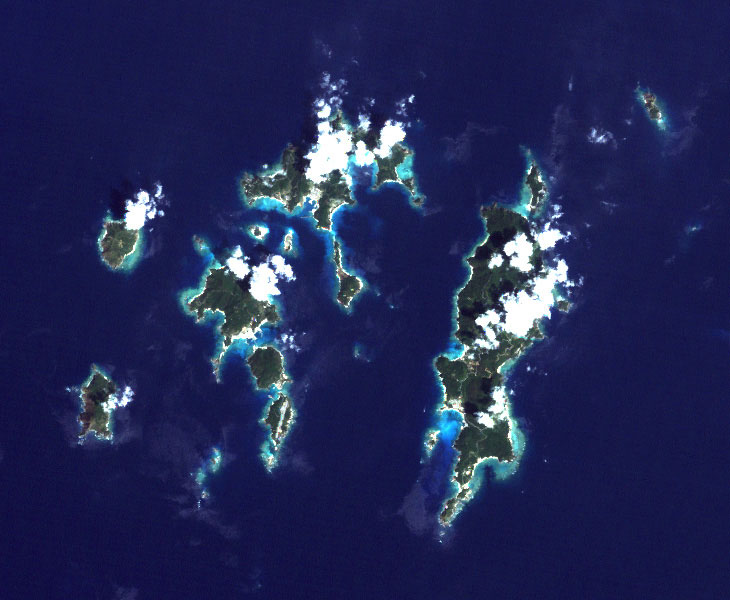
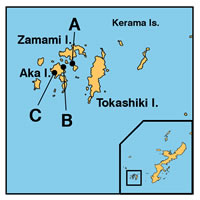
To determine the coral reef distribution by satellite, it is necessary to classify the satellite images of the sea bottom into coral reef, sand, rock, etc. First, we selected Kerama Islands (Fig. 1) as a training area. This region was rich in examples of the classifications. The Kerama Islands are located in the west of Naha approximately an hour by ship, and because coral around the main island of Okinawa is thought to flow from Kerama on sea currents during breeding season, the islands possess a treasury of coral reefs and are very popular among divers.
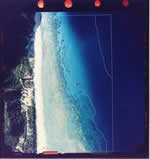
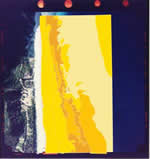
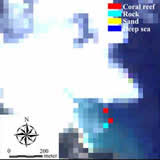
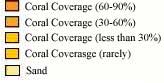
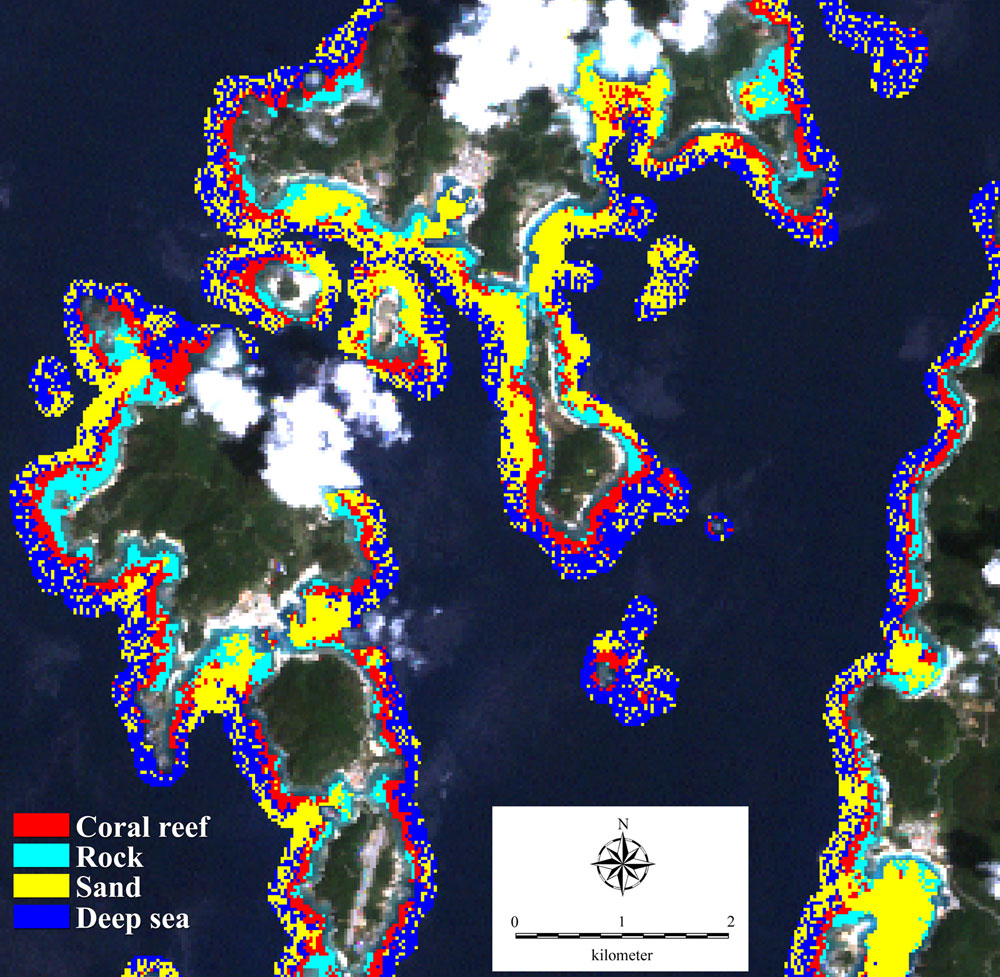
Second, we took aerial images of several sea areas (Fig. 2-A,B,C) of the Kerama Islands as shown in Fig. 3. Then we make out aerial images on the basis of the field survey, and make images of coral coverage and classification of sea bottom as shown in Fig. 4. From the results, we were able to obtain the training data of each area (Fig. 5). We also obtained LANDSAT data during this time. On the basis of classification of training data, we were able to classify the image into coral reef, sand, rock, and deep sea (Fig. 6). This classification was almost 80% correct for high coral coverage in a shallow sea of 2 or 3m depth.
We have found satellite imagery to be quite useful for surveying the coral reef distribution by developing a method to classify the sea bottom in satellite images. However, when we adapt this classification method to sea area around the main land of Okinawa, some problems still remain. - (1) The classification of the sea bottom in Fig. 6 has poor accuracy in deep-sea measurement. (2) Coral immediately after death still has zooxanthella on the surface and may often be misclassified as living coral. (3) It is necessary to rid the sea area of red-soil runoff. Acquiring actual coral reef conditions is not the only difficulty in determining the coral reef distribution area. Because coral reefs absorb 4.3 kg/m2 carbon dioxide a year, which is more than 2-3 kg/m2 of tropical rainforests, by photosynthesis of the zooxanthella, the decline of coral reef may cause increase of carbon dioxide in the atmosphere. The Advanced Visible and Near Infrared Radiometer type 2 (AVNIR-2) on the Advanced Land Observing Satellite (ALOS), which is scheduled to be launched from now, is expected to be capable of surveying with a 10 m resolution compared to the 30 m resolution of LANDSAT. EORC contributes to solving global environmental problems by continued examination and promotion of the application of satellite images for surveying actual conditions of coral reefs.
Related sites: |
|||||||||||||||||||||||||||