Seen from Space 2009
Retreat and Advance of Glaciers in the Juneau Ice Field, Southeast Alaska
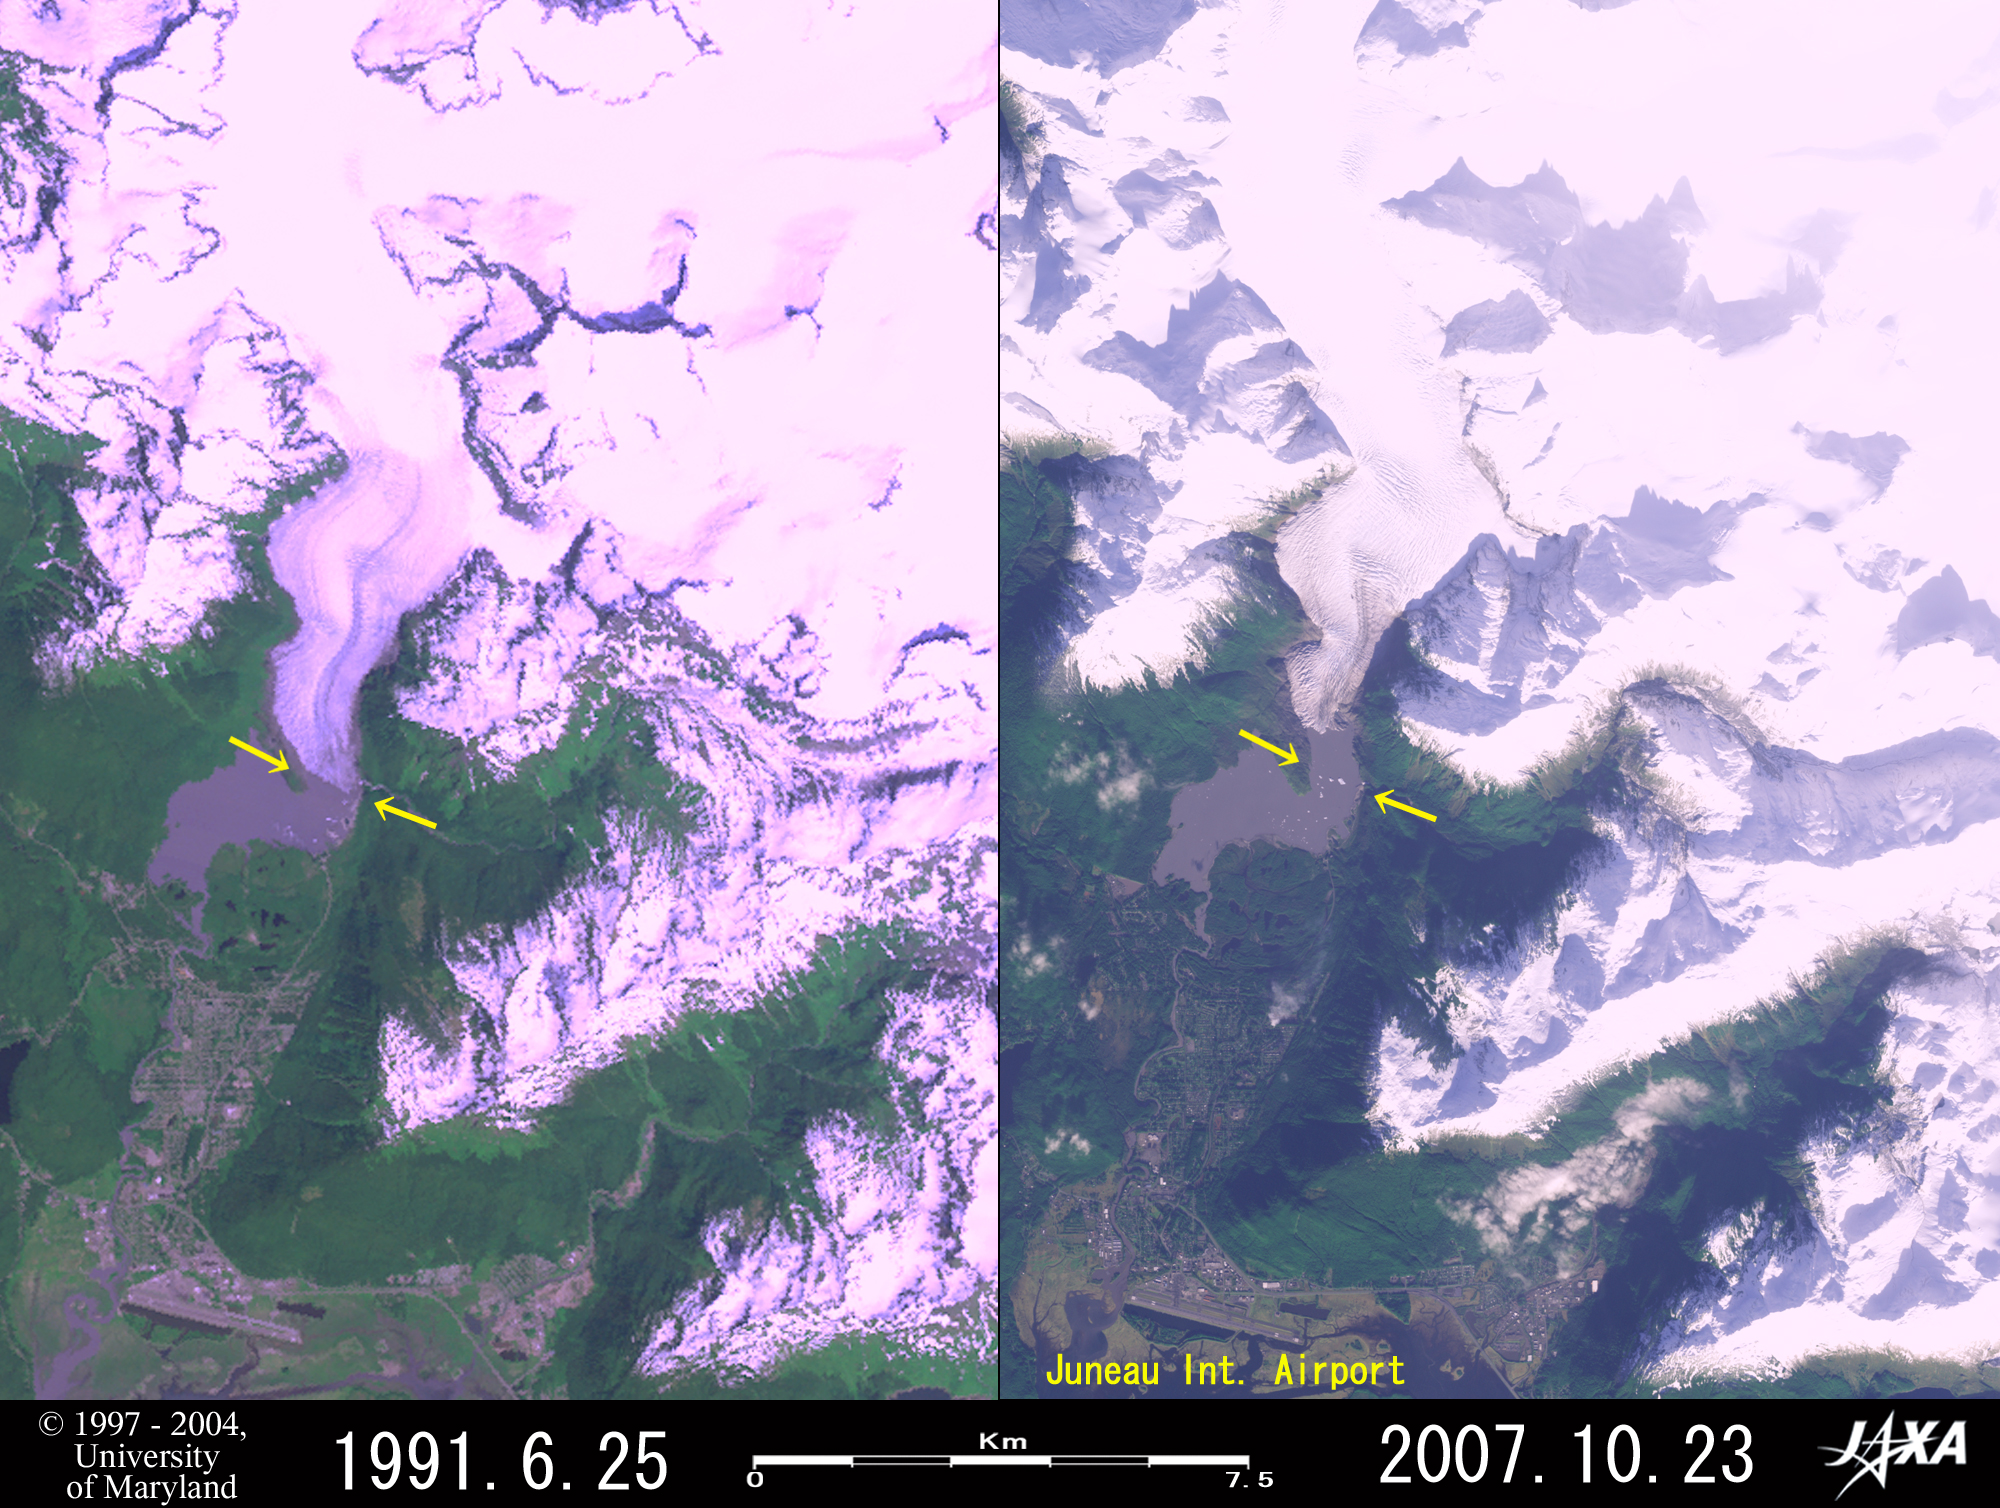 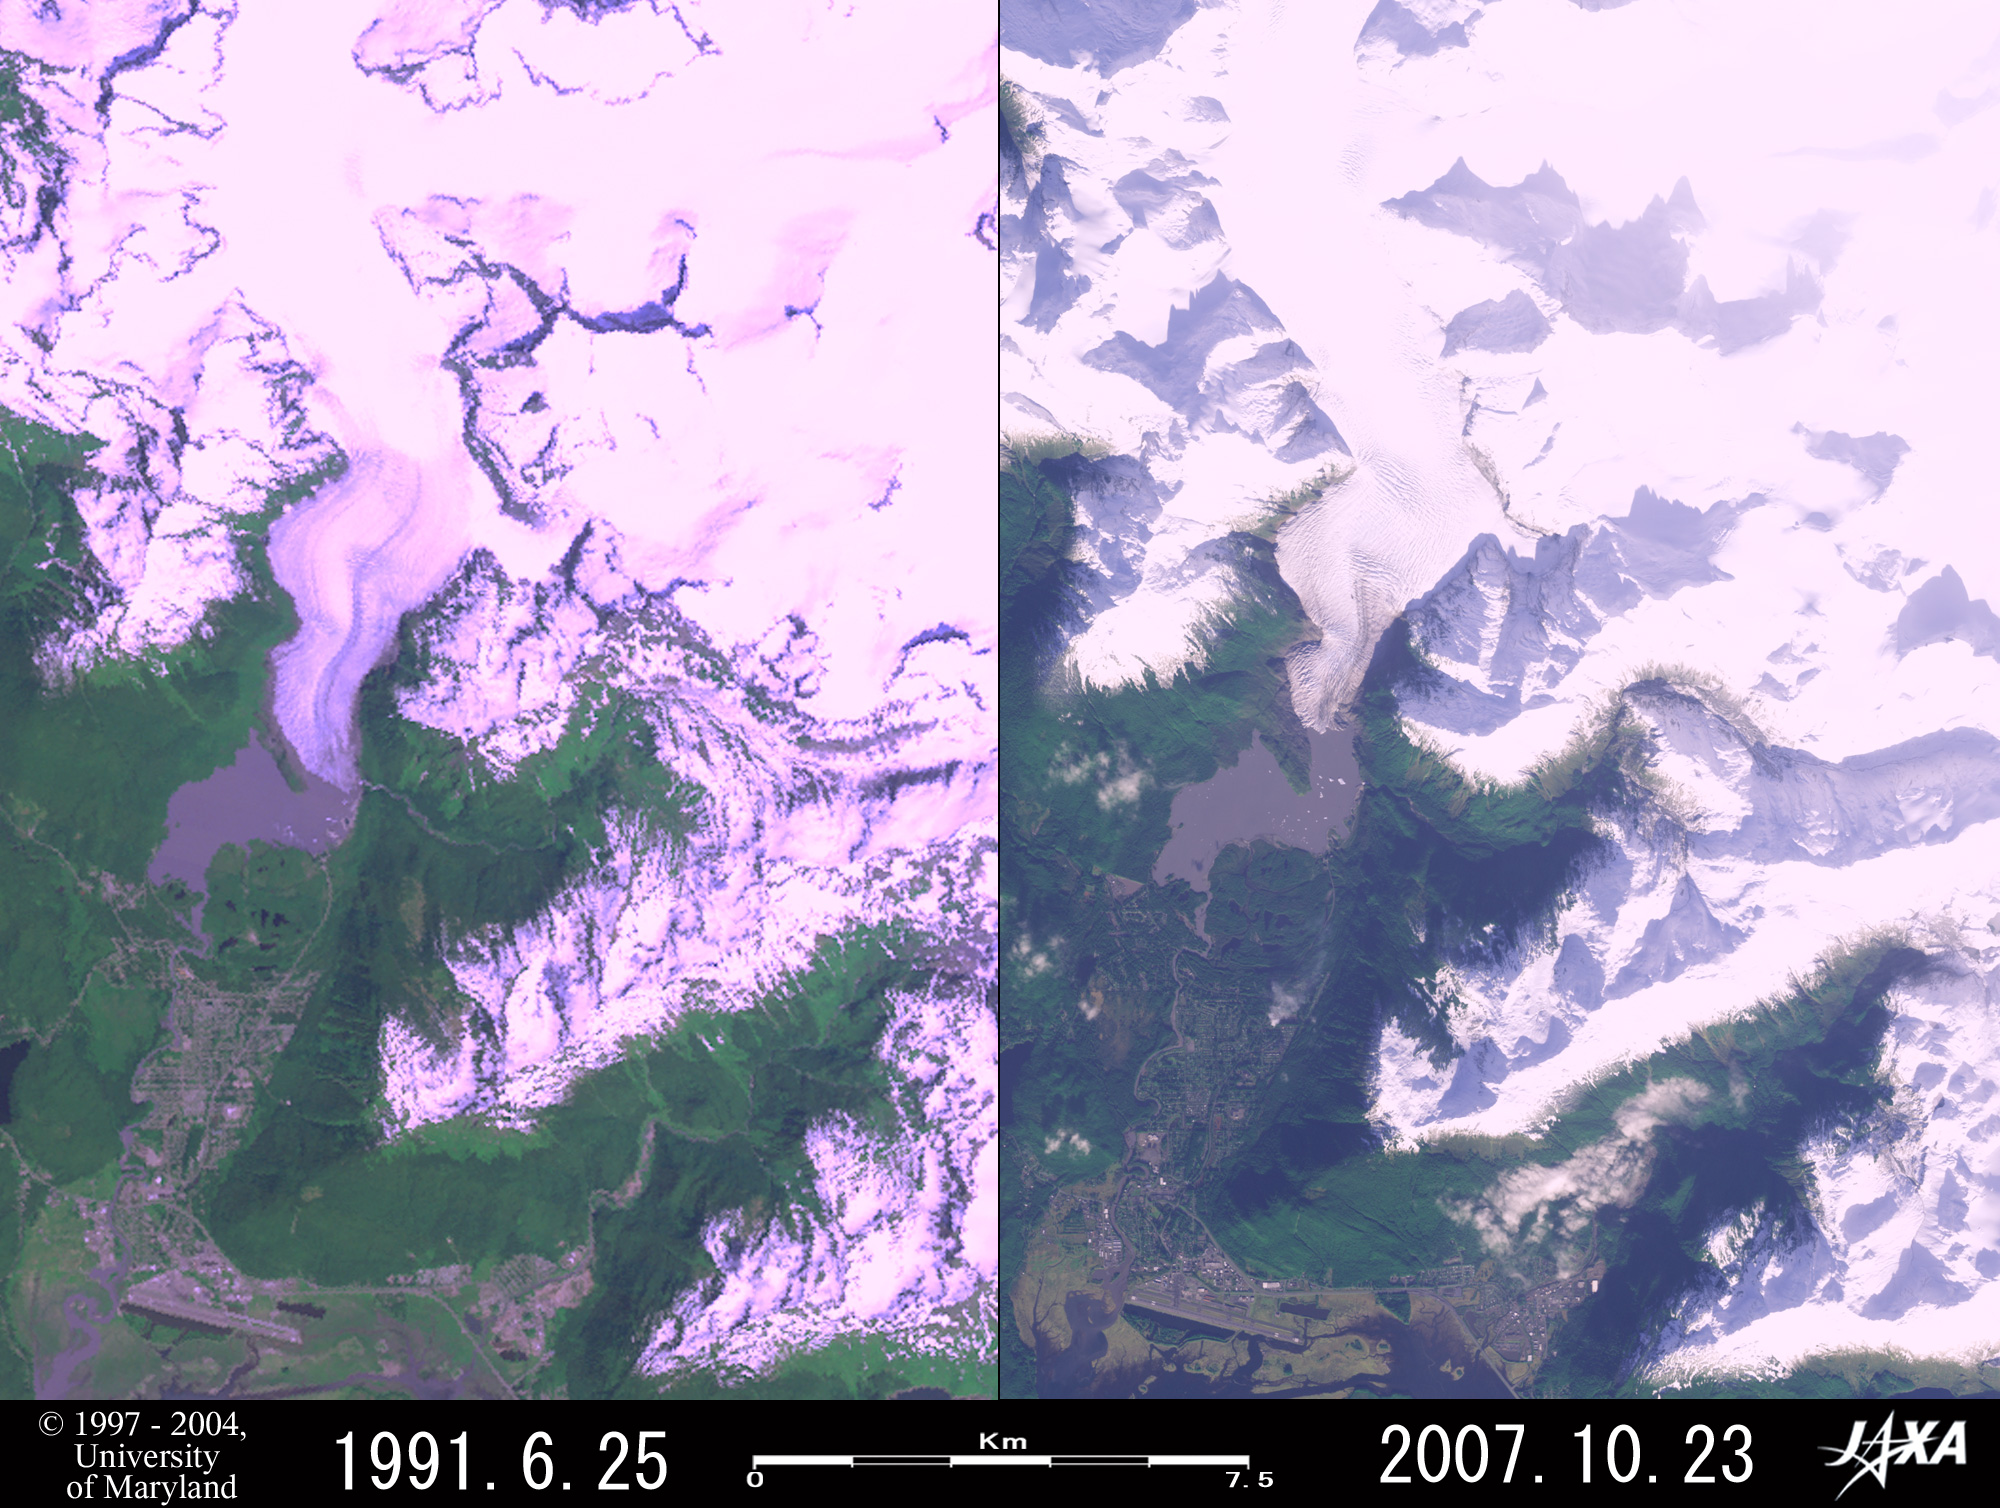 Fig. 1. Retreat of Mendenhall Glacier
Figure 1 shows Mendenhall Glacier, located only 16 km northwest of the downtown area of Juneau, the state capital of Alaska, USA. The left image was observed by the USA's Landsat-5 in 1991 and the right one by Japan's Advanced Land Observing Satellite ("Daichi") in 2007. When comparing both images, you will find that the terminus of the glacier retreated 700 to 900 m during these 16 years and the surface area of Mendenhall Lake in front of the terminus expanded 11 percent from 367 ha (hectare) to 408 ha. The Juneau International Airport has a 2,500-meter-long runway that can be seen at the lower left of the figure. In an expanded image, the 1,700-meter-long watercourse running parallel on the southern side of the ordinary runway can also be seen. This is a watercourse for the taking off and landing of hydroplanes*, which are often used in the coastal areas of southeastern Alaska. Additionally, you can see the residential areas in the suburbs spread to the east and to the north of the airport.  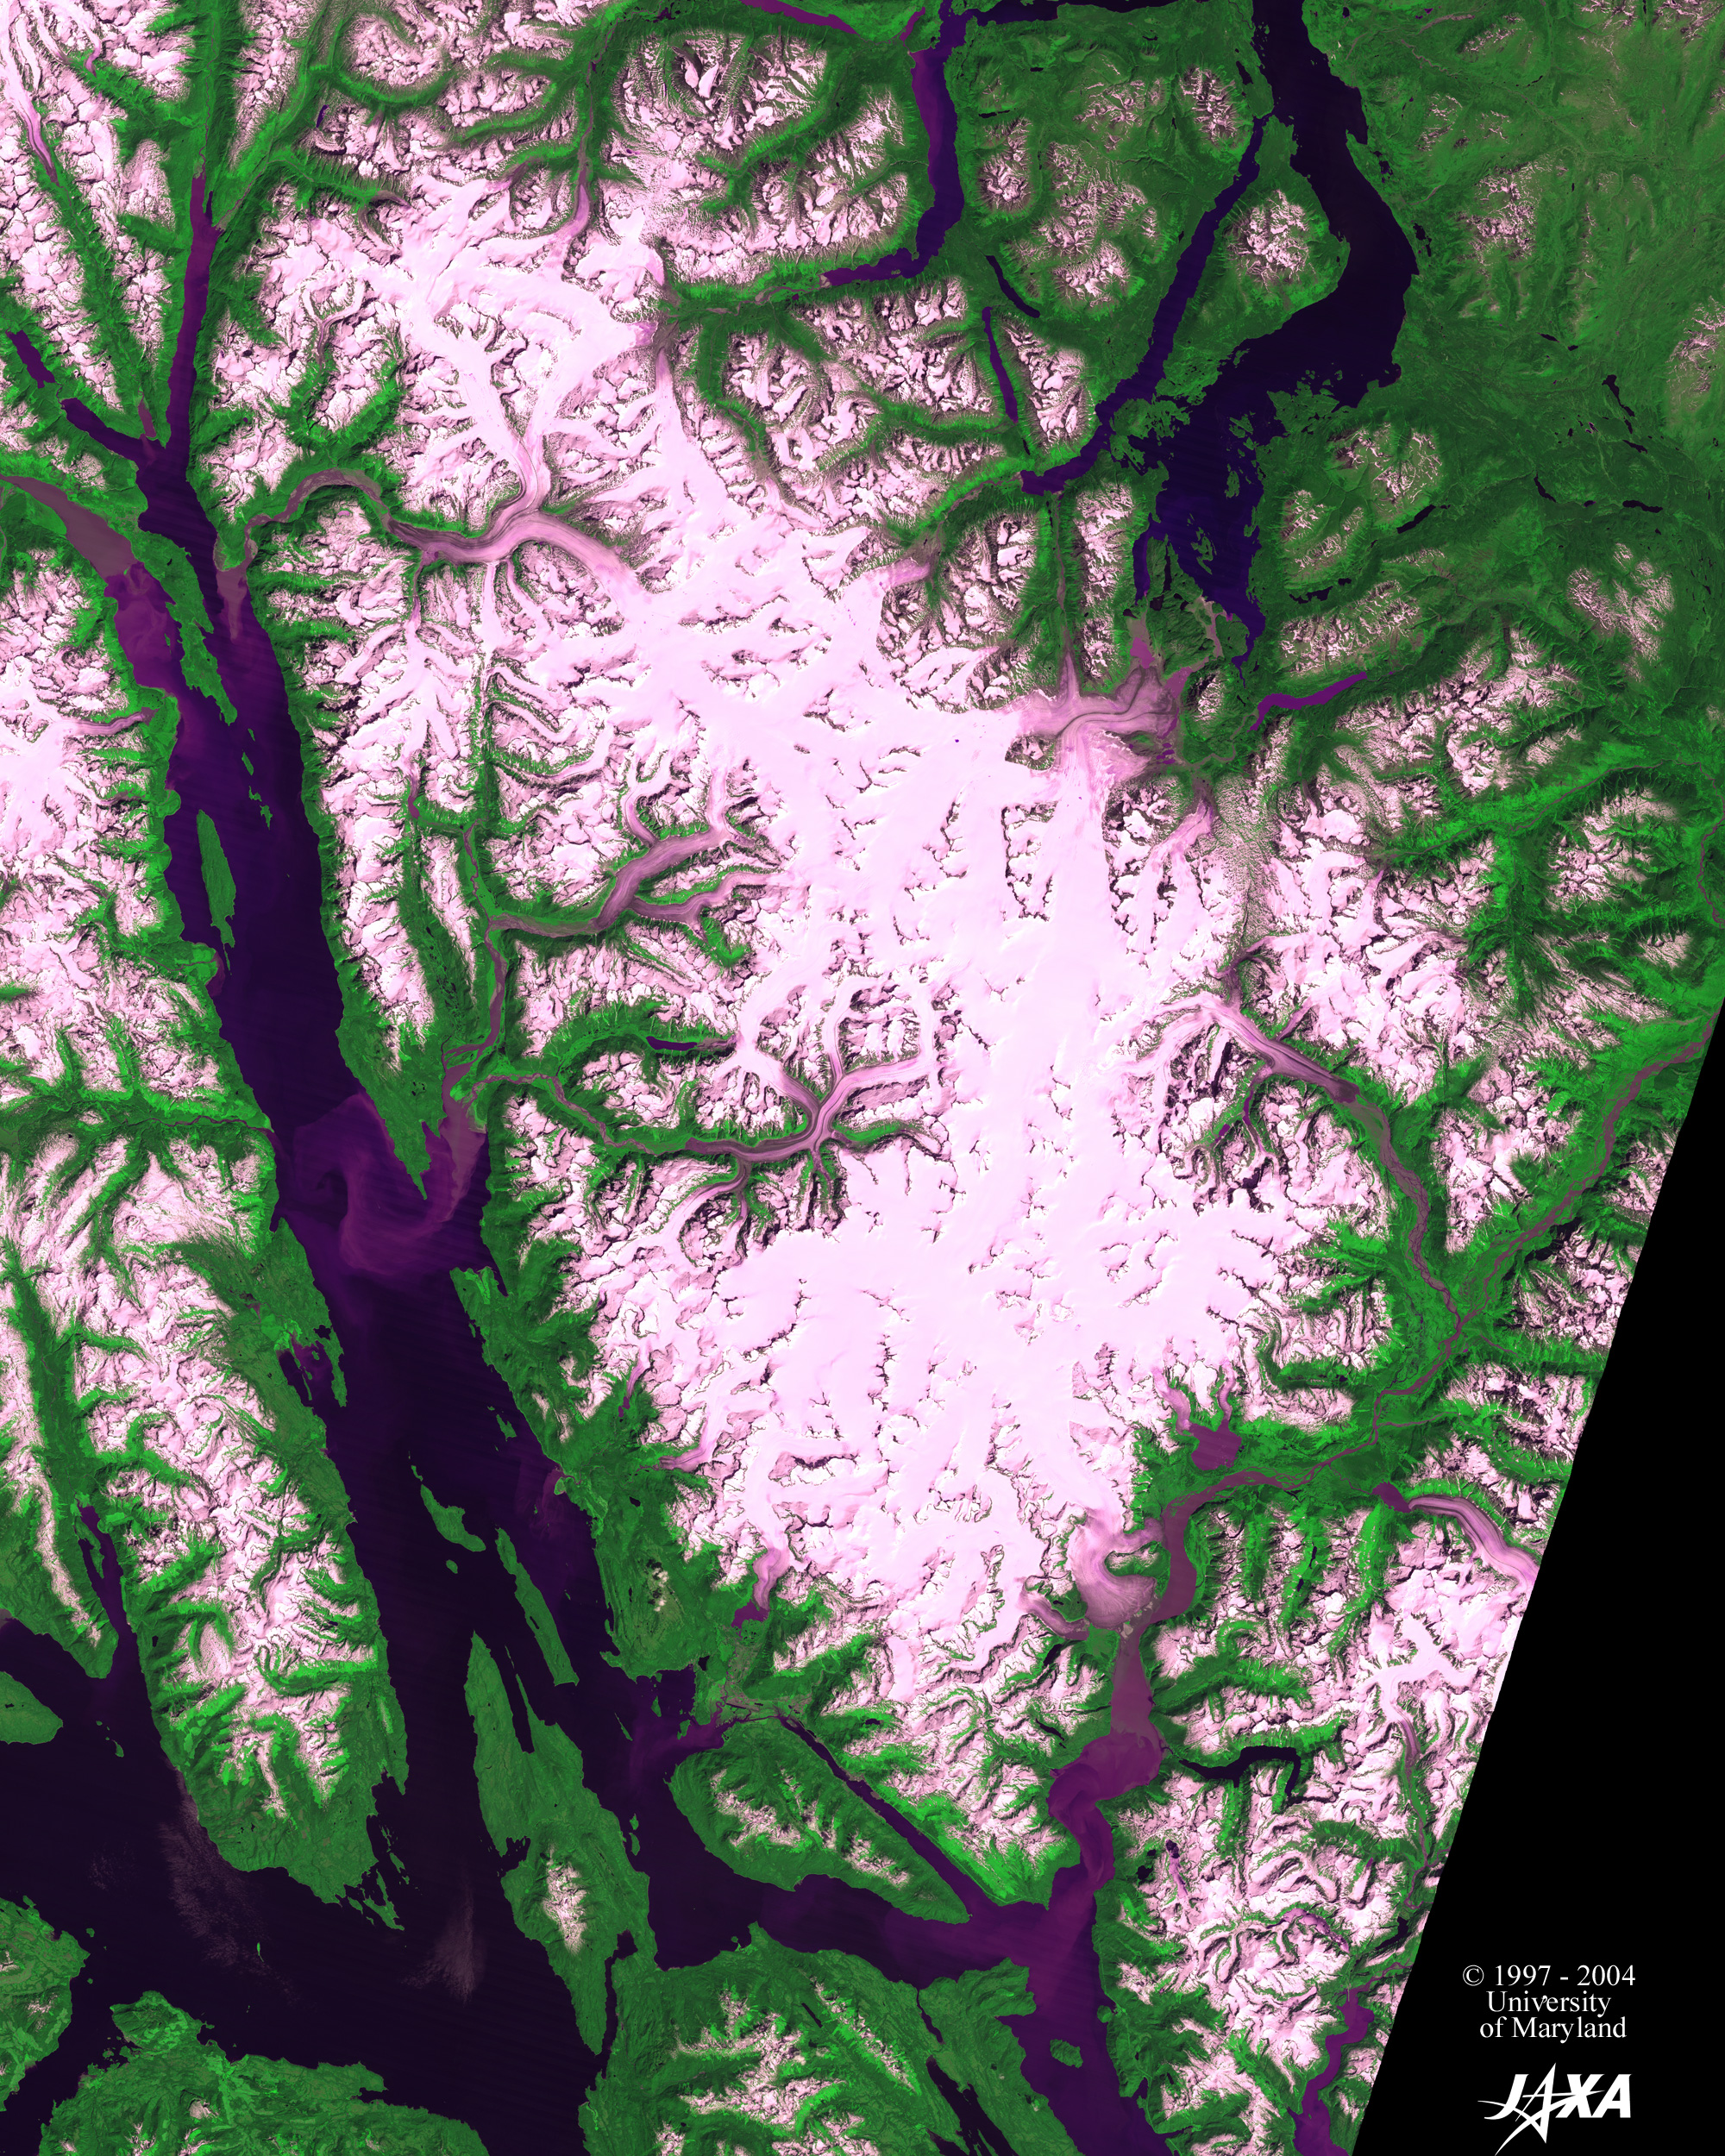 Fig. 2. Wide-Area Image of the Juneau Ice Field
The Juneau Ice Field(kmz, 5.18 MB, Low Resolution) as seen on Google Earth. Figure 2 is a wide-area image of the Juneau Ice Field observed by Landsat-5 in June 1991. The Juneau Ice Field extends over 90 km from east to west and 130 km from north to south between southeastern Alaska, USA, and northwestern British Columbia, Canada, and appears white or pale pink in this image. Mendenhall Glacier in Figure 1, one of many glaciers that flow off the ice field, is located in the southwest. When looking at the ice field clockwise from there, you can see Gilkey Glacier in the west, Meade Glacier in the northwest, Llewellyn Glacier on the northeast, and Taku Glacier and the Twin Glaciers in the southeast. The northern part of Meade Glacier and all of Llewellyn Glacier are located on the Canadian side, while the other glaciers are on the American side. The Coast Mountains in Alaska are covered with ice fields, glaciers, and snowfields. Their origin is a great deal of snow falling after the western wind, carrying moisture from the North Pacific, bumps against these mountains. The amount of precipitation (falling snow) in the Juneau Ice Field is 2,000 to 4,000 mm per year, which is equal to the approximately 3,000 mm per year in the Takada area of Joetsu City, Niigata Prefecture, Japan—an area known for its heavy snowfall.* Acting as indexes of global warming, the advance or retreat of the terminuses of glaciers depends on the balance between the snow falling—a glacier’s income—and the flowing-out as icebergs and melting. Out of the above-mentioned glaciers, only Taku Glacier (refer to Fig. 6) is advancing. All other glaciers (refer to Fig. 1 and Figs. 3 to 5) are retreating.  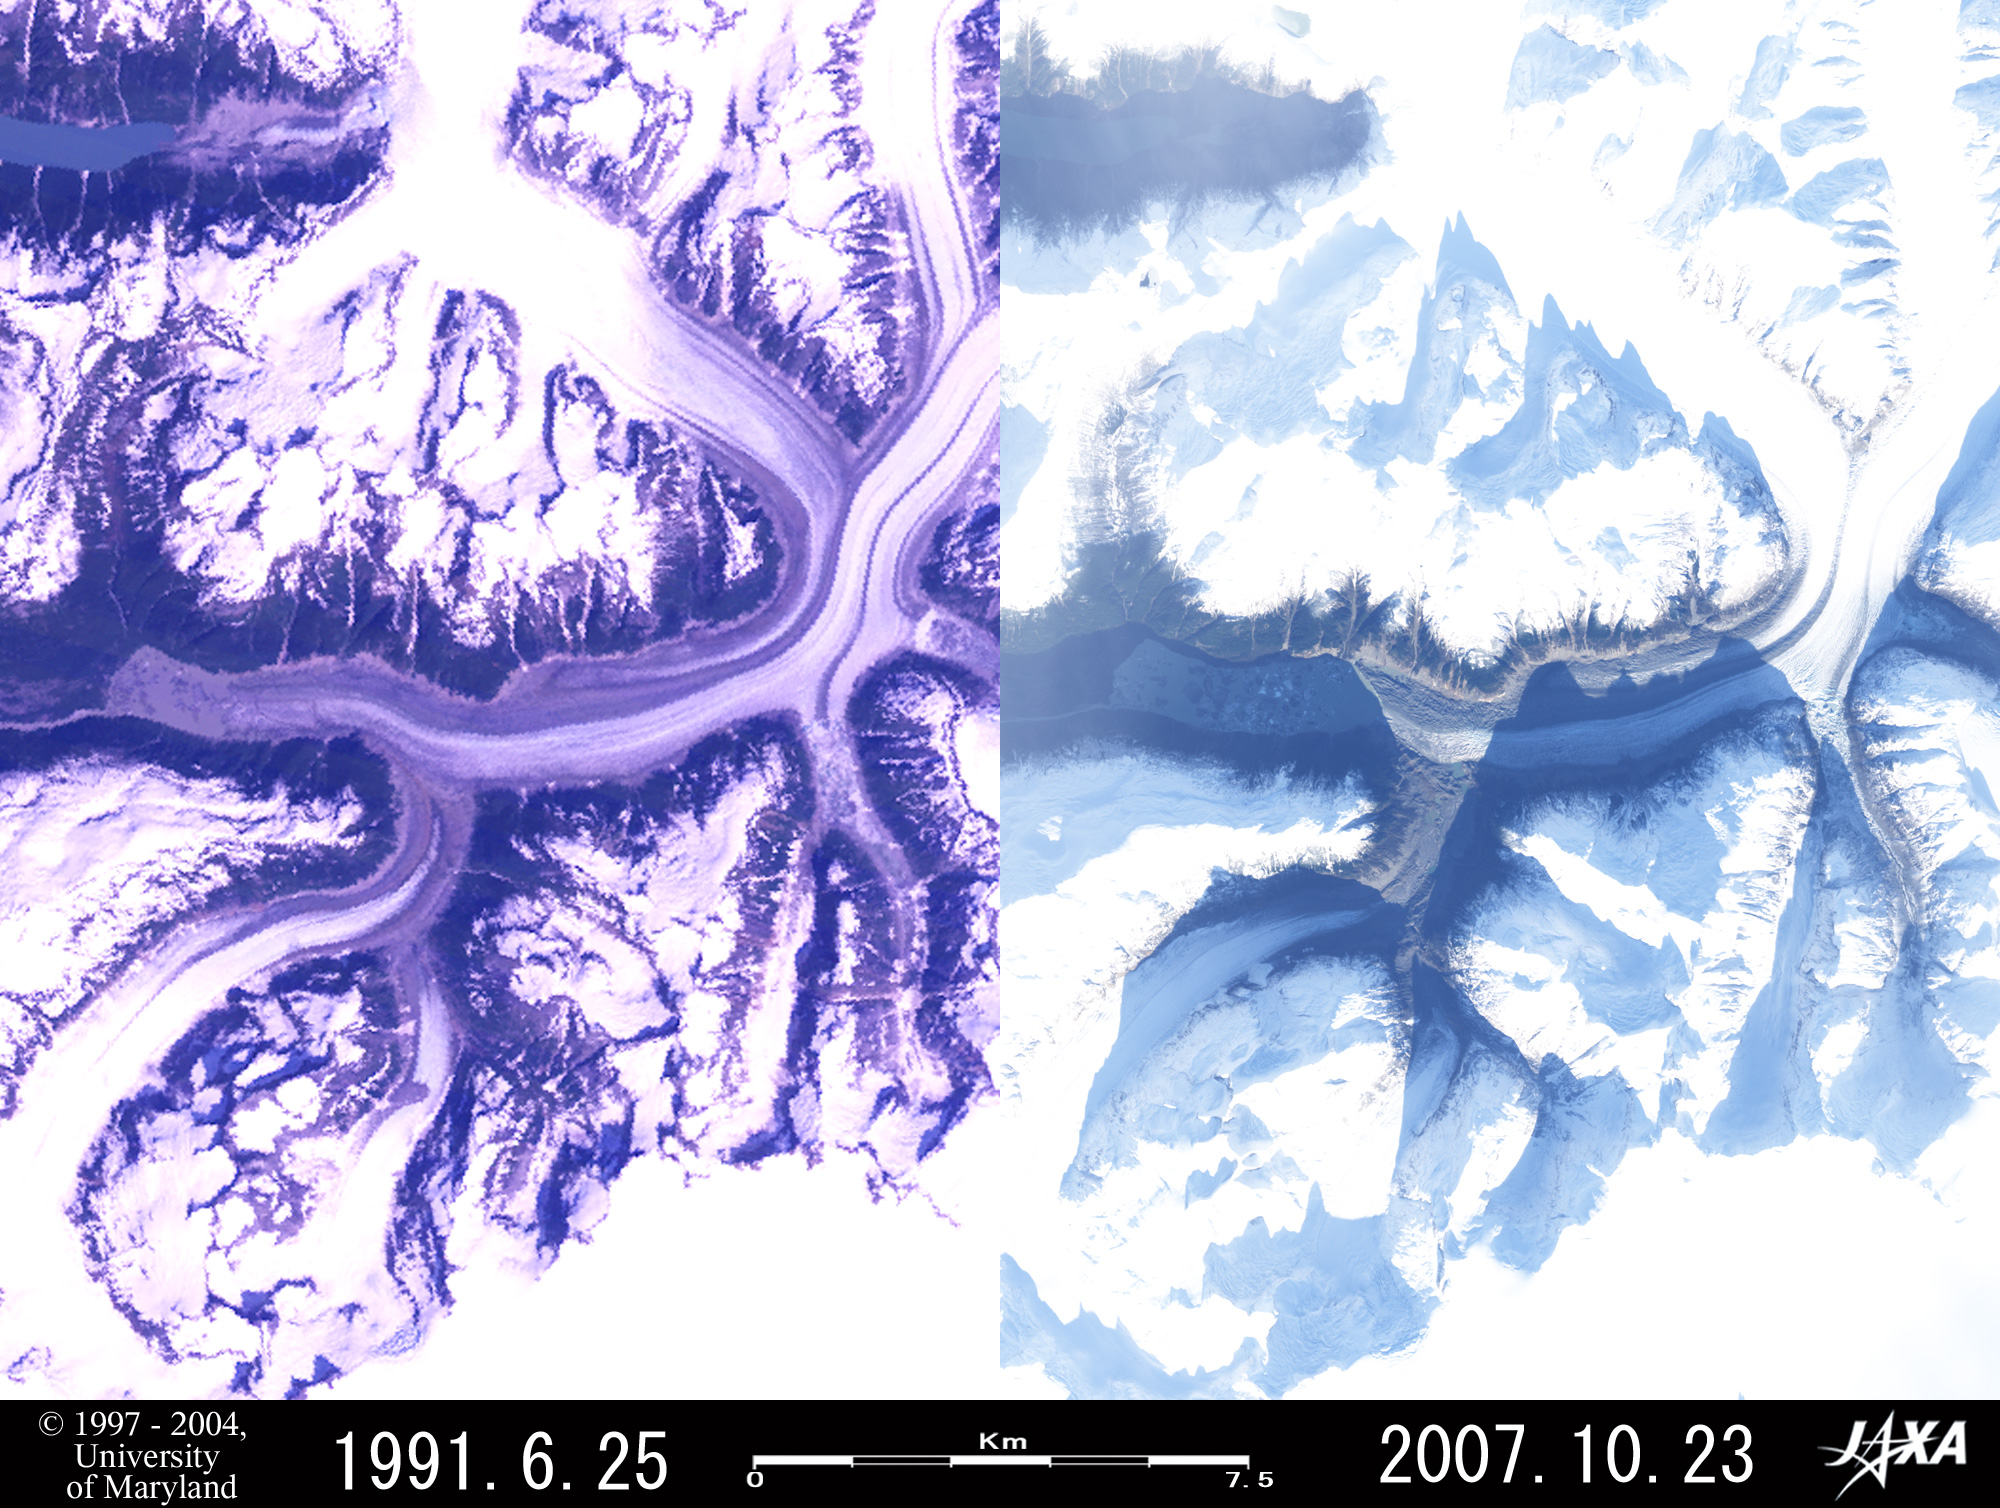 Fig. 3. Retreat of Gilkey Glacier
Figure 3 shows Gilkey Glacier, located in the west of the Juneau Ice Field. You can see that the terminus of the glacier at the left of the figure retreated as much as 1,900 to 2,500 m during the 16 years between 1991 and 2007, and the surface area of the glacial lake expanded 2.3 times from 171 ha to 397 ha. Please forgive that the bright areas in the right side of the image are hard to see. We tuned the image quality in order to catch the details of the dark surfaces of the glacier and glacial lake shaded by the mountains, which is caused by a low sun elevation of 19.7° 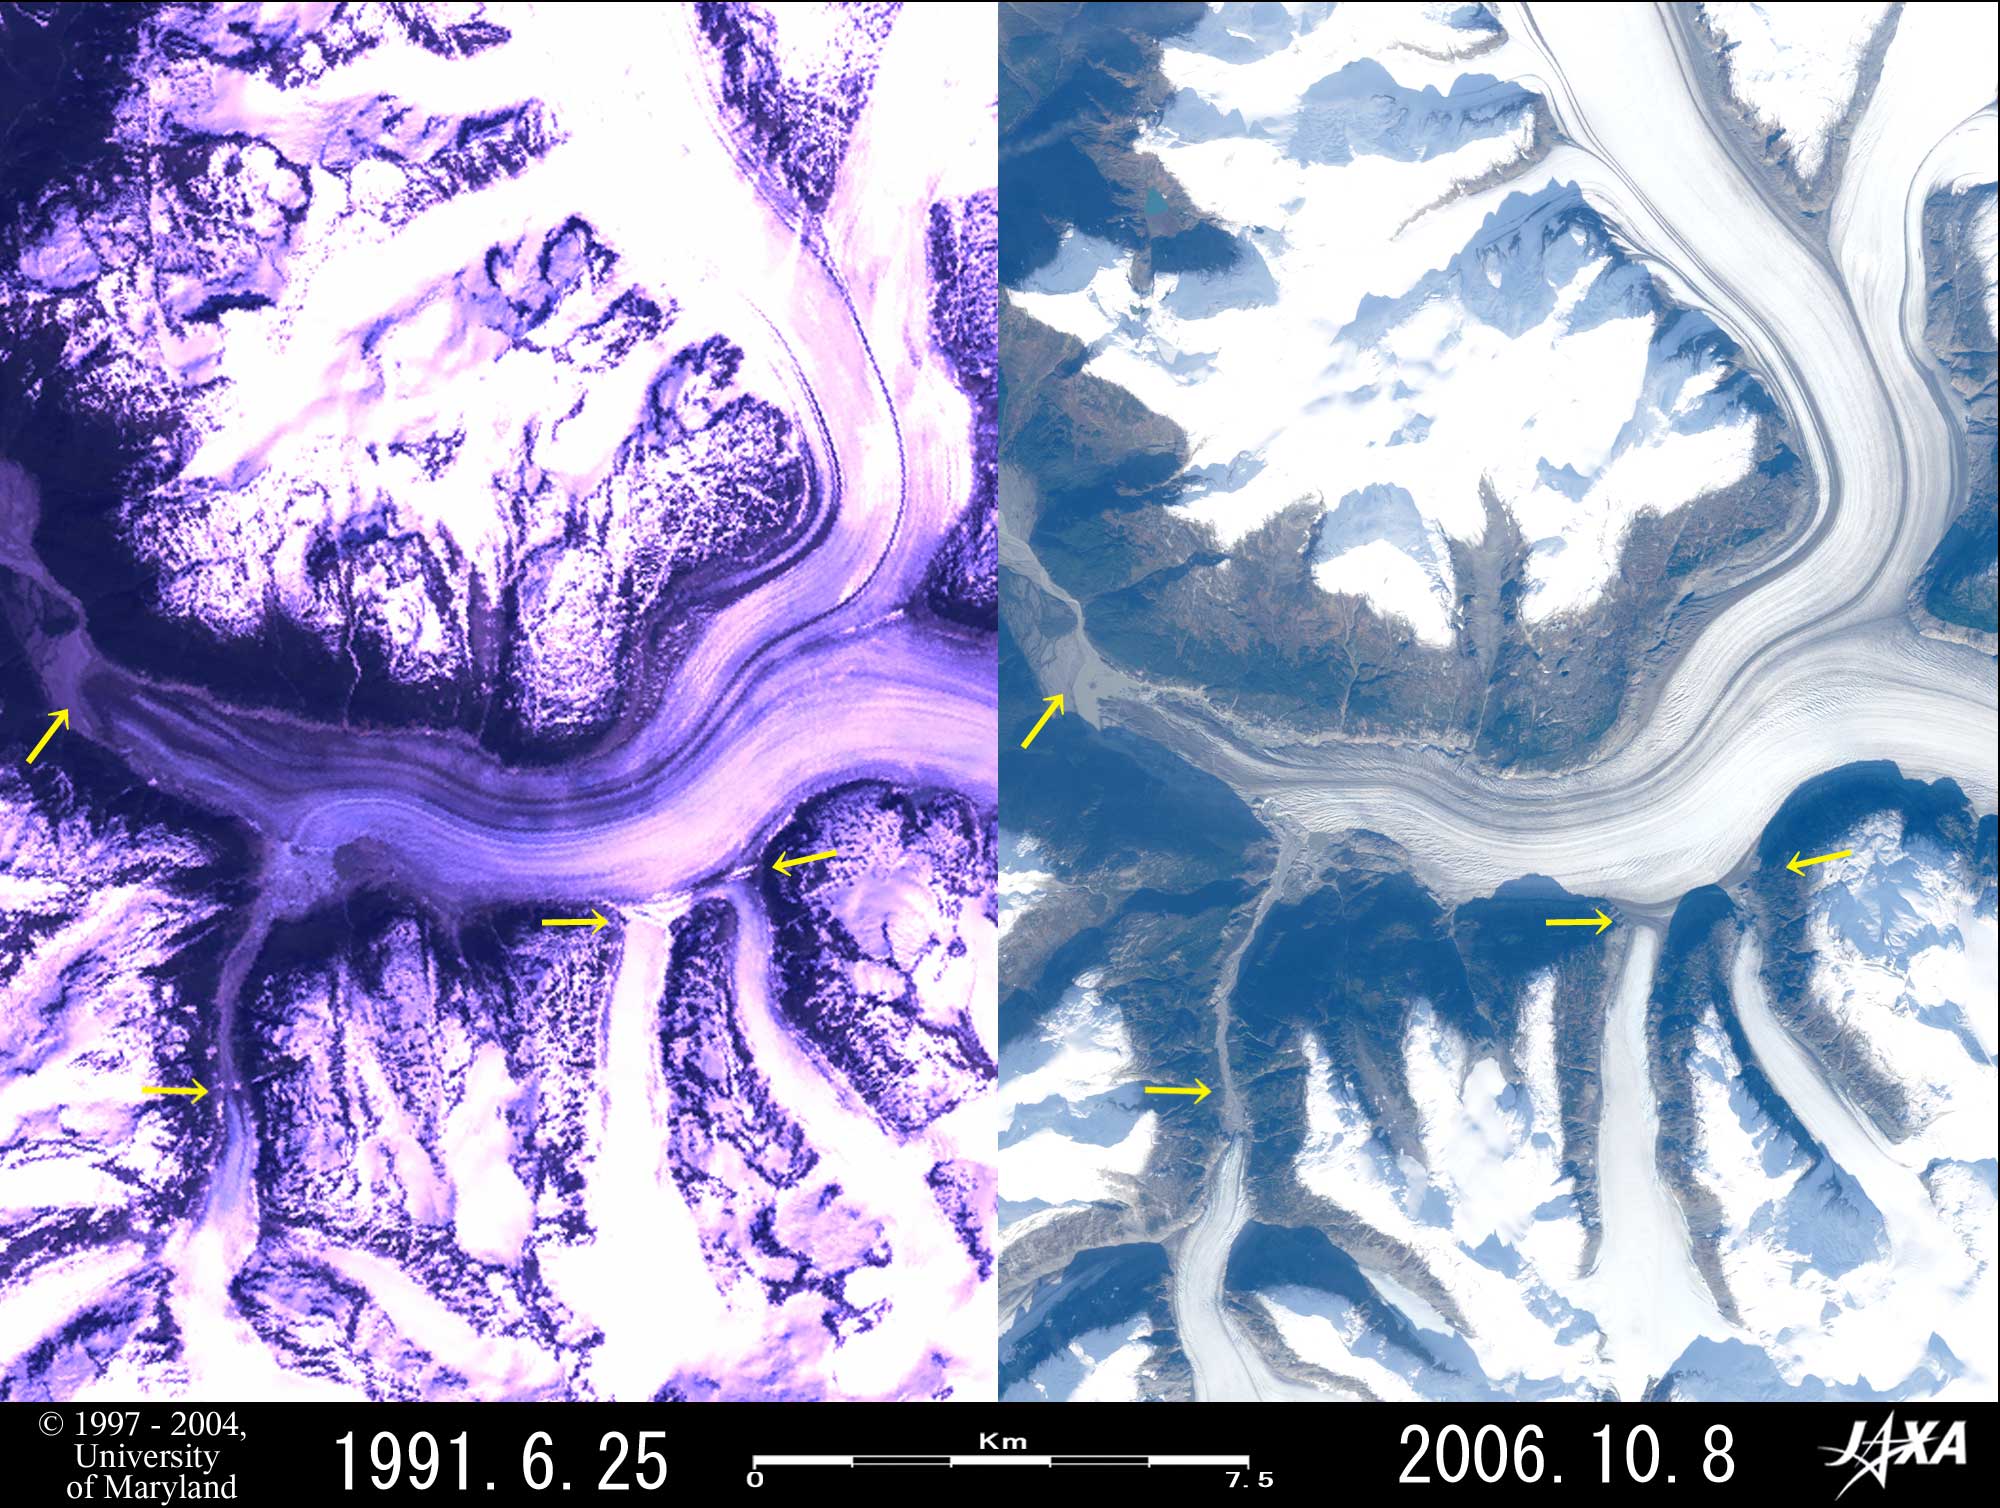 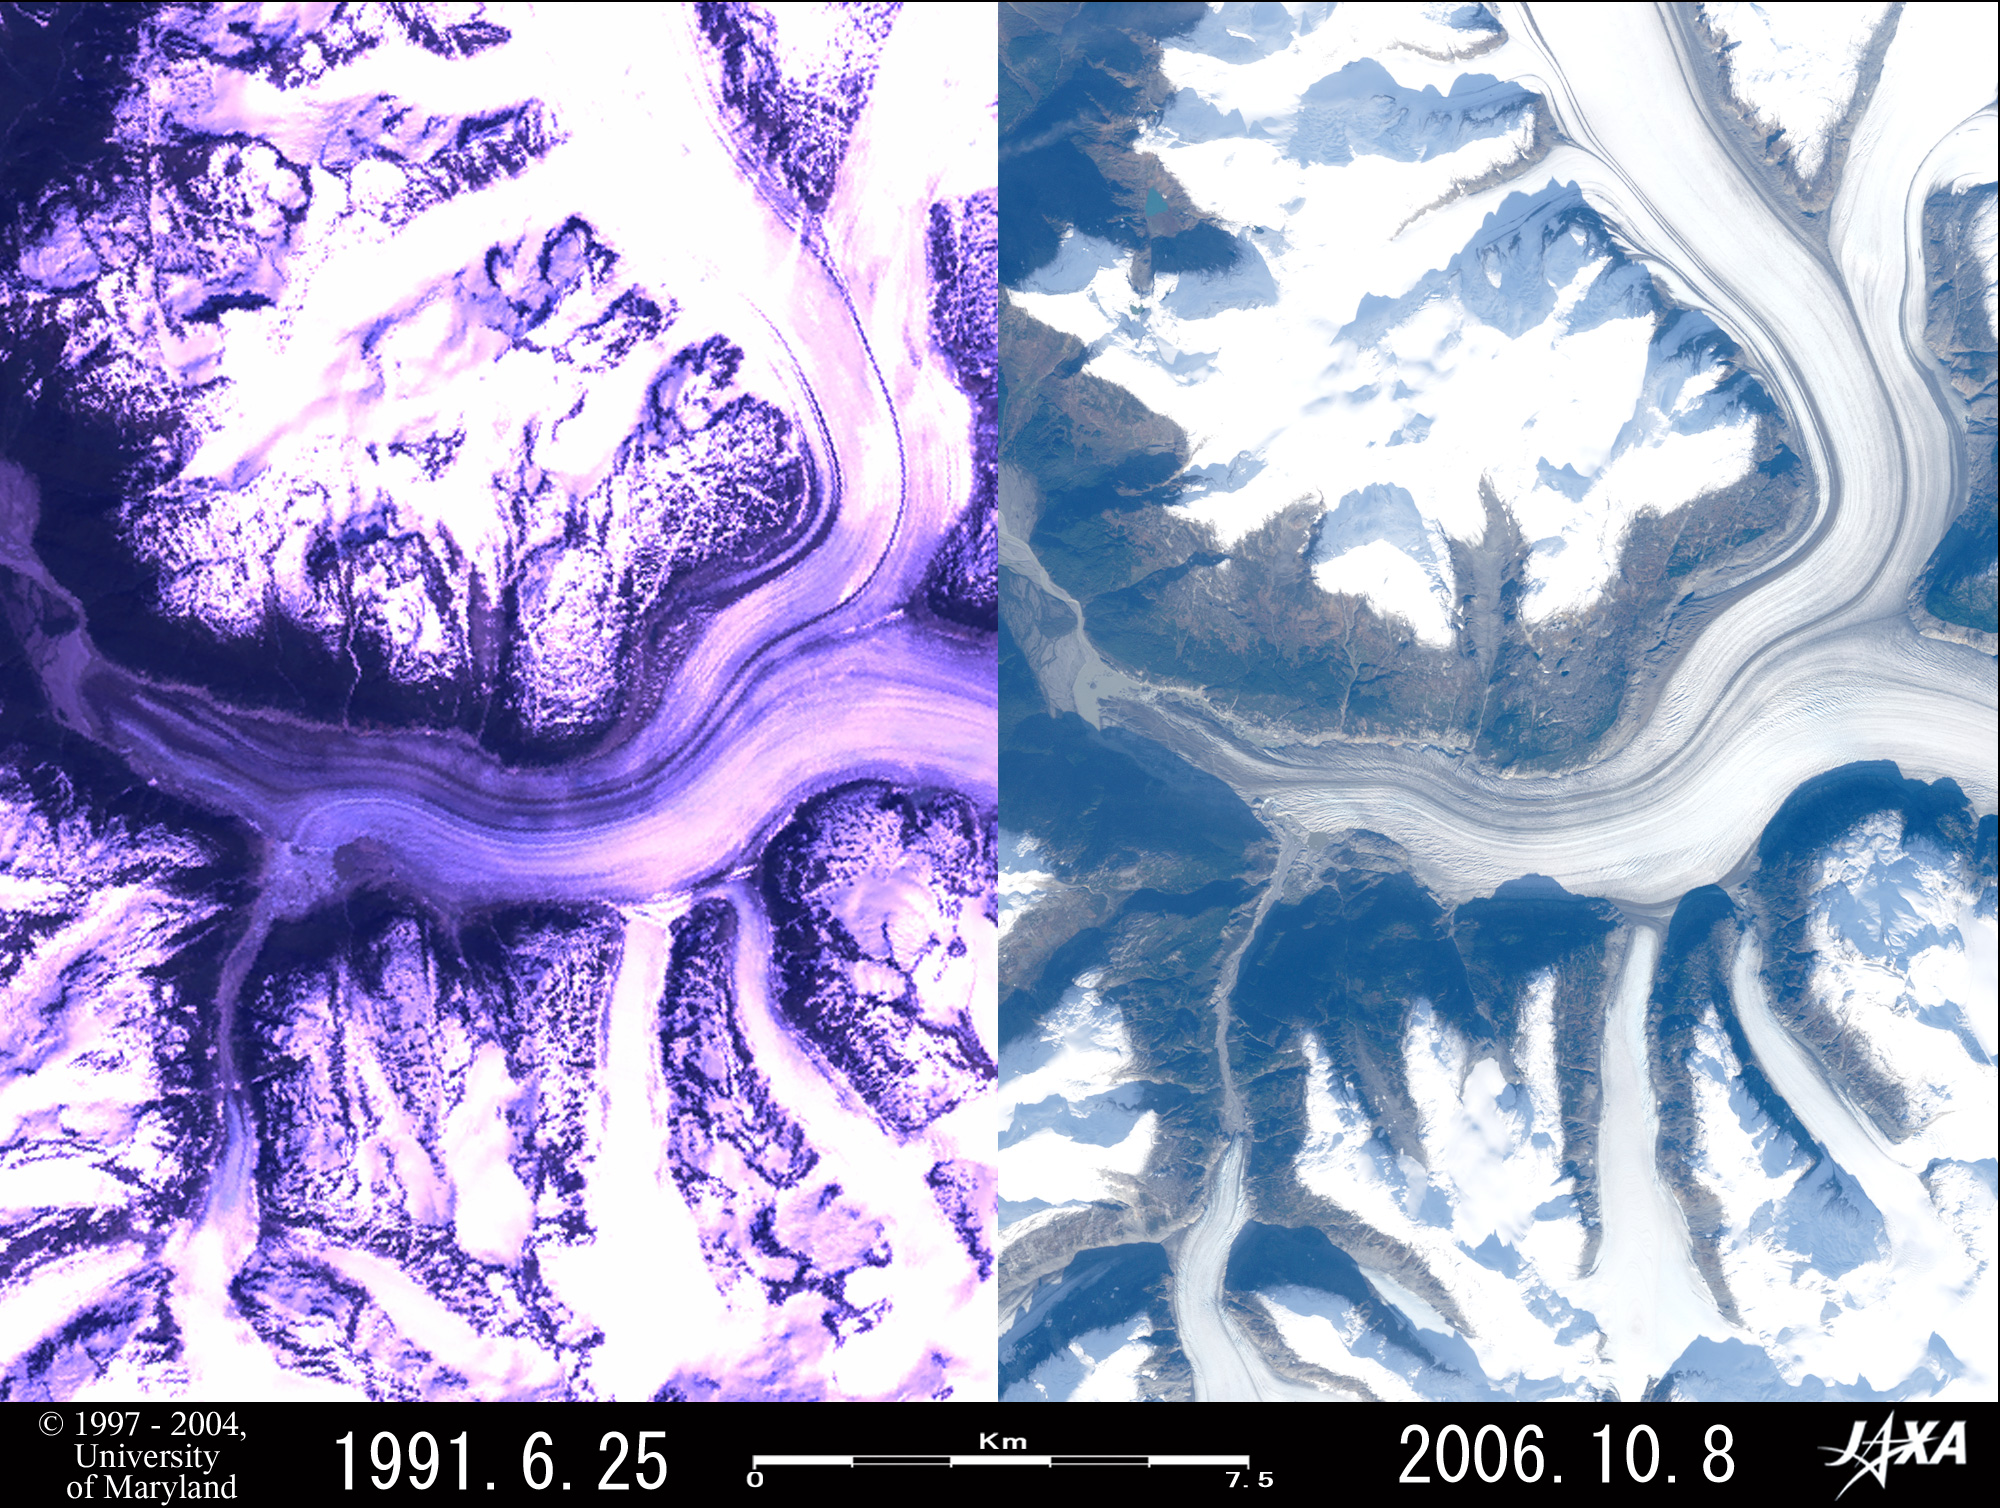 Fig. 4. Retreat of Meade Glacier
Figure 4 depicts Meade Glacier, located in the northwest of the Juneau Ice Field. You can find that the terminus of the glacier at the left of the figure retreated 570 m during the 15 years between 1991 and 2006, and a 63-hectare-wide glacial lake was newly formed ahead of the terminus. The terminus of the branch glacier at the lower left of the figure also retreated 570 m and the terminuses of the two branch glaciers, which flow northward from the lower right of the figure and join the Meade Glacier, retreated 340 m and 680 m respectively and separated from the main glacier. Some areas midstream of the glacier appear narrower, but this is because of a low sun elevation of 24.6˚ in the right side of the image that causes the mountains to shade the surface of the glacier and the glacial lake. Please consider this when viewing the image. 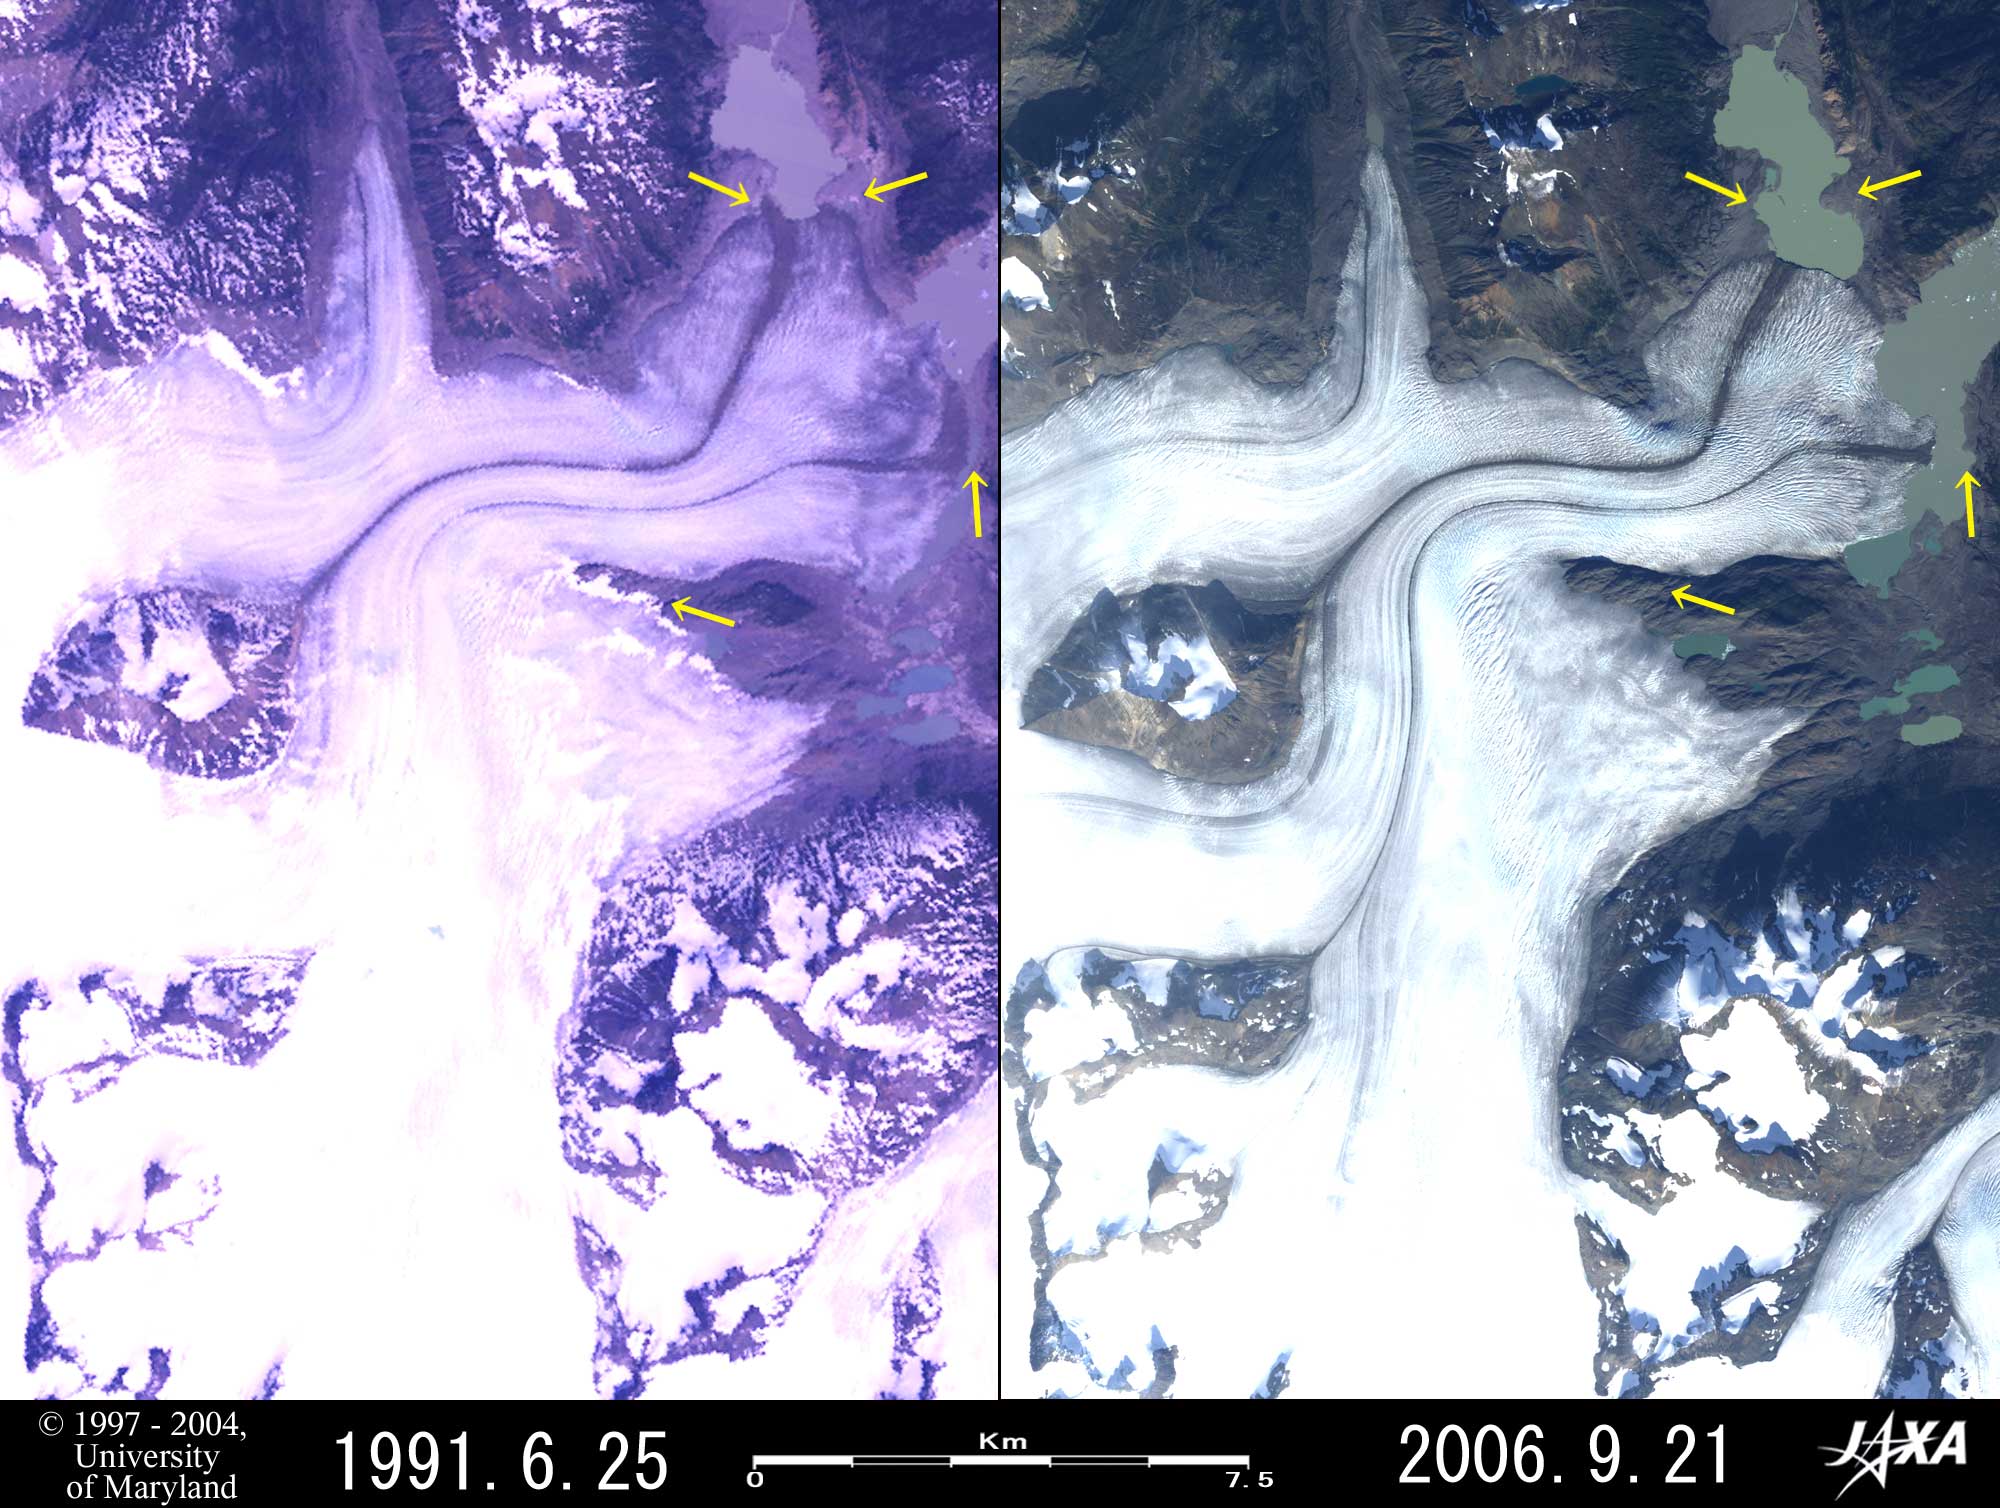  Fig. 5. Retreat of Llewellyn Glacier
Figure 5 indicates Llewellyn Glacier, located in Canada. The terminuses of the glacier and two glacial lakes can be seen at the upper right of the figure. The figure shows that the glacier has retreated during the 15 years between 1991 and 2006 and the glacial lakes have expanded. Because of the complicated shape of the terminuses, retreating lengths are different depending on the place measured, but retreating of the northern terminus is as much as 200 to 1,000 m, and the eastern terminus 500 to 1,140 m. You can also see reduction of the width of the glacier adding to the retreat of the terminuses. 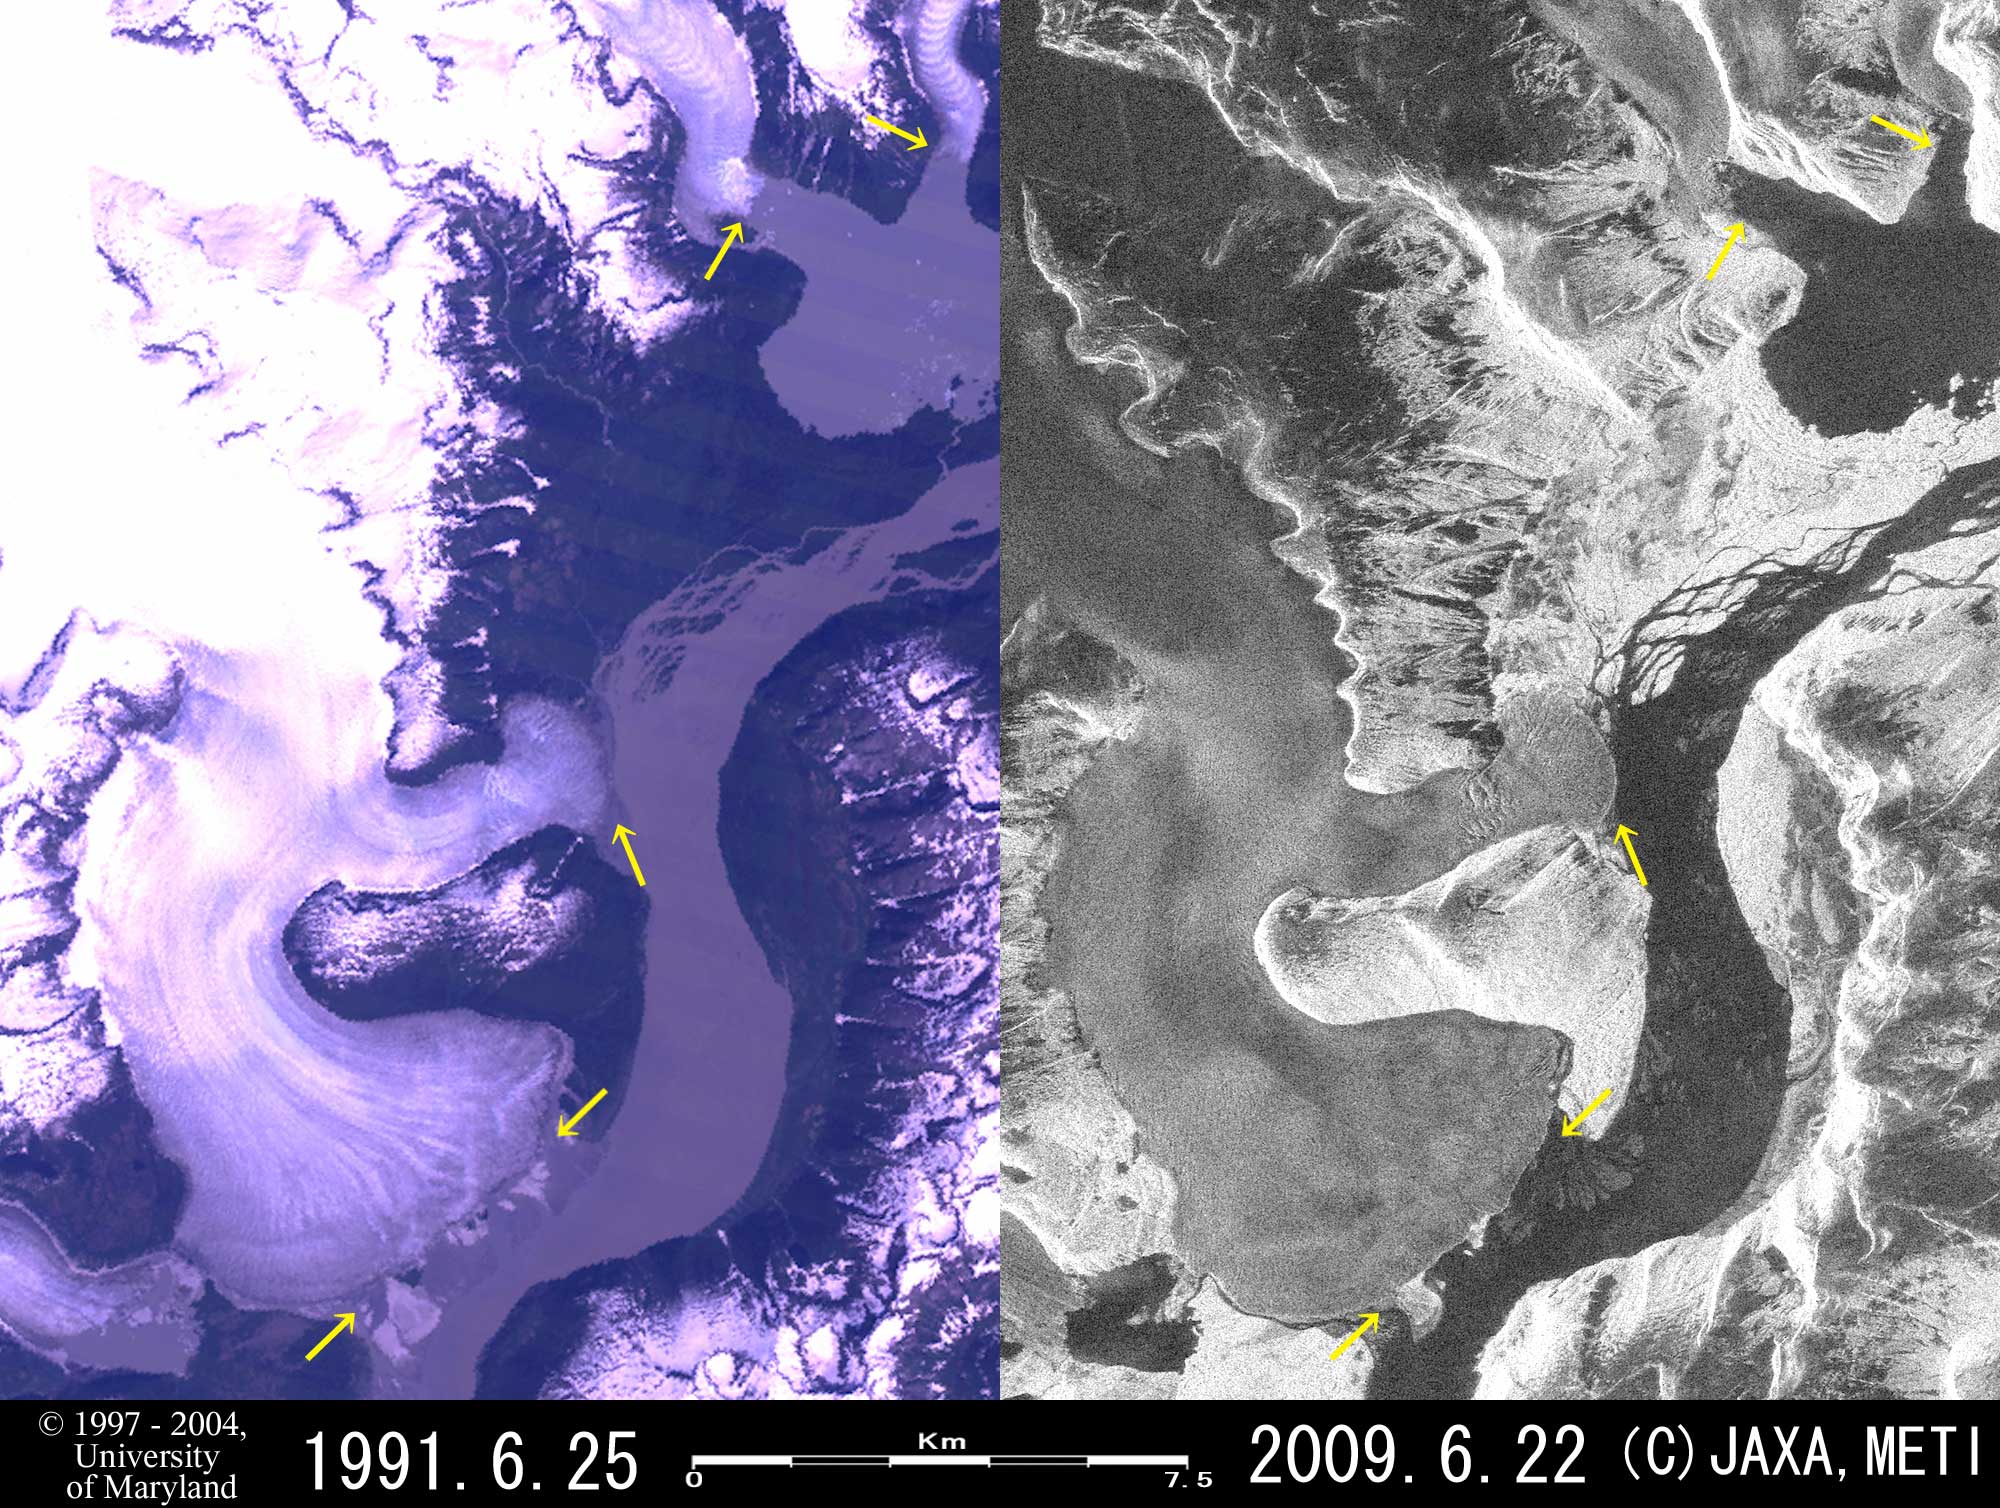  Fig. 6. Advance of Taku Glacier
Figure 6 shows Taku Glacier, the largest outlet glacier from the Juneau Ice Field, and the major terminus is as wide as 4.5 km. Because the image on the left was observed by the optical sensor and the one on the right by the Synthetic Aperture Radar (a radio wave sensor) the objectives look different between the left and right images. If you compare them carefully, you will find that the major terminus at the bottom of the figure advanced 300 m during the 18 years between 1991 and 2009 and the terminus of the northern branch advanced 200 m. Taku Glacier is a tidewater glacier (a glacier reaching the sea) that pours into Taku Inlet. Reference Sites:
Explanation of the Images: (Right sides of Figs. 1, 3, 4, and 5)
AVNIR-2 has four observation bands. These figures were composed by assigning red to visible Band 3 (610 to 690 nm), green to visible Band 2 (520 to 600 nm), and blue to visible Band 1 (420 to 500 nm). The resulting image has natural coloring as if seen by the naked eye. In these images, snow and ice are white or pale gray, exposed rocks are dark brown, vegetation is green, and water surfaces are dark blue or light blue. In Fig. 1, green is assigned to the sum of 70% of Band 4 (760 – 890 nm) and 30% of Band 2. Then green indicating vegetation is exaggerated in Fig. 1. The ground resolutions of these figures were reduced to 15 m to cover a wider area. (Left side of Fig. 1, Fig. 2, and left sides of Figs. 3 to 6)
Here, we used data downloaded free of charge from the Global Land Cover Facility (GLCF) Earth Science Data Interface operated by the University of Maryland, USA.
Figure 6 indicates the strength of the PALSAR-transmitted radar signal as it is scattered back by the Earth's surface. Therefore, smooth water surfaces appear black because they return hardly any radar signal, and rough surface glaciers and rocks appear bright because they strongly reflect the signal. The ground resolution was reduced to 15 m to cover a wider area. Related Sites |


