User' s Guide
Apr 07, 2026 JAXA/EORC
1. Introduction
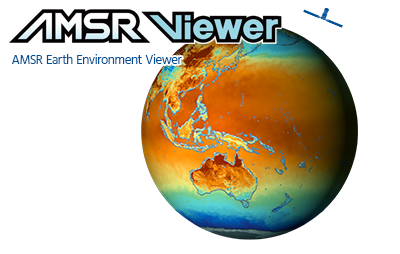
The AMSR Earth Environment Viewer (AMSR Viewer) is a system for displaying global earth observation data obtained from the Advanced Microwave Scanning Radiometer (AMSR) series, which consists of the GCOM-W/AMSR2 and the Aqua/AMSR-E. The AMSR Viewer has provided daily images of observed brightness temperature and estimated geophysical data since June 2002.
The AMSR series is a satellite sensor that responds to microwave signals naturally emitted from various materials on the earth. These signals enable us to estimate various geophysical quantities related to the water cycle based on the characteristics of microwaves. The AMSR can cover more than 99% of the earth's surface in just two days. Utilizing its wide area and high frequency observation, it is used in diverse fields, such as weather forecasting, surveying fishing grounds, climate change, and water cycle research.
AMSR Viewer can display images of observation data and water-related geophysical quantities in up to three layers. It can also save a displayed image and to display and save the time series graph. As we continue to make improvements, please send any comments or requests to the JAXA/EORC AMSR office .
If you would like to know more about AMSR series, you can find the related information here.
2. Specification of displayed image
| Map image | Images of observation data (brightness temperature) and geophysical data related to water cycle such as precipitation, sea surface temperature and soil moisture. |
|---|---|
| Display range | Global, Arctic, Antarctic |
| Temporal resolution | Daily (start time of the day = 00:00 UTC) |
| Data source | Gridded data product of AMSR series (JAXA Products) |
| Data period | AMSR2: July 3, 2012 - Present AMSR-E: June 1, 2002 - October 4, 2011 AMSR3: coming soon |
| Grid size |
Global:0.1°(approx. 11km at the equator) ※WGS 84/Pseudo-Mercator (EPSG:3857) Arctic:10km ※WGS 84/NSIDC Sea Ice Polar Stereographic North (EPSG:3413) Antarctic:10km ※WGS 84/NSIDC Sea Ice Polar Stereographic South (EPSG:3976) |
| Frequency of update | The early version is created within 3 hours after observation and will be overwritten after the official version is created. |
| Units of Observed value | ||||
|---|---|---|---|---|
| Daily | Latest 5-day mean | Half-monthly | Monthly | |
| Sea Surface Temperature (SST) | ℃ | ℃ | ℃ | ℃ |
| Sea Surface Wind Speed (SSW) | m/s | m/s | m/s | m/s |
| All-weather Sea Surface Wind Speed (ASW) | m/s | m/s | m/s | m/s |
| Land Surface Temperature (LST) | ℃ | ℃ | ℃ | ℃ |
| Snow Depth (SND) | cm | cm | cm | cm |
| Soil Moisture Content (SMC) | Volumetric water content in % | Volumetric water content in % | Volumetric water content in % | Volumetric water content in % |
| Precipitation (PRC) | mm/h | mm/h | mm/h | mm/h |
| Total Precipitable Water over Land (PWL) | kg/m2 | kg/m2 | kg/m2 | kg/m2 |
| Integrated Water Vapor (TPW) | kg/m2 | kg/m2 | kg/m2 | kg/m2 |
| Integrated Cloud Liquid Water (CLW) | kg/m2 | kg/m2 | kg/m2 | kg/m2 |
| Sea Ice Concentration (SIC) | % | % | % | % |
| Detection of Thin Sea Ice (TSI) | no unit (0 or 1) | % | % | % |
| Brightness Temperature (TB) | K | ― | ― | ― |
| Statistical methods for observed value | ||||
|---|---|---|---|---|
| Daily | Latest 5-day mean | Half-monthly | Monthly | |
| Sea Surface Temperature (SST) | Overwrite with latest data | mean processing | mean processing | mean processing |
| Sea Surface Wind Speed (SSW) | Overwrite with latest data | mean processing | mean processing | mean processing |
| All-weather Sea Surface Wind Speed (ASW) | Overwrite with latest data | mean processing | mean processing | mean processing |
| Land Surface Temperature (LST) | mean processing | mean processing | mean processing | mean processing |
| Snow Depth (SND) | mean processing | mean processing | mean processing | mean processing |
| Soil Moisture Content (SMC) | mean processing | mean processing | mean processing | mean processing |
| Precipitation (PRC) | Overwrite with latest data | mean processing | mean processing | mean processing |
| Total Precipitable Water over Land (PWL) | Overwrite with latest data | mean processing | mean processing | mean processing |
| Integrated Water Vapor (TPW) | Overwrite with latest data | mean processing | mean processing | mean processing |
| Integrated Cloud Liquid Water (CLW) | Overwrite with latest data | mean processing | mean processing | mean processing |
| Sea Ice Concentration (SIC) | mean processing | mean processing | mean processing | mean processing |
| Detection of Thin Sea Ice (TSI) | mean processing | mean processing | mean processing | mean processing |
| Brightness Temperature (TB) | mean processing | mean processing | mean processing | mean processing |
| Units of Anomaly | ||||
|---|---|---|---|---|
| Daily | Latest 5-day mean | Half-monthly | Monthly | |
| Sea Surface Temperature (SST) | ℃ | ℃ | ℃ | ℃ |
| Land Surface Temperature (LST) | ℃ | ℃ | ℃ | ℃ |
| Sea Ice Concentration (SIC) | % | % | % | % |
| Brightness Temperature (TB) | ― | ― | ― | ― |
| Units of Anomaly (%) | ||||
|---|---|---|---|---|
| Daily | Latest 5-day mean | Half-monthly | Monthly | |
| Sea Surface Wind Speed (SSW) | % | % | % | % |
| All-weather Sea Surface Wind Speed (ASW) | % | % | % | % |
| Snow Depth (SND) | % | % | % | % |
| Soil Moisture Content (SMC) | % | % | % | % |
| Precipitation (PRC) | % | % | % | % |
| Total Precipitable Water over Land (PWL) | % | % | % | % |
| Integrated Water Vapor (TPW) | % | % | % | % |
| Integrated Cloud Liquid Water (CLW) | % | % | % | % |
Anomaly (%) : observation value / normal value
| Units of normal value | ||||||
|---|---|---|---|---|---|---|
| Daily | Latest 5-day mean | Half-monthly | Monthly | Period | Use quality flags | |
| Sea Surface Temperature (SST) | ℃ | ℃ | ℃ | ℃ | 2002/10~2011/9(AMSR-E), 2012/10~2023/9(AMSR2) Total 20 years |
only No.0 (normal) |
| Sea Surface Wind Speed (SSW)(Coming soon) | m/s | m/s | m/s | m/s | only No.0 (normal) | |
| All-weather Sea Surface Wind Speed (ASW)(Coming soon) | m/s | m/s | m/s | m/s | ― | |
| Land Surface Temperature (LST) | ℃ | ℃ | ℃ | ℃ | only No.0 (estimate, normal) | |
| Snow Depth (SND)(Coming soon) | cm | cm | cm | cm | only No.1,2,3,4,5,7,32,48 | |
| Soil Moisture Content (SMC) | Volumetric water content in % |
Volumetric water content in % |
Volumetric water content in % |
Volumetric water content in % |
only No.0 (estimate, normal) | |
| Precipitation (PRC)(Coming soon) | mm/h | mm/h | mm/h | mm/h | only No.0,1,2 (Good ocean, Good land, Good coast) | |
| Total Precipitable Water over Land (PWL)(Coming soon) | kg/m2 | kg/m2 | kg/m2 | kg/m2 | only No.0 (normal) | |
| Integrated Water Vapor (TPW) | kg/m2 | kg/m2 | kg/m2 | kg/m2 | only No. 0,1,2 (Clear sky, Cloud, Light rain) | |
| Integrated Cloud Liquid Water (CLW)(Coming soon) | kg/m2 | kg/m2 | kg/m2 | kg/m2 | only No. 0,1,2 (Clear sky, Cloud, Light rain) | |
| Sea Ice Concentration (SIC) | % | % | % | % | only No.0 (normal) | |
| Brightness Temperature (TB)(Coming soon) | ― | ― | ― | ― | ― | |
- * Please note that there are no normal values for thin ice area detection, and therefore no deviations or comparisons to the mean.
- * For more information on quality flags, see:
-
Standard products : Please see Table 4.2-6 here.
Research products : "Data quality flag" in each product overview table in the AMSR series web data catalog
- ・ How to create normal value :
-
Monthly normal value : Using observational data spanning a total of 20 years, monthly mean values (for 240 months) were calculated, and then the 20-year average for each month was used to determine the "monthly climate value" for each month.
Daily normal value : We assumed the value for the 15th of each month to be the monthly climate value, and defined the linear interpolation value for each day in between as the "daily climate value".
▶Flow diagram is here
Latest 5-days mean normal values : The daily normal value of the mean value over the 5-day mean including the display date
Half-month normal value : Daily climate values averaged over half a month (the first half of the month is from the 1st to the 15th, and the second half is from the 16th to the last day).
3. Main features
| Image layer | Multiple images can be superposed on map (Max. 3 layers). |
|---|---|
| Color scale | Maximum and minimum values can be customized. |
| Save map image (Global only) | A displayed map image can be saved as PNG file. |
| Time series graph (Global only) | A time series graph at any point on map can be created and be saved as image file. Graph data is available for registered users. (Excluding brightness temperature) |
| Slide show (Global only) | Consecutive frame images for 14 days can be automatically replayed(Max. 1 layer). |
| Auxiliary information |
|
4. Operation

4.1 Map navigation
- Zoom in and zoom out
- The map can be enlarged or reduced using the zoom-in button, zoom-out button, and zoom slider in the upper left. You can also use the scroll buttons on your mouse. At any place, scroll the mouse when the cursor is "
 ".
". - Moving map range with mouse
- To move the displayed map range, click the right or left mouse button at any point on the map and drag it to where you want it.
- Specifying the map center point and zoom level
- You can jump to any point on the map with a specified zoom level. Enter the latitude, longitude, and zoom level at the "Map center & Zoom level" menu on the control panel and then press the [Show Image] button.
- Saving map display settings
- Click the [Save Location] button to save the map display settings. The next time you browse, AMSR Viewer will automatically restart with the saved map settings.
Browser cookies are used to save the map display settings. Please note that if you delete the cookies, the AMSR Viewer will not be displayed again automatically. To delete the map display settings saved in the cookies, click the [Clear Location] button. - Unobserved and Missing region display
- Unobserved and missing regions can be recognized by the setting the [Display/No Display] button on the upper left panel to [Display]. This cannot be selected if the Arctic or Antarctic is being projected.
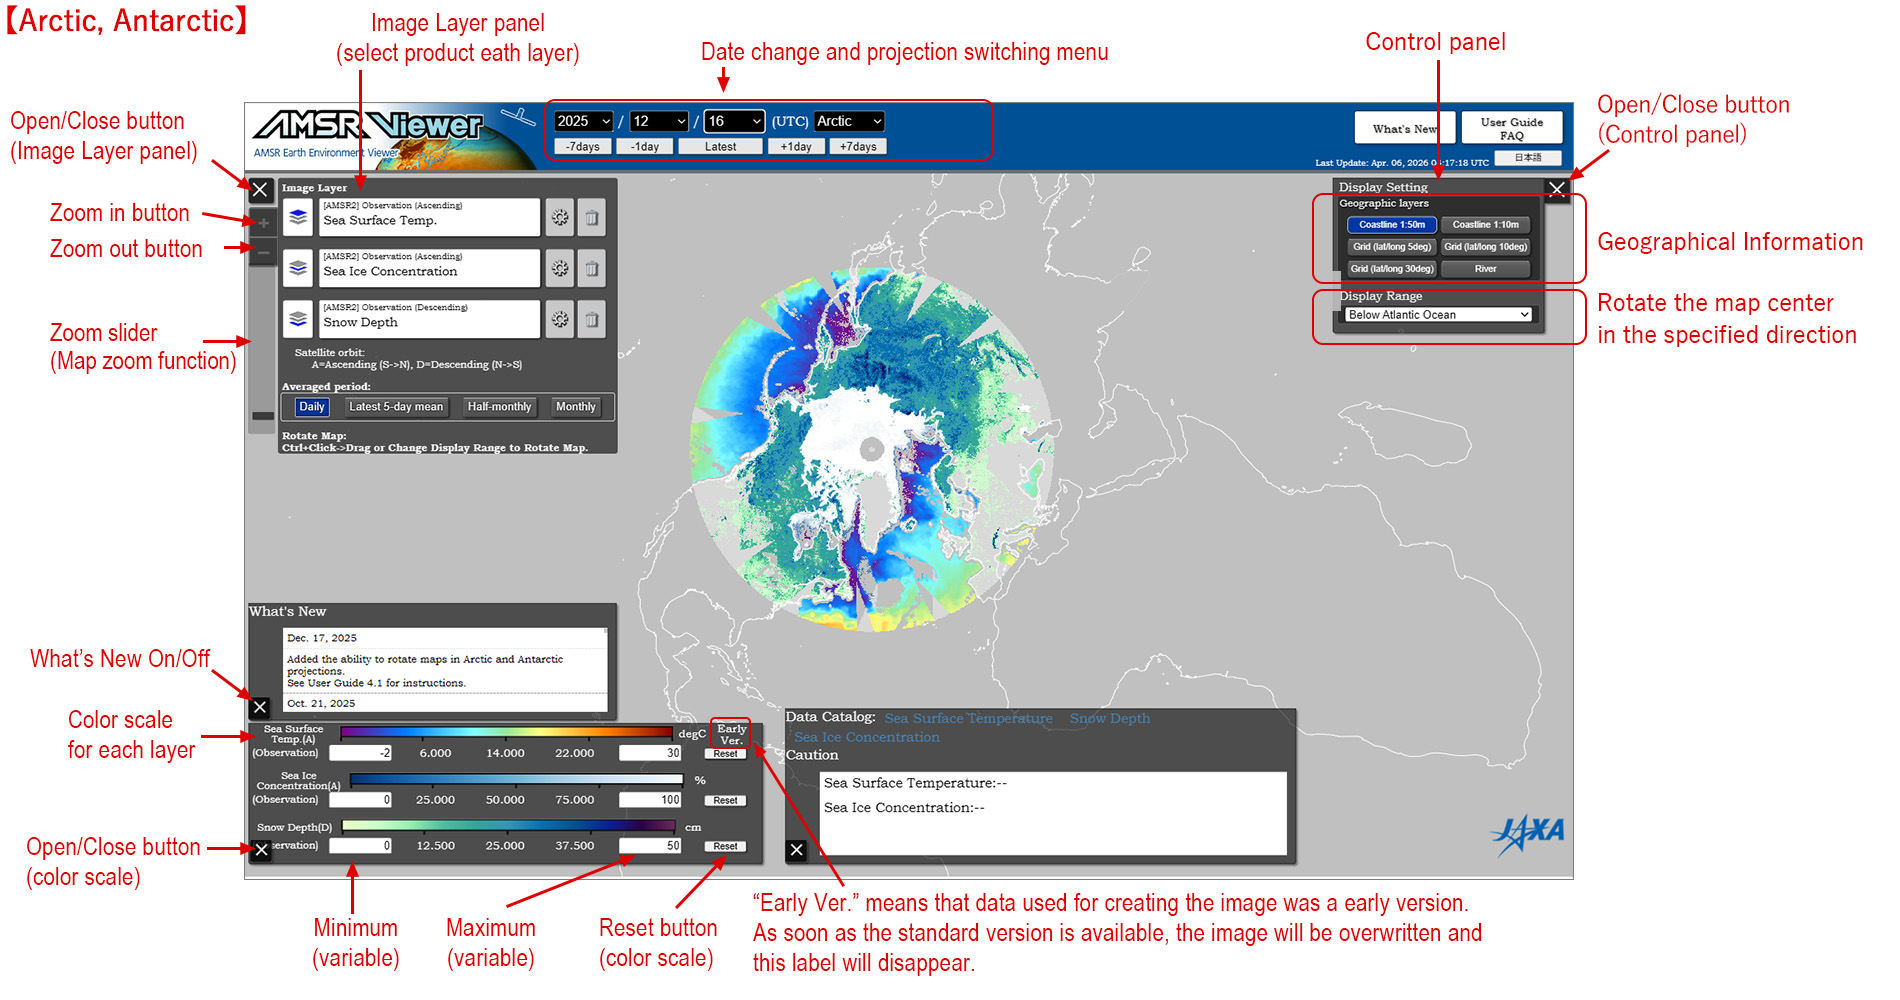
- Rotate Map(Arctic,Antarctic only)
- Ctrl+Click -> Drag or Change Display Range to Rotate Map.
4.2 Display date, projection switching and slide show
- Specifying display date
- The date of the image displayed on map can be changed at the "Display date, projection switching and slideshow" menu at the top of the page. Enter a date and click the [Show image] button. If you press [-7 days] [-1 day] [+1 day] [+7 days] buttons the date of displayed image will be changed to 7 days ago, 1 day ago, 1 day later, and 7 days later, respectively. If you want to go back to the latest image, press the [Latest] button.
- Projection switching
- The projection range displayed on the map can be selected to be the global, Arctic or Antarctic in the "Date change, projection switching and slide show menu" at the top center. This cannot be selected if the Arctic or Antarctic is being projected.
- Slideshow
- By pressing the [Slideshow] button, you can play back images from 14 days before the specified date continuously. This cannot be selected if the Arctic or Antarctic is being projected.
Notes:
Since the slide show system loads all the images for 14 days at the beginning, it may take some time after the button is pressed until playback starts.
4.3 Specifying image layer
AMSR Viewer shows the images of the same day observation, anomaly (or anomaly (%)), and normal value up to 3 layers. The images displayed on the map are listed in the image layer panel in the upper left of the map.
The image label in the panel is the name of the data displayed on the map. The symbols (A) and (D) indicate the direction of the satellite orbit. (A) is the ascending orbit when the satellite is going from south to north, and (D) is the descending orbit when the satellite is going from north to south. (A) is daytime observation (local sun time 1:30pm +/-15minutes at the equator), and (D) is nighttime observation (local sun time 1:30am +/-15minutes at the equator). Even with the same data, there are a few types of images - (A) , (D) ,(A+D), anomaly (or anomaly (%)) and normal value - and it is also possible to display them in an overlapping manner at the same time.
To change the map image for each layer, press the product select button next to the right of the image label. This opens the product list menu. First, select the observation or statistical data. Second, select the satellite orbit direction and then select the product to display on the map. And also, select the [daily], [Latest 5-day mean], [Half-monthly], and [Monthly] button to change the average cycle.
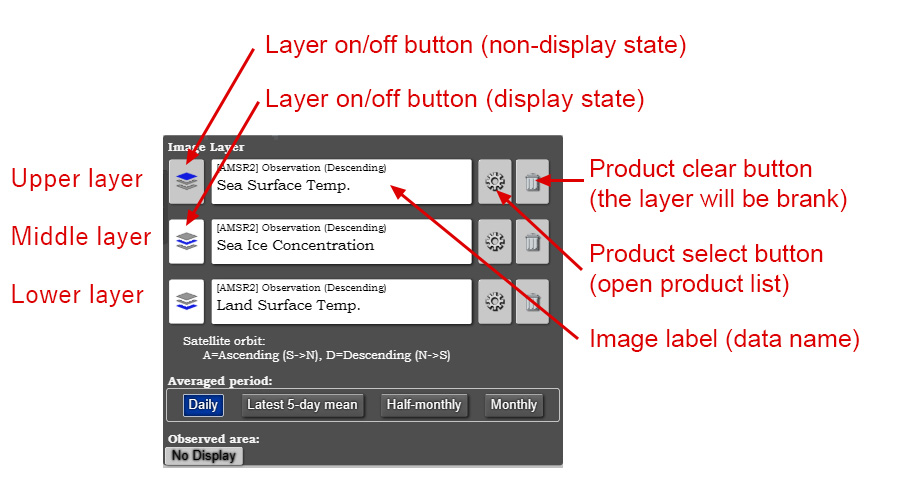
Screen Layer Panel
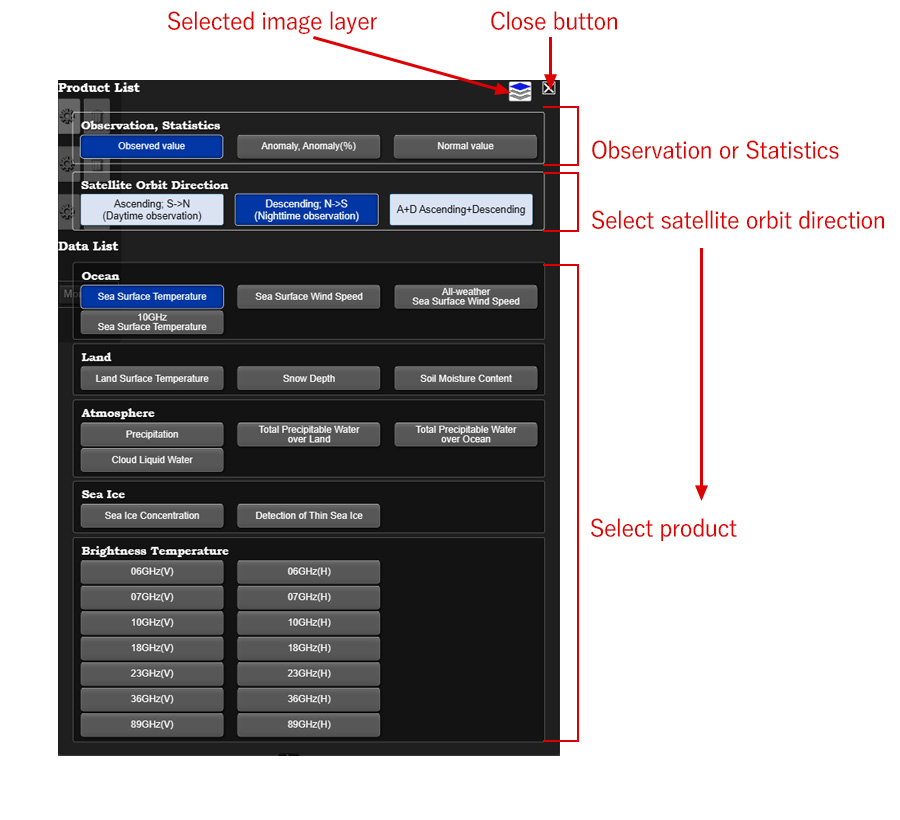
Product List
4.4 Custom map display setting
You can customize the AMSR Viewer using the "Display Settings" menu on the control panel.
- Overlayer opacity (Global only)
- You can change the opacity of image layers by the slider. As you move the slider to the left, the image layers become transparent and the basemap becomes visible.
- Basemap (Global only)
- Three types of basemap are available for the background image:
- Blank map (only coastal line)
- Blue-Marble (NASA)
- GSI Map (GSI)
Notes:
Selecting the "GSI Map (GSI)" disables the [Download (PNG Image)] button for saving a map image. To activate the button again, refresh the map by pressing the reload button on your browser. - Overlay cloud image (Global only)
- A cloud image can be overlaid on the map by setting the [On/Off] button on the control panel to [On]. Select the time you want to display from the "Cloud Image" menu on the control panel. Cloud images are every hour. The cloud image of the date specified in the map is displayed.
- Geographic layers
- There are four geographic layers available;
- Coastline 1:50m
- Coastline 1:10m
- Grid (Lat/Long 5deg, 10deg, 30deg)
- River
Notes:
Normally, "Coastline 1:50m" is used. Since the data size of "Coastline 1:10m" and "River" is large, it takes some time to display. - Color scale
- The color scale of each layer is located at the lower left of the map. The maximum and minimum values of the color scale can be changed freely. To restore the maximum and minimum values, press the [Reset] button.
Notes:
The minimum and maximum of the precipitation color scale cannot be changed.
4.5 Save map image(Global only)
The image displayed on the AMSR Viewer can be downloaded in PNG format. Click the [Map Image] button in the "Create/Save" menu on the control panel. Please read the terms of use carefully before using saved images.
Notes:
Selecting the "GSI Map (GSI)" disables the [Download (PNG Image)] button for saving a map image. To activate the button again, refresh the map by pressing the reload button on your browser.
Selecting the "GSI Map (GSI)" disables the [Download (PNG Image)] button for saving a map image. To activate the button again, refresh the map by pressing the reload button on your browser.
Notes:
The layout of saved images may be broken in Firefox and Chrome. If it is broken, please use IE or Edge.
The layout of saved images may be broken in Firefox and Chrome. If it is broken, please use IE or Edge.
4.6 Create/Save time series graph(Global only)
You can create a time series graph at any point on the map. The graph can be saved as an image file in PNG, JPEG, PDF, or SVG format. The displayable graph period is about one year before the specified date (exactly 367 days, including the specified date). In addition, registered users can download the data used in the time series graph.
Please read the terms of use carefully before using saved images and data.
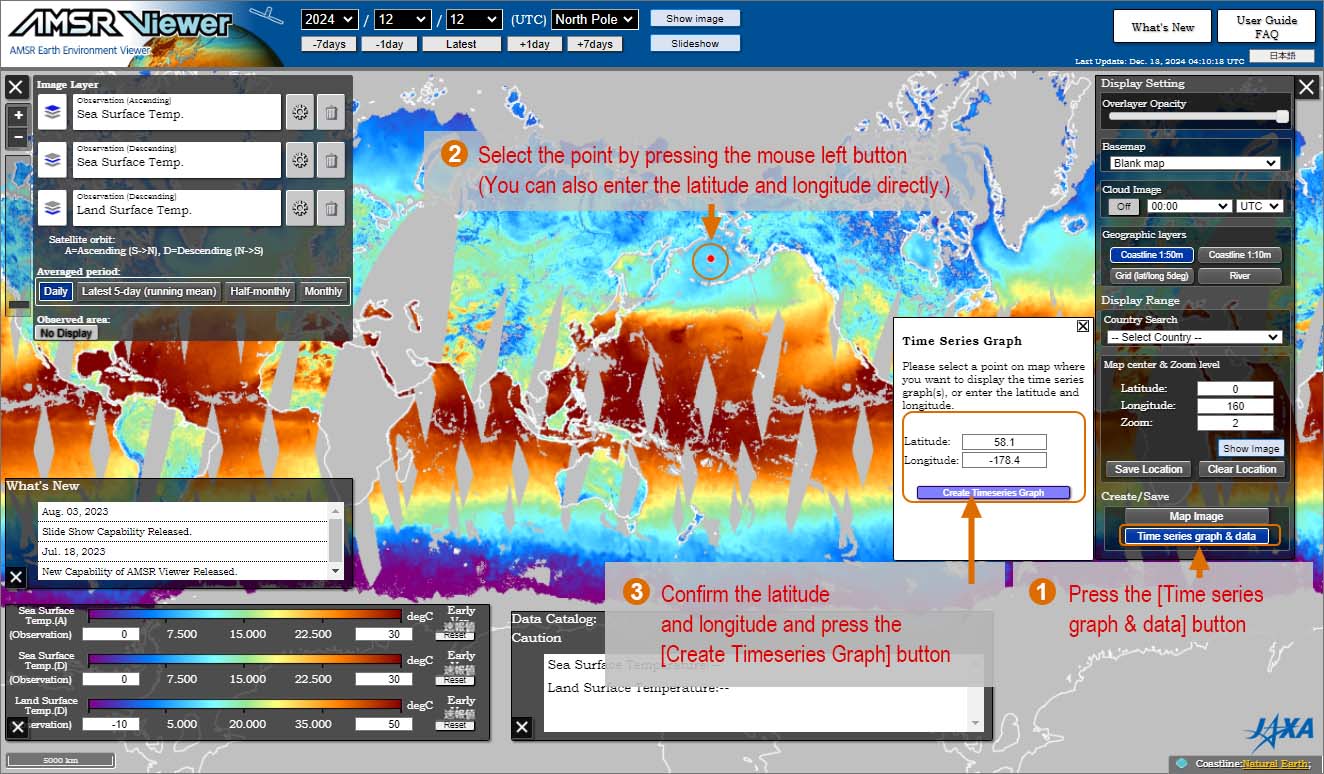
- Create time series graph
- Follow the steps below to create the time series graph;
- Press the [Time series graph & data] button in the "Create/Save" menu on the control panel.
- Select the point on the map where you want to create the graph with the mouse.
- Confirm that the latitude and longitude are indicated in the sub menu and click the [Create Time series Graph] button. You can also enter the latitude and longitude directly in the sub menu.
- Time series graph window
- When multiple layers are selected in the "Image Layer" panel, a graph as shown below is created for each geophysical data in the layers. Please use the scroll function of your browser.
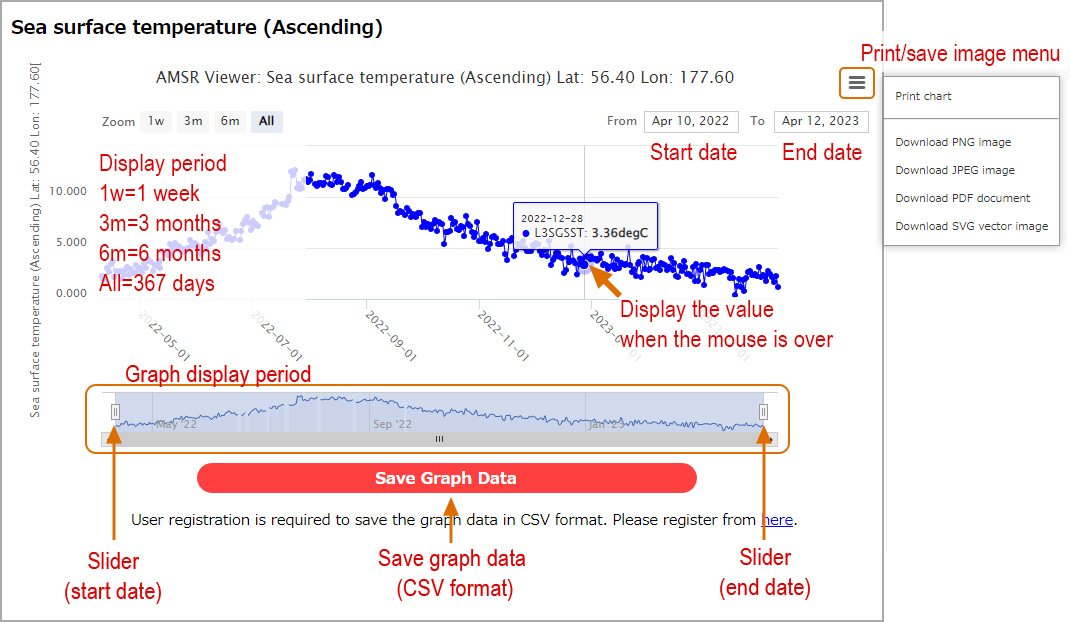
- Graph display time range
- Move the slider below the graph to change the graph display period.
- Print time series graph and save image
- From the menu on the upper right, you can print the graph and save the graph image.
- Save time series graph data
- Click the [Save Graph Data] button below each graph to save the data of the displayed graph period in CSV format. User registration is required to save files in CSV format.
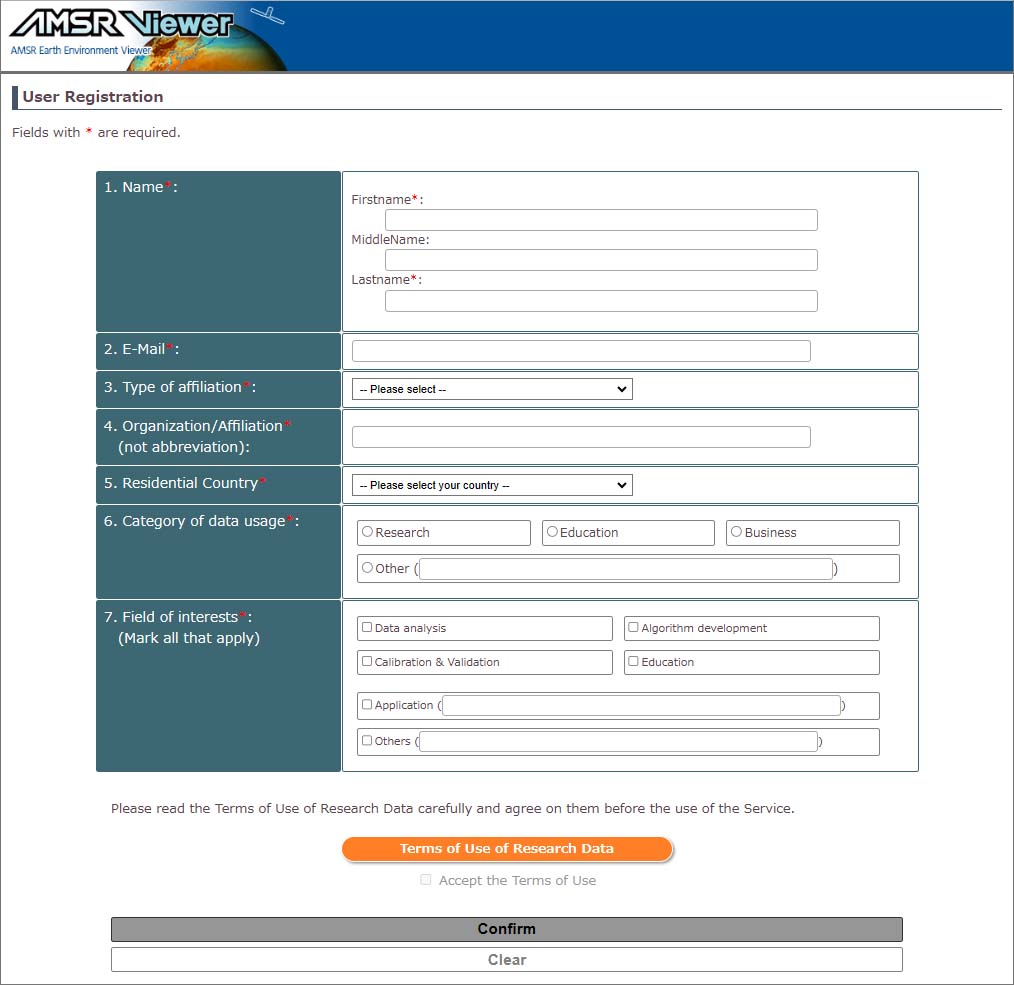
- User Registration
- User registration is required to save graph data in CSV format. Please fill in the required information here, press the button below the input form, read the "Terms of Use of Research Data - Space Technology Directorate I", and then check the consent box to enable the [Confirm] button. On the next screen, check the entered information and click the [Send] button. A confirmation email will be sent to the registered email address. Please access the URL in the text and press the [Confirm] button to complete registration.
5. Displayed images and their data sources
- The map image of basemap uses GSI-map by Geospatial Information Authority of Japan.
- The satellite image of basemap uses NASA Blue Marble.
- Cloud images use Globally-merged, full-resolution (~4km) IR Data, produced by NOAA Climate Prediction Center (CPC). Data use infrared (IR) information observed by geostationary satellites, including the Himawari satellite by the Japan Meteorological Agency (JMA), the GOES satellites by the U.S. National Oceanic and Atmospheric Administration (NOAA), and the Meteosat satellites by the European Meteorological Satellites Organization (EUMETSAT). Those data are provided through the NASA/GSFC Precipitation Processing System (PPS)
- Some cloud images may be lost due to delays in the delivery of cloud data from geostationary satellites and the operational status of the satellites.
- Coastlines, latitude/longitude lines, and river channels are provided by Natural Earth.
- The country search uses GADM data.
6. Special notes
- Please confirm the terms of use before using this site.
- Although JAXA/EORC has taken every care to manage the current site, JAXA assumes no responsibility for the safety of the contents of the Site or the reliability of information provided on the Site. JAXA is not responsible for any damage that may be caused by the use of the Site or the information on the Site.
- Anyone wishing to publish results using data from the AMSR Viewer should clearly acknowledge the ownership of the data in the publication (for example, 'AMSR Viewer by Japan Aerospace Exploration Agency').
- Please contact the JAXA/EORC AMSR Office in advance if you want to distribute images or data from this site to many people, such as in a pamphlet or internet. Also, please check the terms of use for details from here.
- Please send the preprint and/or reprint of publications to JAXA/EORC AMSR Office. We would appreciate receiving the relevant publications in which you utilize our data.
7. Contact information
Please contact us at the JAXA/EORC AMSR Office if you have any questions or comments.
- JAXA/EORC AMSR Office
- Earth Observation Research Center (EORC)
Japan Aerospace Exploration Agency (JAXA)
2-1-1 Sengen, Tsukuba-shi, Ibaraki 305-8505, JAPAN
JAXA/EORC AMSR Office
E-mail: