Seen from Space 2015
El Niño phenomenon being close to the strongest on record
El Niño phenomenon has been strengthened in this summer and now is close to that in 1997/98 which has recorded the strongest El Niño since 1950. The Japan Meteorological Agency (JMA) reported on November 10, 2015 that sea surface temperature anomaly from average level in the El Niño monitoring region in October recorded +2.7 degree Celsius, and this is the second-warmest values after 1997.
"El Niño" usually indicates the phenomenon that sea surface temperature in the central and eastern equatorial Pacific Ocean, where usually shows low sea surface temperature, increases dues to weakening of trade winds in equator. Although El Niño and La Niña, which is known as an opposite phenomenon of El Niño, occur over the open ocean, satellite observation can clearly capture their status from beginning to termination. Especially, microwave radiometer can observe sea surface temperature through the clouds, and enables frequent observations of sea surface temperature over the tropical ocean where large convective system develops. Figure 1 shows sea surface temperature over the tropical Indian and Pacific Oceans during November 21-25, 2015, observed by the Advanced Microwave Scanning Radiometer 2 (AMSR2) on board the JAXA's Global Change Observation Mission – Water (GCOM-W or "SHIZUKU"). Rectangles within the figure indicate the monitoring regions related to El Niño phenomena. It is difficult to see whether sea surface temperature is high or low only from this figure, so Figure 2 indicates sea surface temperature differences from climatological values (anomaly) for the same period. Light blue and green colors indicate temperature is almost normal status, and red and blue colors indicate warmer and colder temperature than normal status respectively. You can see sea surface temperature over the central and eastern equatorial Pacific Ocean shows almost 3 degree Celsius higher than normal year. Figure 3 shows temporal variation of sea surface temperature anomaly averaged over the El Niño monitoring region-3 (NINO.3) since 2002.


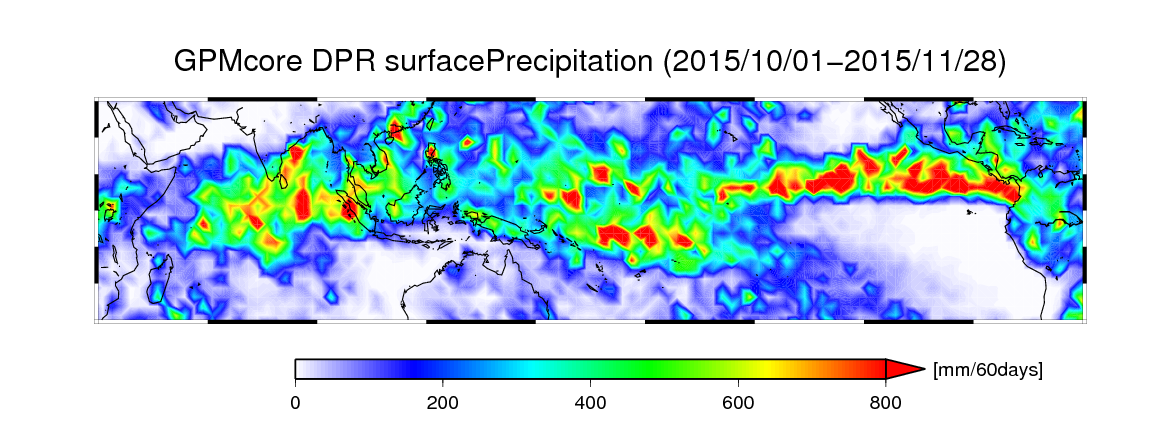
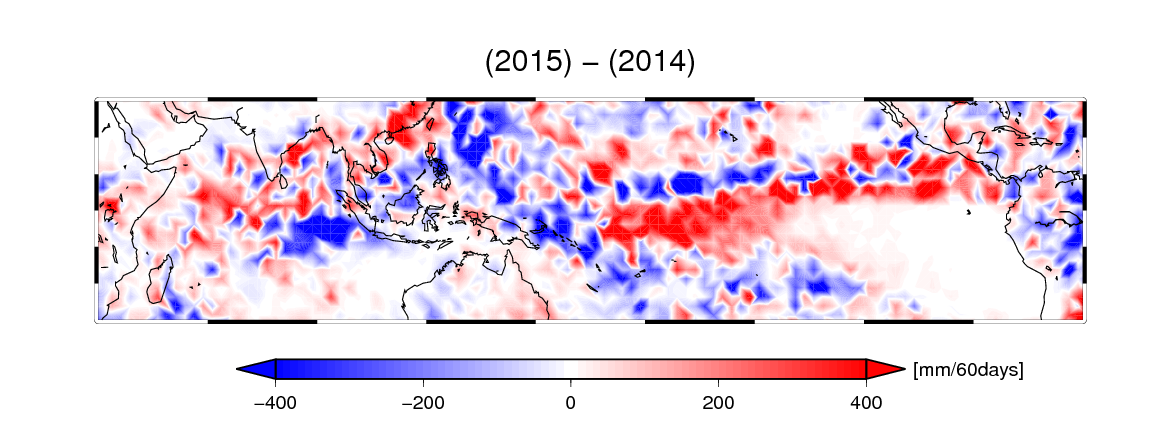
When El Niño phenomena alter the distribution of sea surface temperature, locations of strong convective systems in tropics, and consequently, atmospheric circulation and rainfall distribution are changed. Figure 4 shows accumulated surface precipitation distribution, observed by the Dual-frequency Precipitation Radar (DPR) on board the US-Japan joint Global Precipitation Measurement (GPM) Core Observatory, from t October 1 to November 28, 2015 for the same area as Figure 1. You may find heavy precipitation in tropics corresponding to the area of warmer sea surface temperature in Figure 1. On another front, Figure 5 shows differences of surface precipitation between 2015 and 2014 for the same period. Red color indicates more precipitation in 2015 than 2014, and blue color indicates less precipitation. Precipitation over the central and eastern equatorial Pacific Ocean is increasing in wider areas in corresponding to strong El Niño status in 2015, whereas precipitation over the Maritime Continents around Indonesia is extremely decreasing. Usually, changes of atmospheric and oceanic conditions may cause abnormal weather. Since July 2015, Indonesia experiences serious and continuous wild fires, which is said as the worst in the record. In normal year, fires by broadcast burning die down by rainy season, but onset of this year's rainy season was delayed and there are droughts caused by El Niño.
At the last of this article, we would like to show you how sea surface temperature over the tropical ocean varies when El Niño phenomenon occurs by using movie of AMSR2 observation since its launch. Figure 6 shows animation of sea surface temperature anomaly observed by AMSR2 from July 24, 2012 to November 23, 2015. In July 2012, warmer temperature region over the eastern equatorial Pacific Ocean is not so wide. For a while after that, sea surface temperature over that region shows colder status. Since April 2014, warmer sea surface temperature regions have broadened in the eastern equatorial Pacific Ocean, and El Niño occurred in the summer of 2014. The status of warmer sea surface temperature has been strengthened since this summer, and now it shows strong El Niño status. Normally, the strongest status of El Niño is often recorded in northern winter. JMA predicts that this El Niño status will be maximized in the early winter. We should continue to monitor the status of this year's El Niño if it will be the strongest one on record.
Figure 6. Animation of 5-day averaged sea surface temperature anomaly from July 24, 2012 to November 23, 2015, observed by GCOM-W/AMSR2.
Explanation of the Images
![]()
Figs.1-2,6
| Satellite | Global Change Observation Mission – Water "SHIZUKU" (GCOM-W) |
|---|---|
| Sensor | Advanced Microwave Scanning Radiometer 2 (AMSR2) |
| Date | November 21-25, 2015 (Figs 1-2), July 24, 2012 – November 23, 2015 (Fig 6) |
Fig.3
| Satellite | EOS-Aqua, Coriolis, Global Change Observation Mission – Water "SHIZUKU" (GCOM-W) |
|---|---|
| Sensor | Advanced Microwave Scanning Radiometer for EOS (AMSR-E), Windsat, Advanced Microwave Scanning Radiometer 2 (AMSR2) |
| Date | July 2002 – November 2015 |
Figs.4-5
| Satellite | Global Precipitation Measurement (GPM) Core Observatory |
|---|---|
| Sensor | Dual-frequency Precipitation Radar (DPR) |
| Date | October 1 – November 28, 2015 (Figs.4-5), October 1 - November 30, 2014 (Fig.5) |


