Seen from Space 2011
Significant retreats of huge glaciers in Patagonia, South America (Part 4)
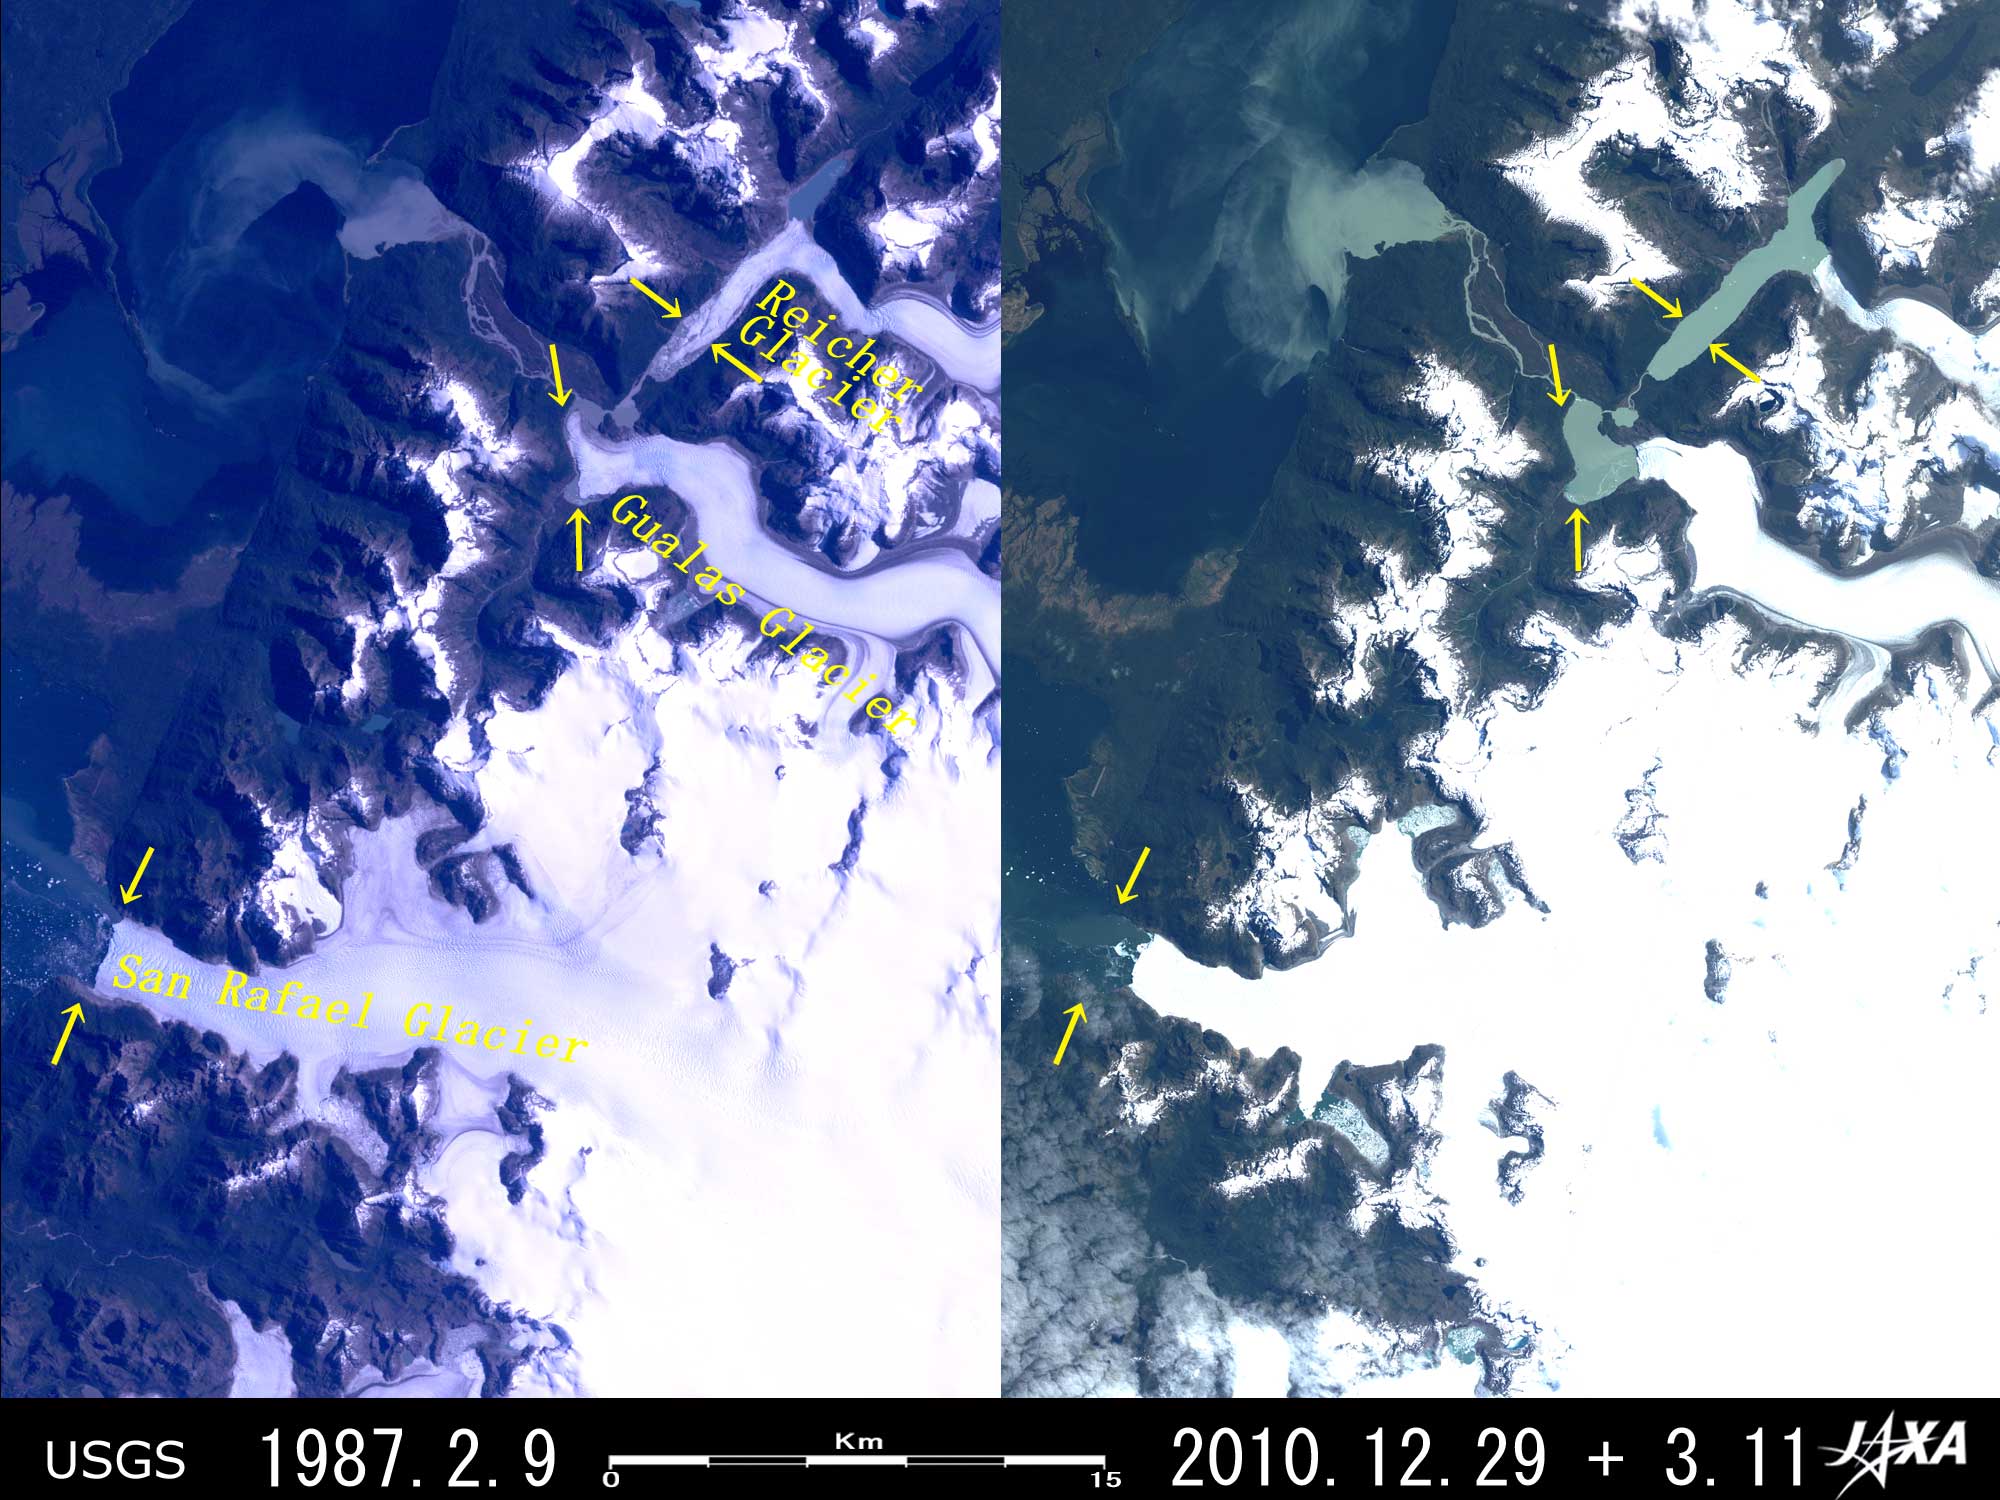  Fig. 1. Retreat of Reicher Glacier
Figure 1 depicts the Reicher Glacier, Gualas Glacier and San Rafael Glacier flowing out from the Northern Patagonian Ice Field to the northwest or to the north in southern Chile, South America. The left image of Fig. 1 was observed by the USA’s Landsat 5 in 1987, and the right one by Japan’s Advanced Land Observing Satellite "Daichi" in 2010. The yellow arrows indicate the positions of the terminuses of these glaciers in 1987. The lower reaches of Reicher Glacier were sharply bent like the letter “L” in 1987, but the terminus retreated as much as approximately 4.6 km during these 23 years and the whole L-shaped lower reaches were replaced by water surface of the lake. The reference paper (*) reads that the terminus of the glacier retreated 3,550 m during 3 years between 1990/91-1993/94, then it means that it retreated approximately 1 km during the remaining 20 years. When comparing both images, you will find that the terminus of Gualas Glacier retreated approximately 1.8 km and that the water surface of the lake was expanded. The pair of images also indicate that the 1.9 km wide terminus of San Rafael Glacier retreated approximately 900 m. The average recession rate of each glacier is 200 m per year at Reicher, 78 m per year at Gualas and 39 m per year at San Rafael respectively. You can see the 1,000 m long runway of the Lake San Rafael Airport at approximately 5 km north-northwest from the terminus of San Rafael Glacier. 
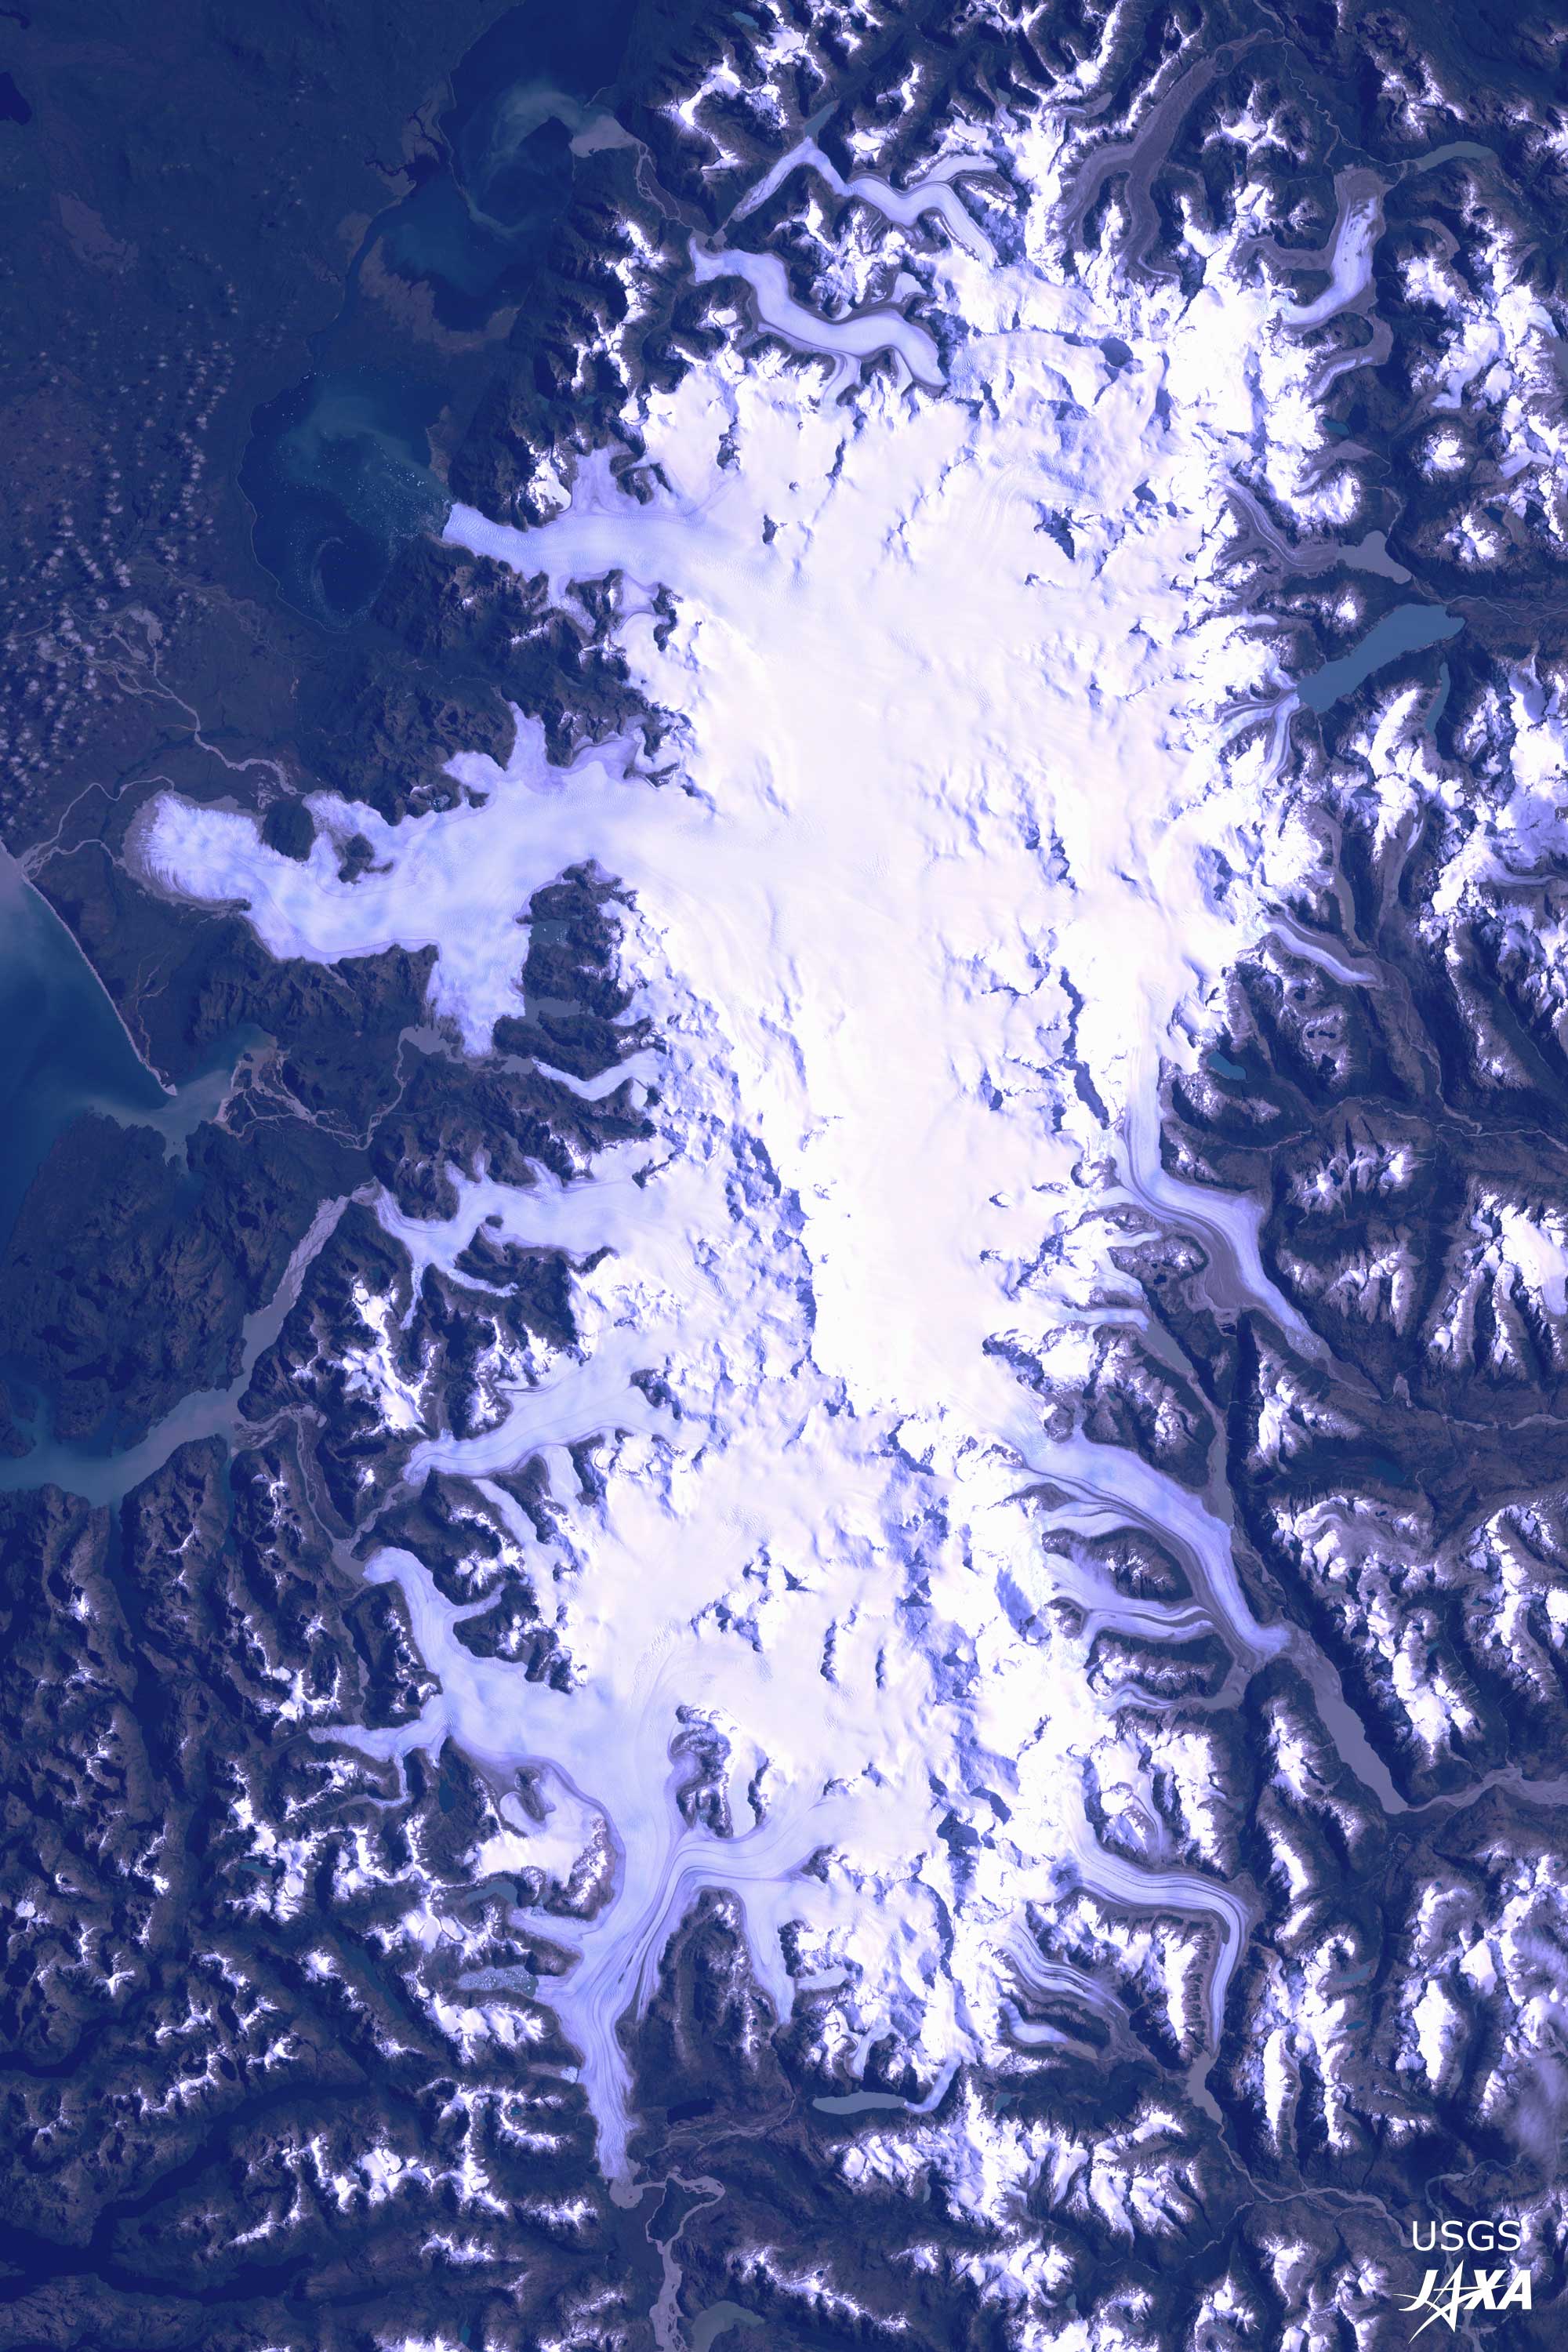
Fig. 2. Wide area image of the Northern Patagonian Ice Field
Northern Patagonian Ice Field (kmz, 9.34 MB, High Resolution) as seen on Google Earth. Figure 2 is a wide area image of the Northern Patagonian Ice Field observed by Landsat-5 in February 1987. The Northern Patagonian Ice Field extends over 40 to 45 km from east to west and 100 km from north to south, located around 47°S 73°30’ W in Chile, South America, and appears white or pale purple in this image. Among many glaciers flowing out from the ice field, the three glaciers in Figure 1 are located in the northwestern side. To the south of these glaciers, you can see San Quintin Glacier that is the largest glacier in the Northern Patagonian Ice Field, extending 3.2 to 5.6 km wide and 50 km long from its source area and looking like a huge salamander. To the south, you can see Benito Glacier, HPN 1, 2 and 3 Glaciers (“HPN” means Northern Patagonian Ice Field in Spanish.) and Steffen Glacier in the southern tip. On the other hand, if seeing the eastern area from north to south, you can find Grosse Glacier, Exploradores Glacier, Soler Glacier, Nef Glacier, Colonia Glacier and Pared Norte Glacier successively. There is Monte San Valentin (3,910 m above sea level) that is the highest mountain in Patagonia. Out of above-mentioned glaciers, all glaciers located in the western area of the Northern Patagonian Ice Field are retreating (cf. Fig. 1, Fig. 3, Fig. 4 and Fig. 5). Concerning the glaciers in the eastern area, we have no comments here because there is no clear data observed by the optical instruments aboard ALOS (Daichi). The advance or retreat of the terminuses of glaciers is commonly used as one of indexes of global warming, however, according to Dr. Renji Naruse, who has been studying glaciers in Patagonia for a long time, such changes of glaciers there do not have direct relations with the climate change. It is because the terminuses of all big glaciers in Patagonia flow into fjords (seawater) or lakes (fresh water), and if the frequent calving of the glacial terminus continues with some reason, or if large icebergs are formed after big collapses of glacier tongues, then it is recognized as the retreat of glacier. 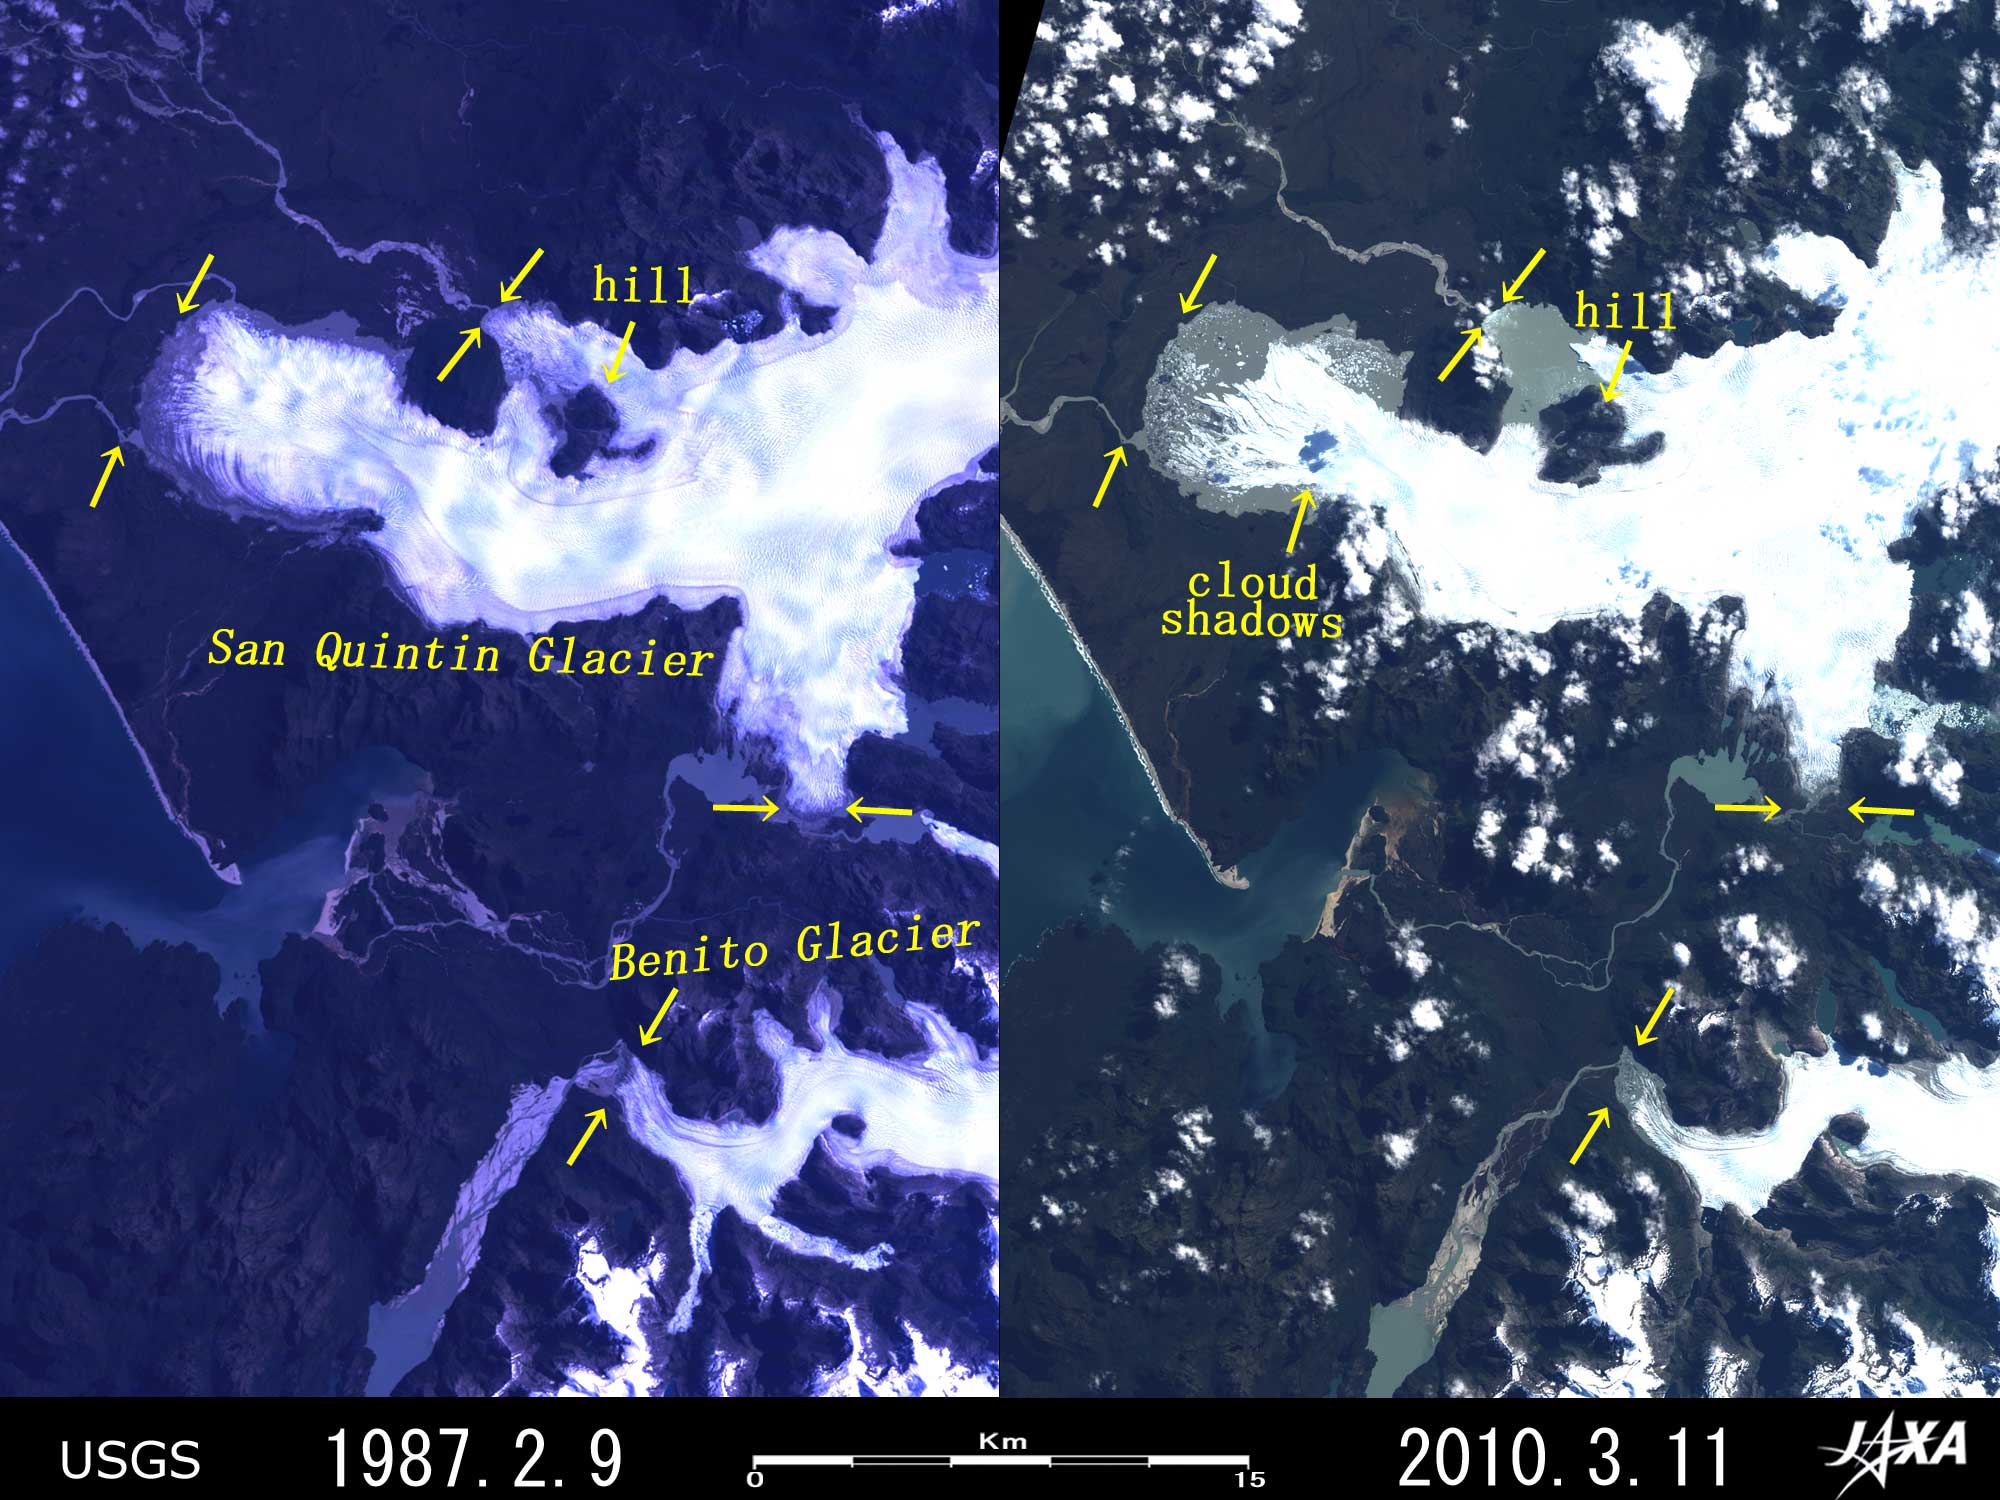 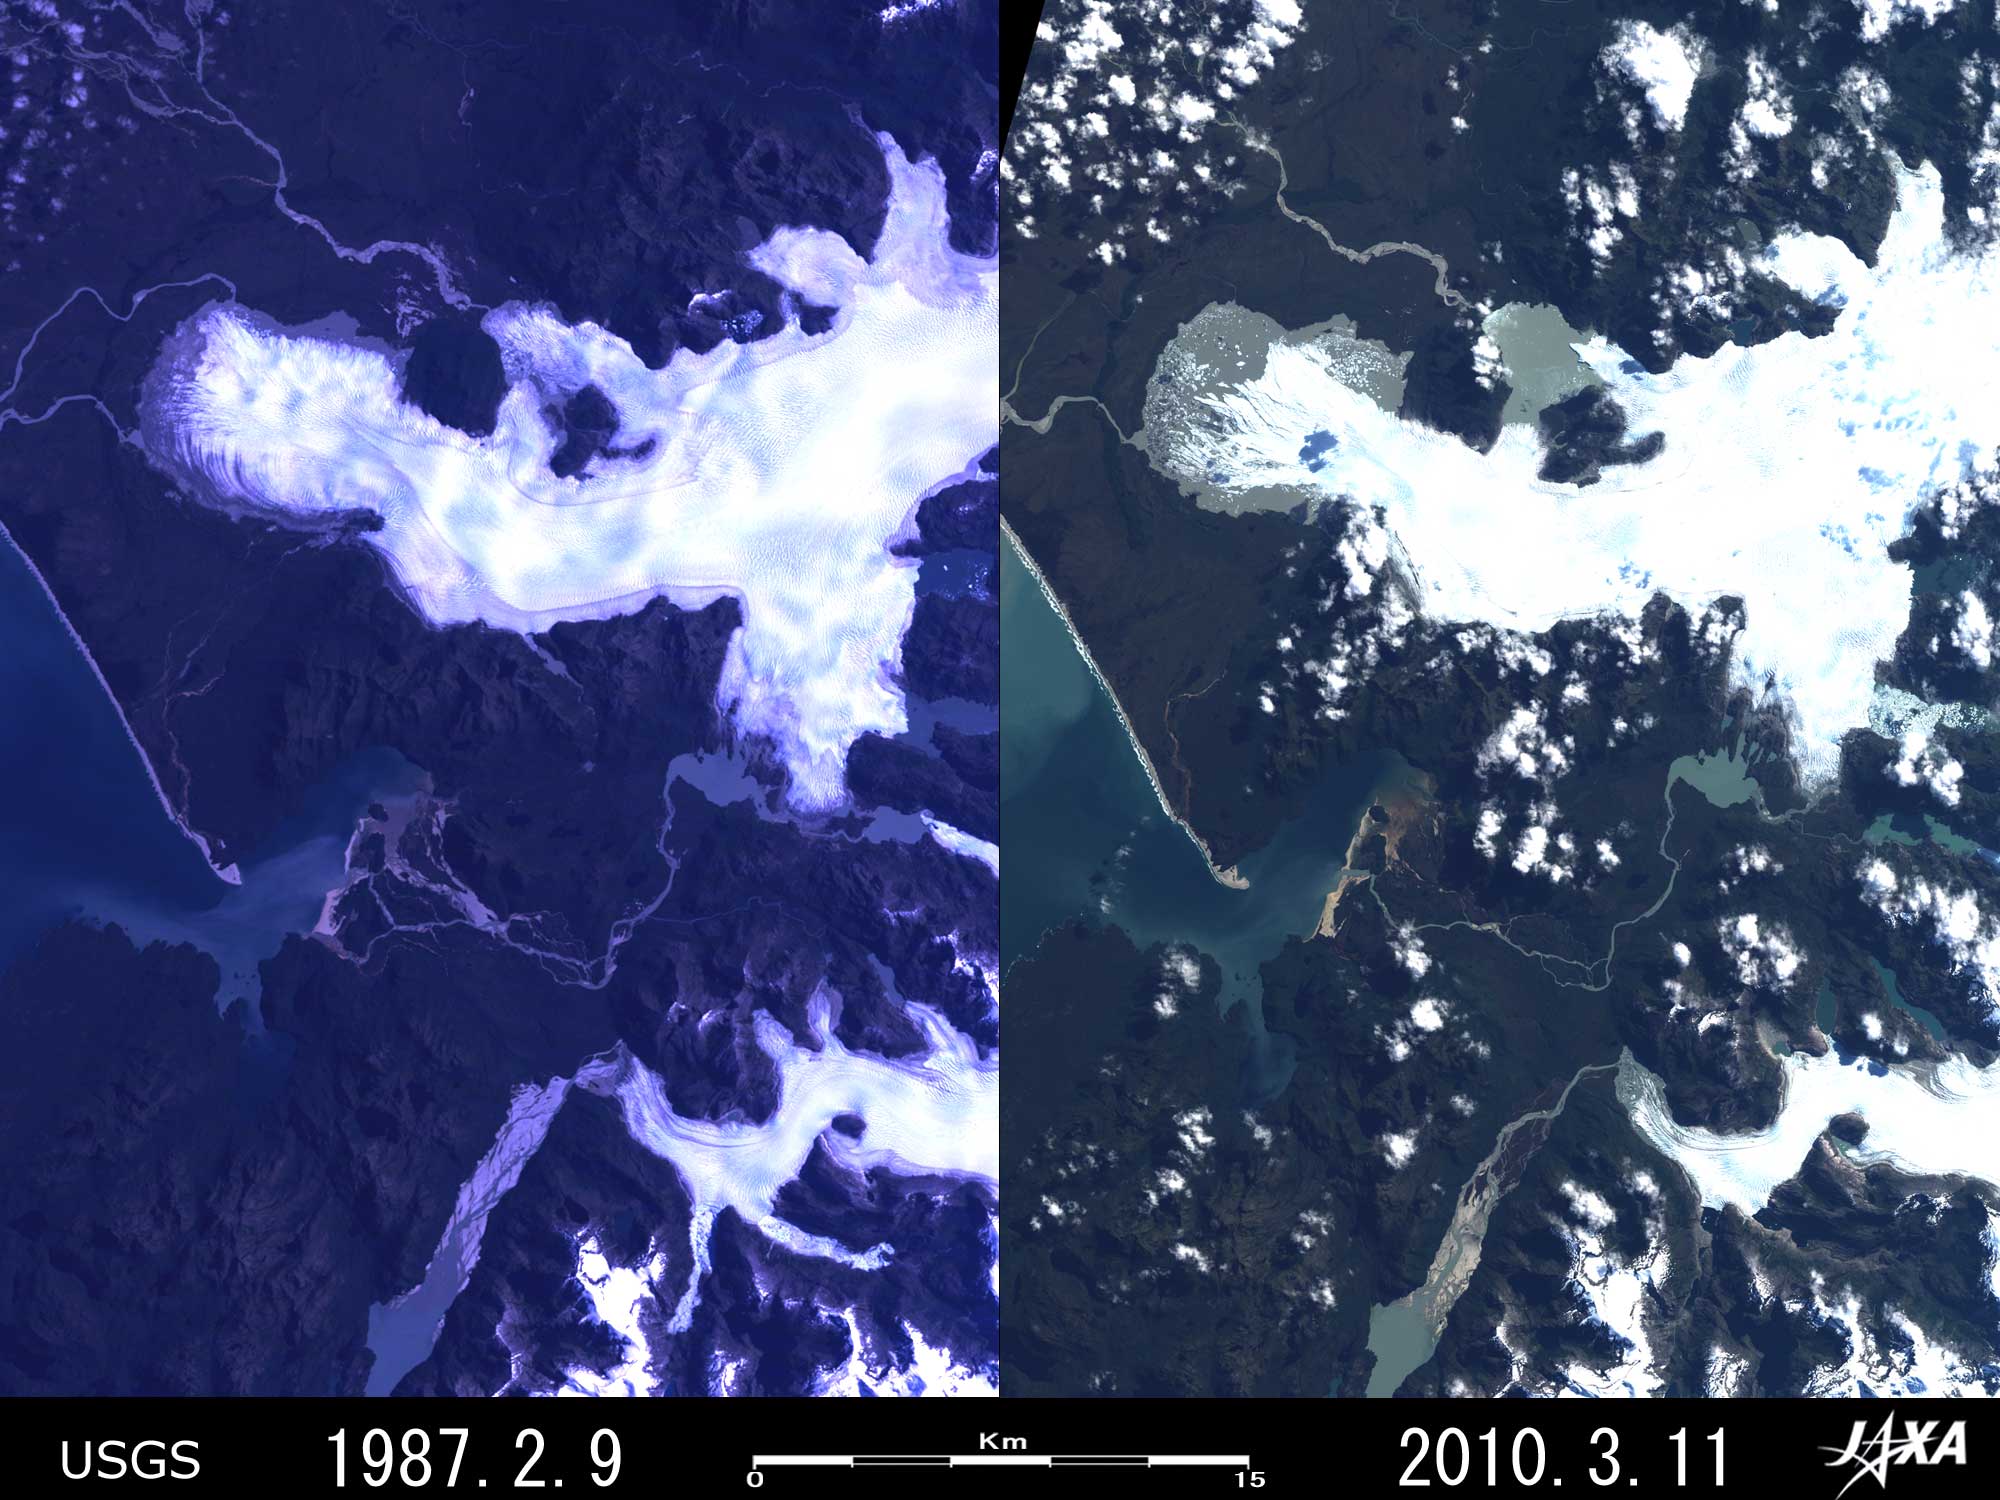 Fig. 3. Retreat of San Quintin Glacier and Benito Glacier
Figure 3 indicates the lower reaches of San Quintin Glacier and Benito Glacier located in the western area of Northern Patagonian Ice Field. If comparing the images in 1987 and in 2010, you can find that the mainstream terminus of San Quintin Glacier retreated 1.5 to 2.8 km during 23 years (65 to 122 m per year on the average) with its shape broken, that the terminus of the northern tongue retreated 2.3 to 3.8 km (100 to 165 m per year on the average) and that the water surface of both lakes increased remarkably. The terminus of the southern tongue retreated 500 to 780 m (22 to 34 m per year on the average) and became lean. The terminus of Benito Glacier retreated approximately 740 m during 23 years (32 m per year on the average). If you watch the mainstream terminus of San Quintin Glacier in the image in 1987, it seems that the terminus looks gray covered with moraine, and reaches the western shore of the lake. Please be careful not to confuse cloud shadows with hills surrounded by glacier, because there are dotted small clouds casting their shadows on the glacier in the image in 2010. 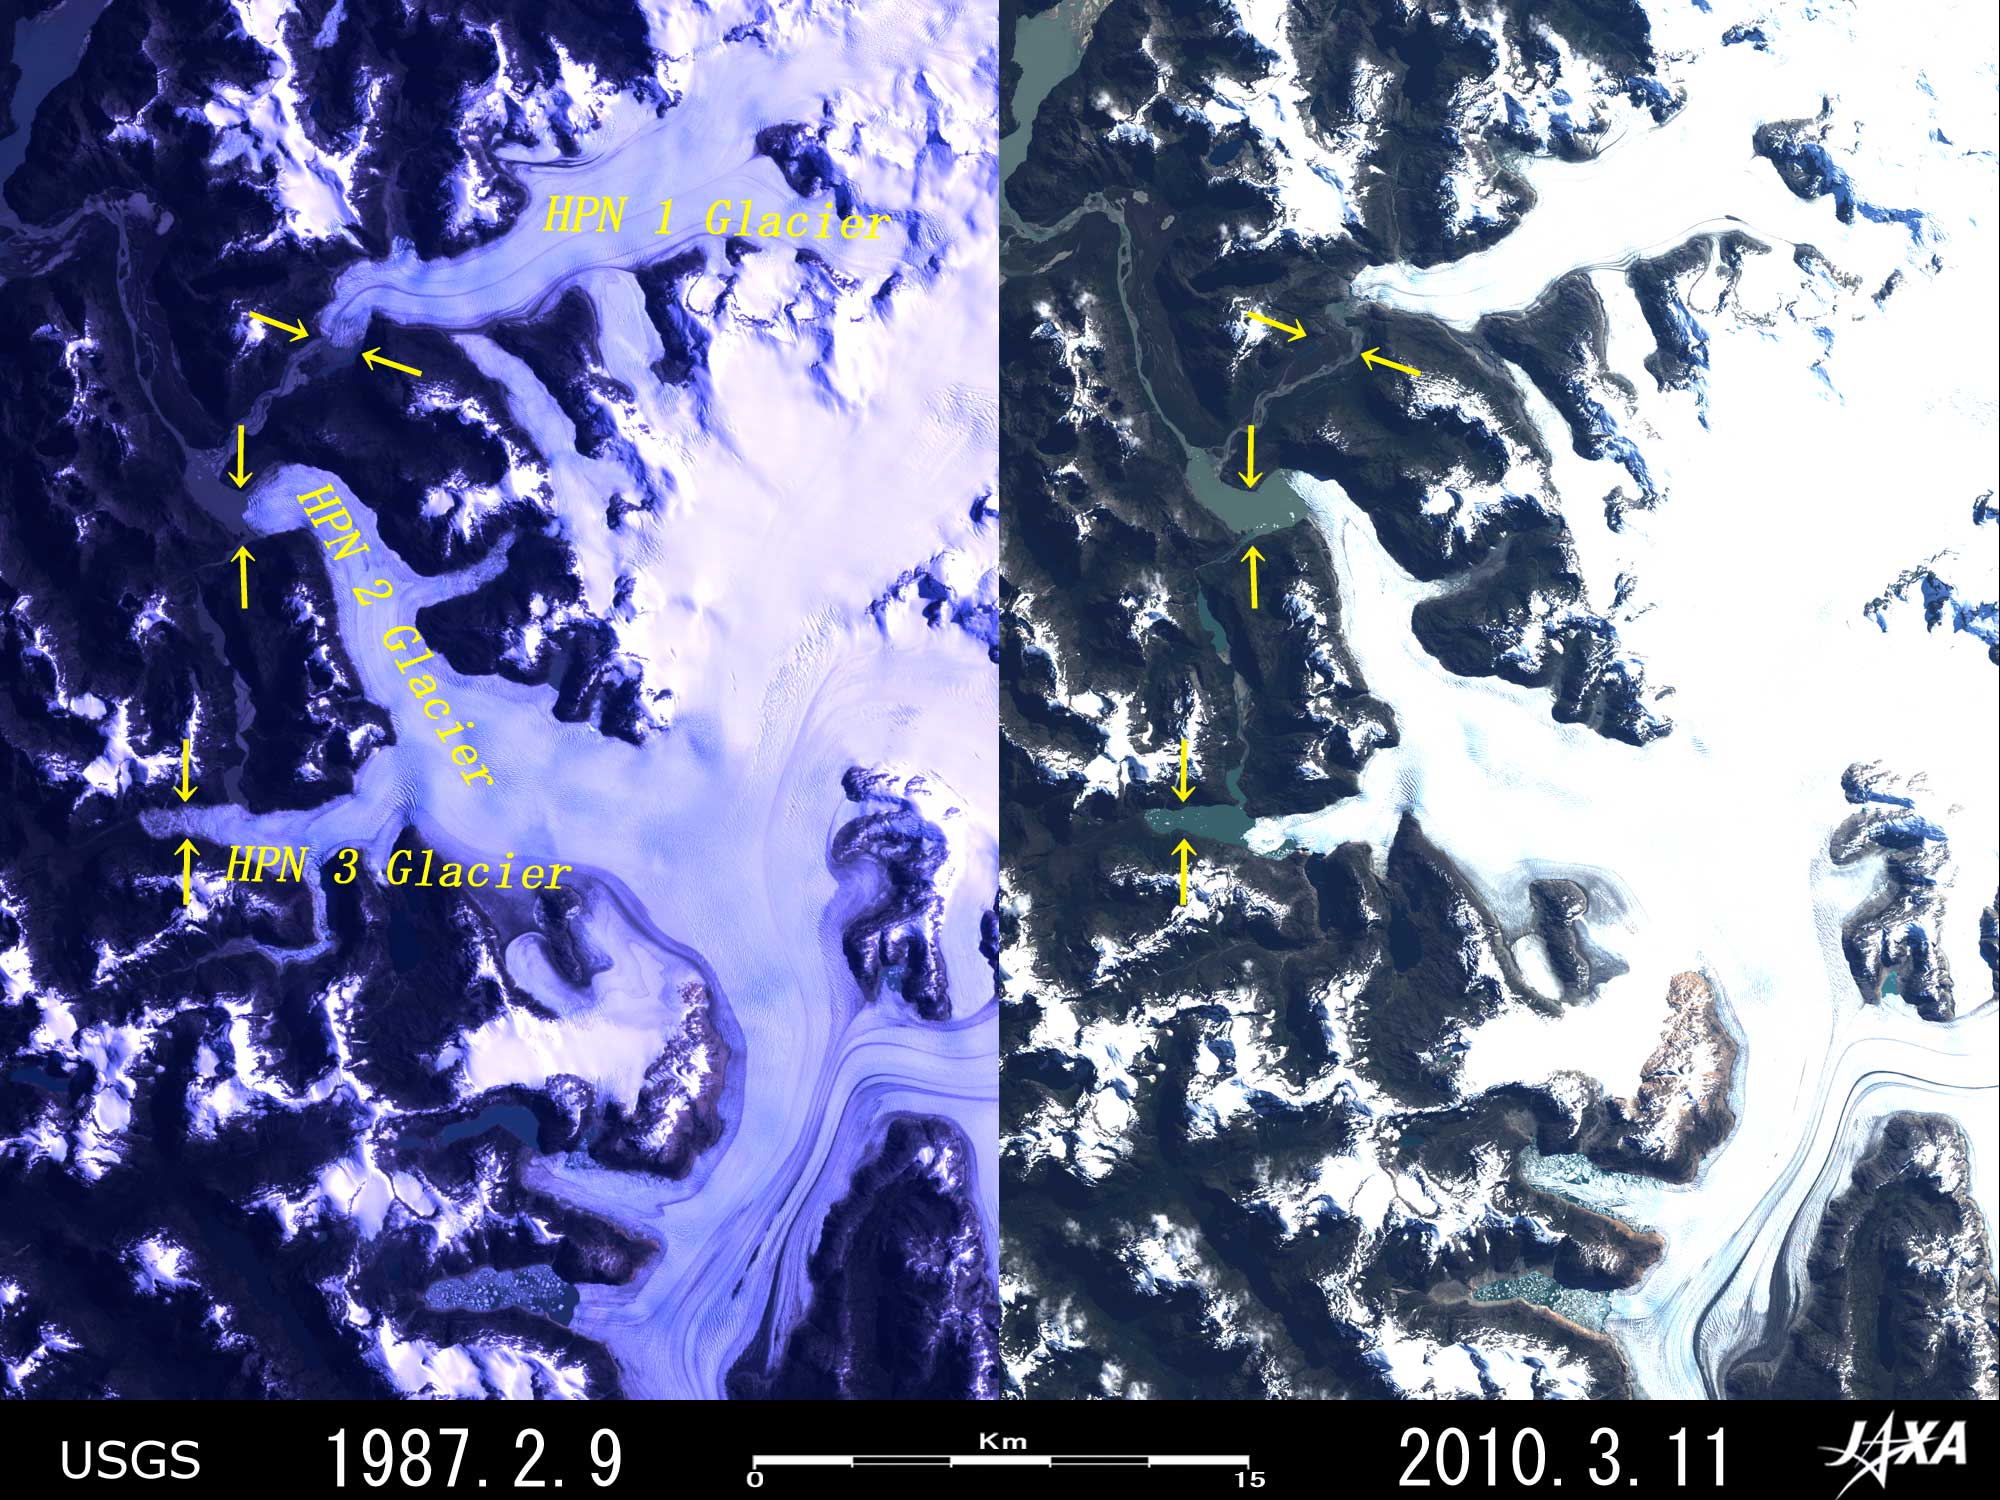 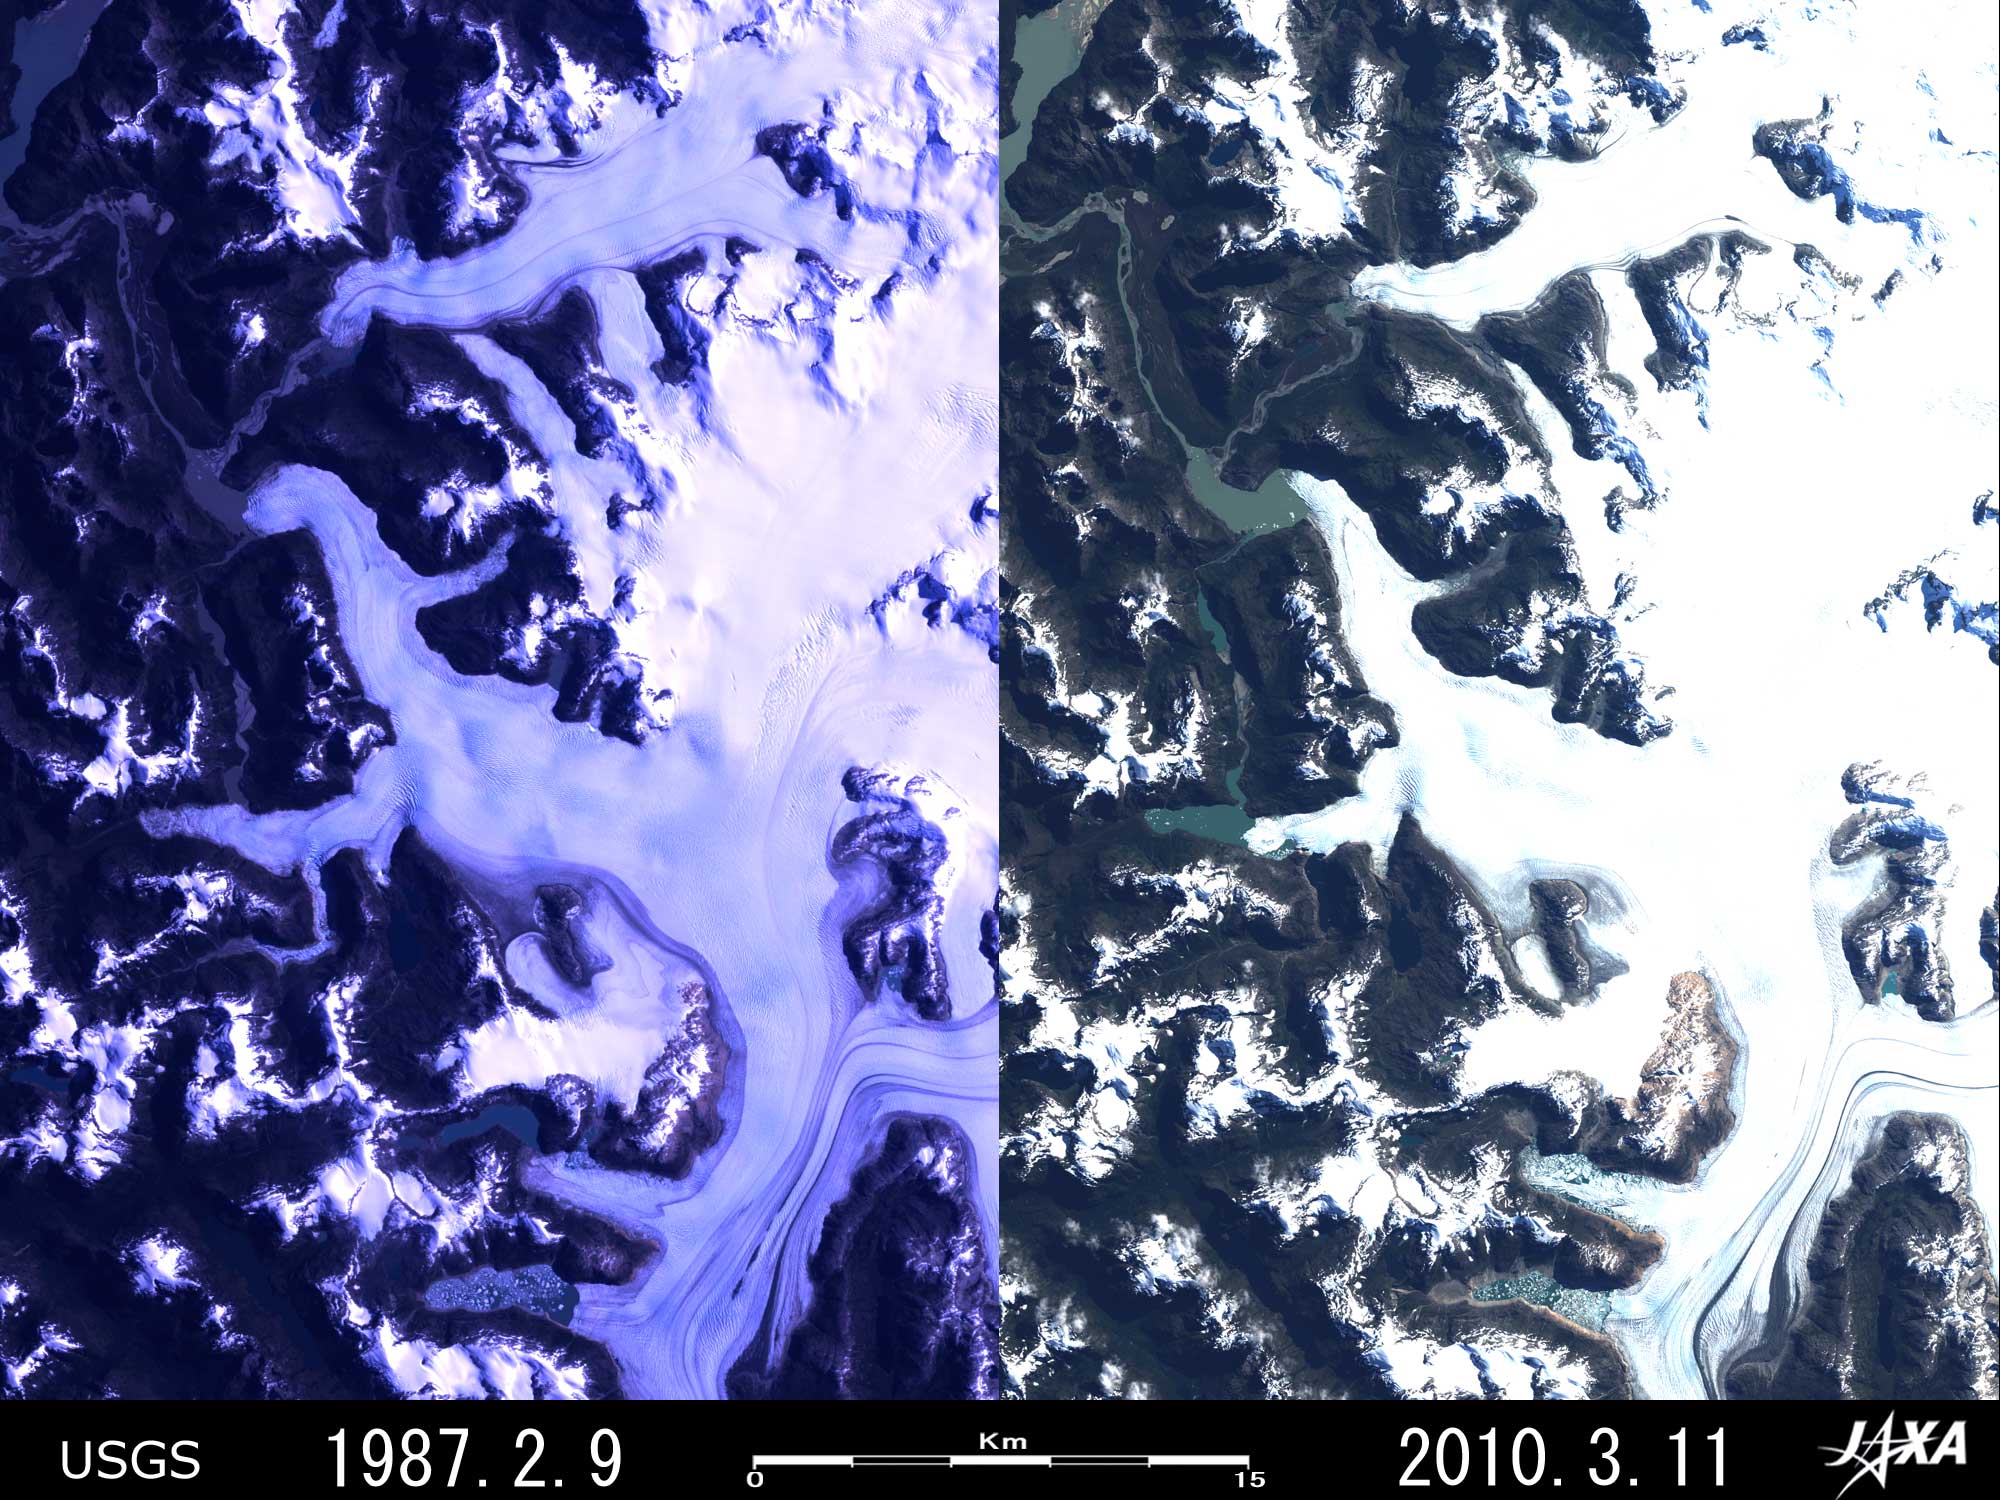 Fig. 4. Retreat of HPN 1, 2 and 3 Glaciers
Figure 4 shows HPN 1, 2 and 3 Glaciers, located in the southwestern area of the Northern Patagonian Ice Field. You can find that the terminus of HPN 1 Glacier retreated approximately 1.6 km during 23 years, that of HPN 2 Glacier approximately 1.3 km, and that of HPN 3 Glacier approximately 1.8 km. The average recession rate of each glacier is 70 m per year, 57 m per year and 78 m per year respectively.  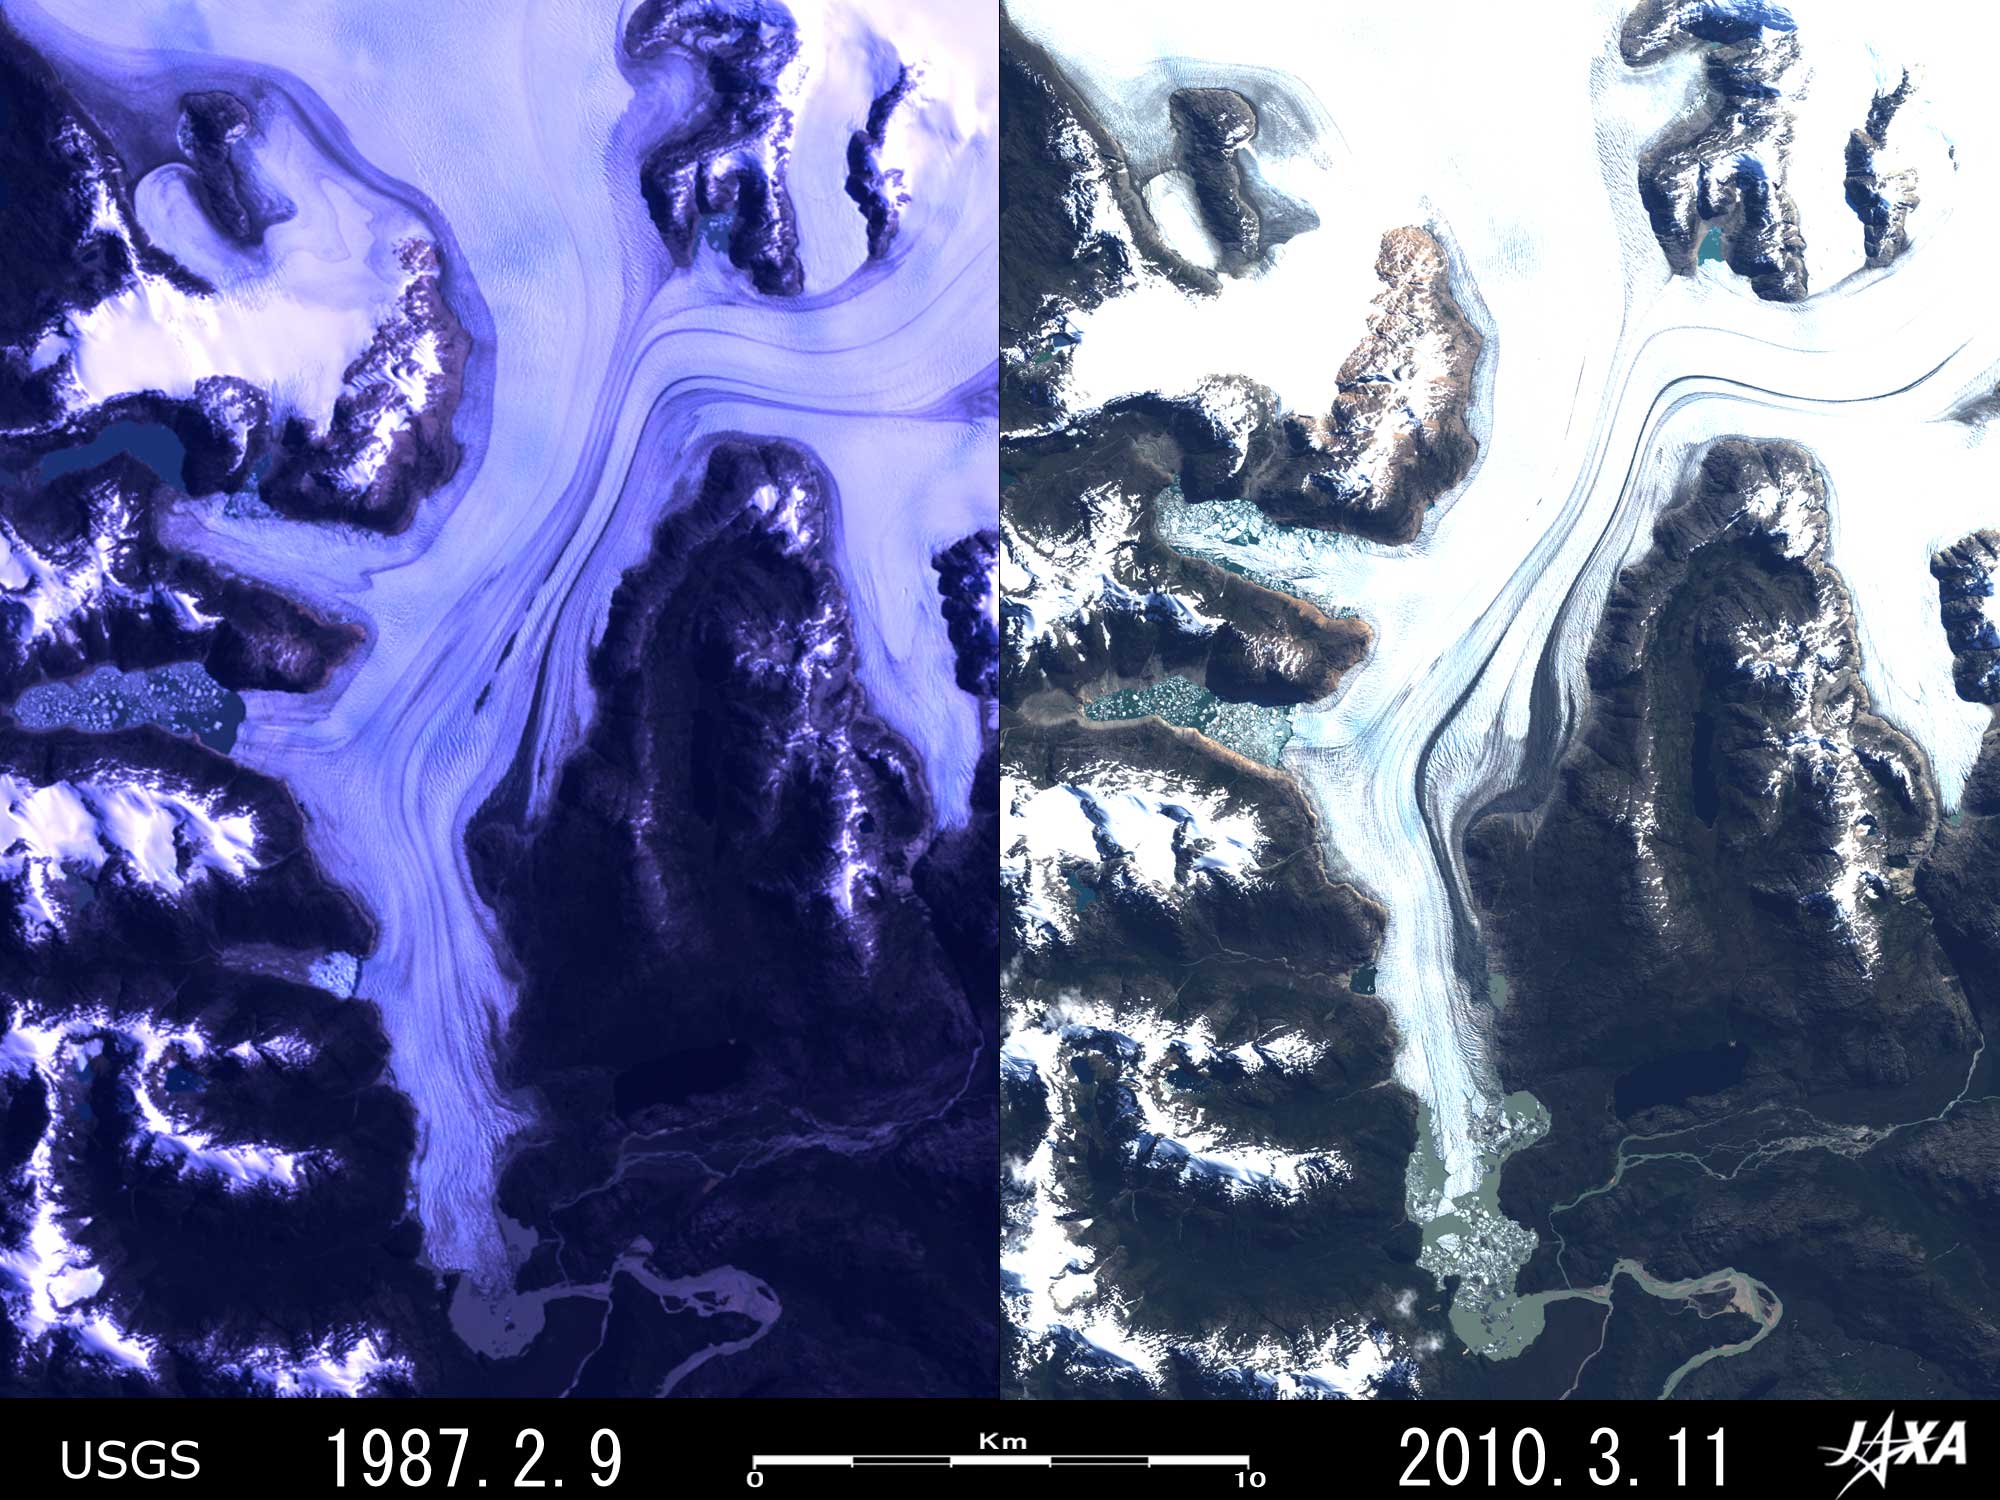 Fig. 5. Retreat of Steffen Glacier
Figure 5 indicates Steffen Glacier, located in the southern tip of the Northern Patagonian Ice Field. If we compare the northern tongues of the glacier marked by red arrows in the left image (1987) and the right image (2010), we can find that the tongue has remarkably collapsed and that the location of the terminus of the tongue in 2010 cannot appropriately be identified because of existence of numerous crevasses and floating icebergs there. If seeing the tongue terminuses with yellow arrows counterclockwise from the upper left, you can see that each terminus retreated approximately 870 m, approximately 2.1 km (mainstream) and approximately 280 m (eastern tongue) during 23 years respectively. The reference paper (*) reads that the mainstream terminus retreated 1,000 m and the eastern tongue terminus retreated 210 m during 3 years from 1990/91 to 1993/94, then they mean that each terminus retreated approximately 1.1 km and approximately 70 m respectively during remaining 20 years. The average recession rate during 23 years was 38 m per year, 91 m per year and 12 m per year respectively, but you can see that the terminuses did not only retreat but also lost their width. You can see a lake in front of the terminus of the northern tongue marked by red arrow in the image in 1987, but you cannot find it in the image in 2010, then you can find that it disappeared during these years. This article benefited from comments and suggestions by Dr. R. Naruse, the chair of Nonprofit Organization (NPO) "Glacier and Cryospheric Environment Research Laboratory." Reference:
Explanation of the Images:
AVNIR-2 has four observation bands. These figures were composed by assigning red to Band 3 (610 to 690 nm), green to Band 2 (520 to 600 nm), and blue to Band 1 (420 to 500 nm). The resulting image has natural coloring as if seen by the naked eye. In this image, clouds, snow and ice are white, glaciers are white or pale brown, exposed rocks, soils and sands are brownish, hay is dark brown. The ground resolution of Figs. 1, 3 and 4 was reduced to 30 m and that of Fig. 5 was reduced to 20 m to cover a wider area. (Fig. 2 and left sides of Figs. 1 and 3 to 5)
These image data are downloaded free of charge from the USGS Global Visualization Viewer (Glovis). |


