| |
 |
 |
 |
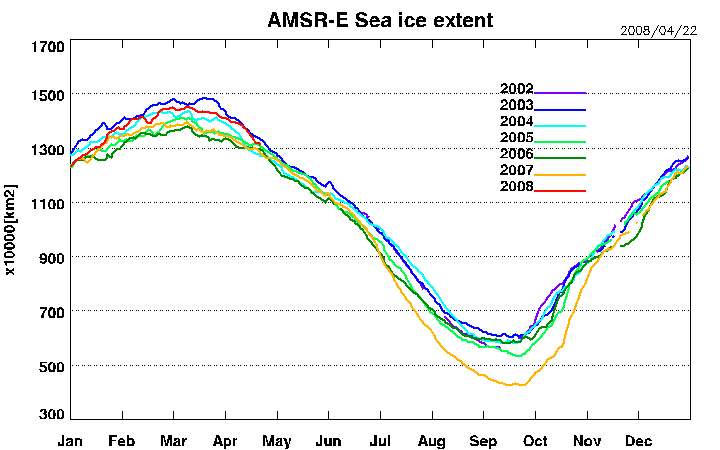
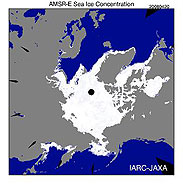
| Fig. 1. Spatial distribution of sea-ice concentration in the Northern Hemisphere captured on April 20, 2008 by AMSR-E (left) and seasonal variations of the sea-ice extent (right). |
Severe cold polar nights have gone, and sunshine has returned to the Arctic Ocean. Figure 1 (left) depicts the spatial distribution of the sea-ice concentration in the Northern Hemisphere captured on April 20, 2008 by AMSR-E. The Arctic sea ice decreased to a record minimum last summer but rapidly recovered in this colder winter and reached the second largest area in the last six years. However, due to spring warmth, the arctic sea-ice extent began to decrease again, and the ice extent is about to reach last year's decreasing rate (Fig. 1 (right)).
 |
 |
 |
 |
 |
 |
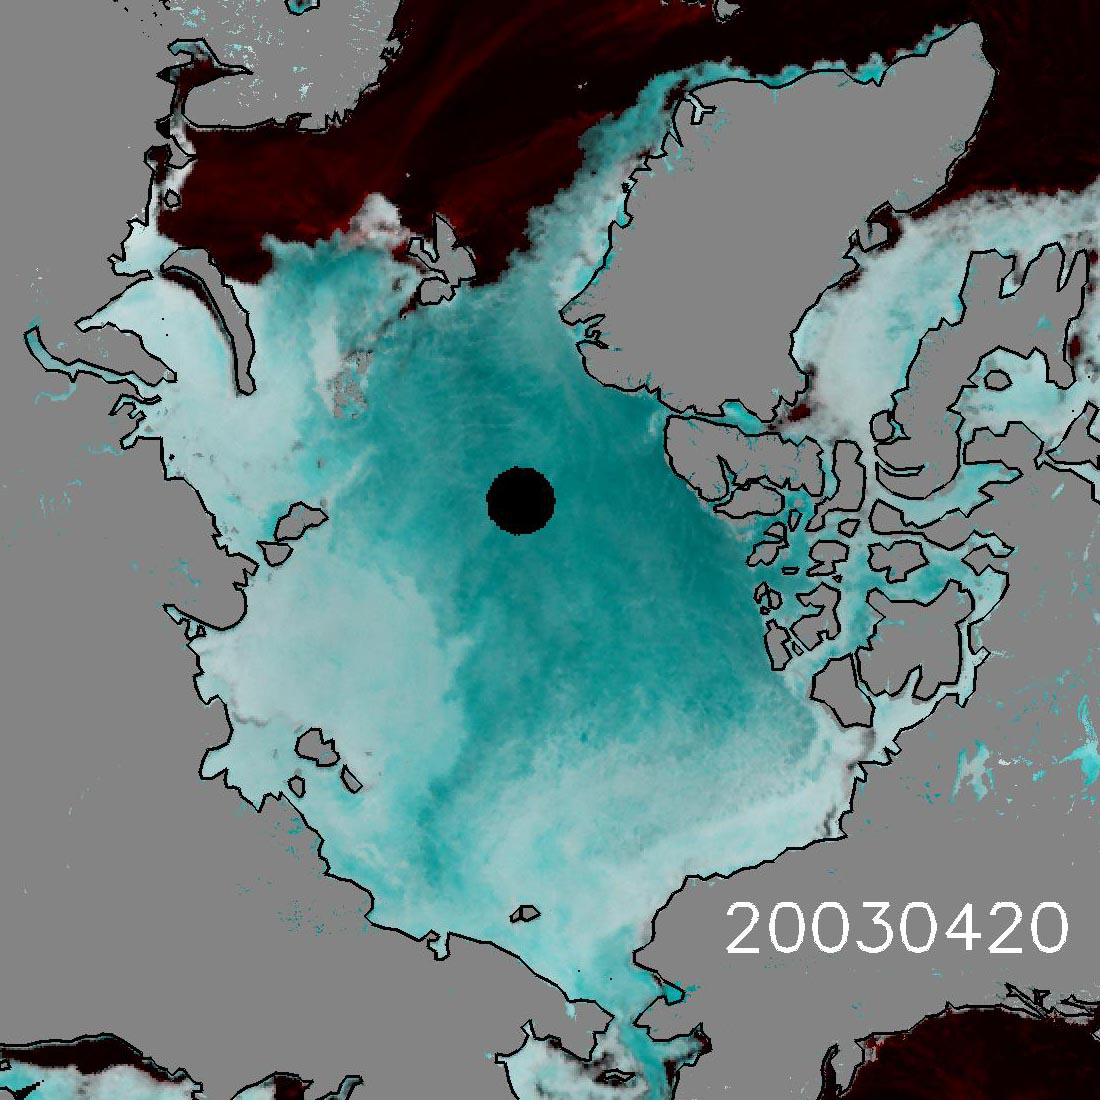
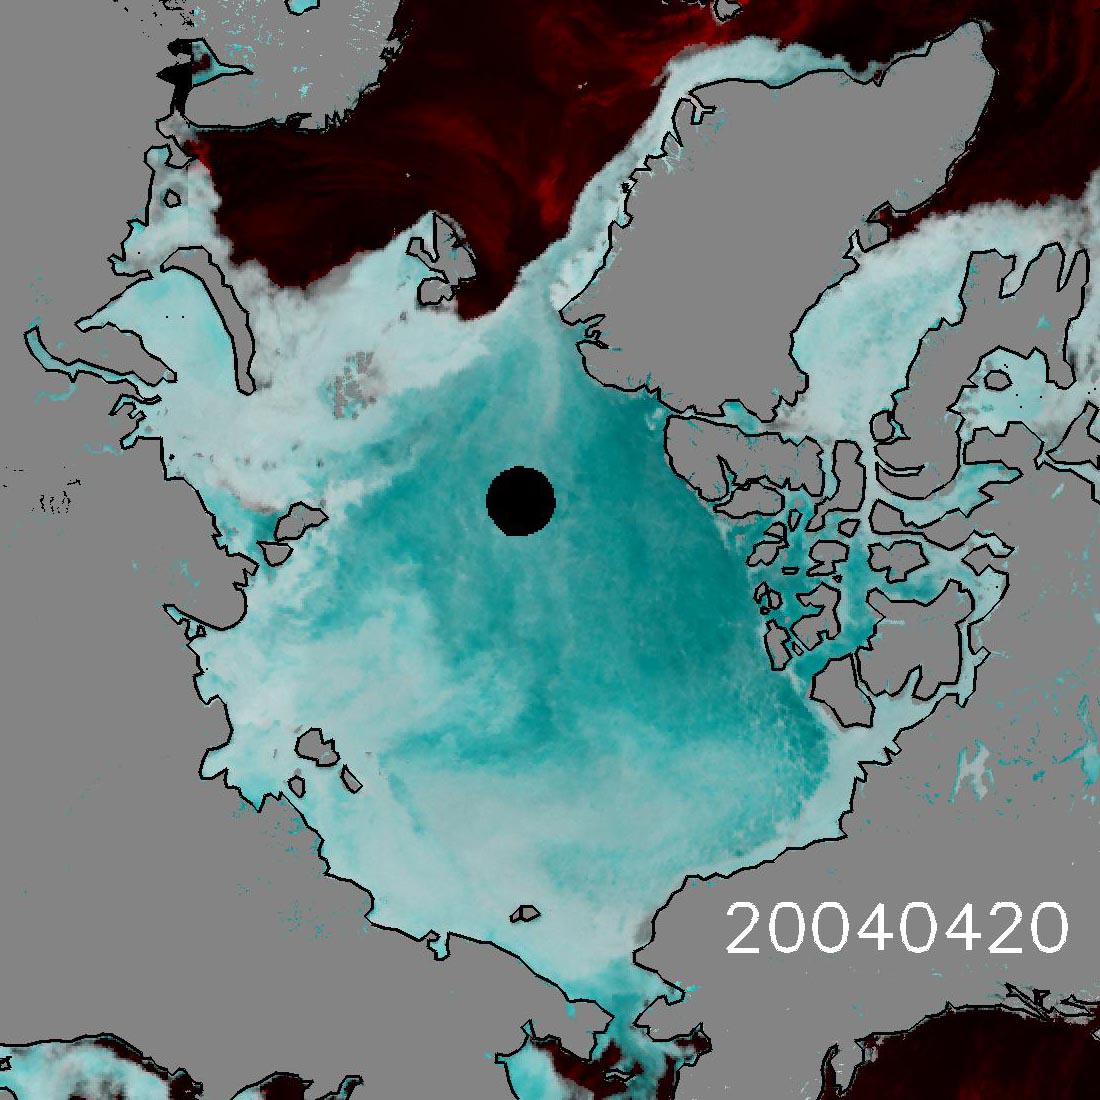
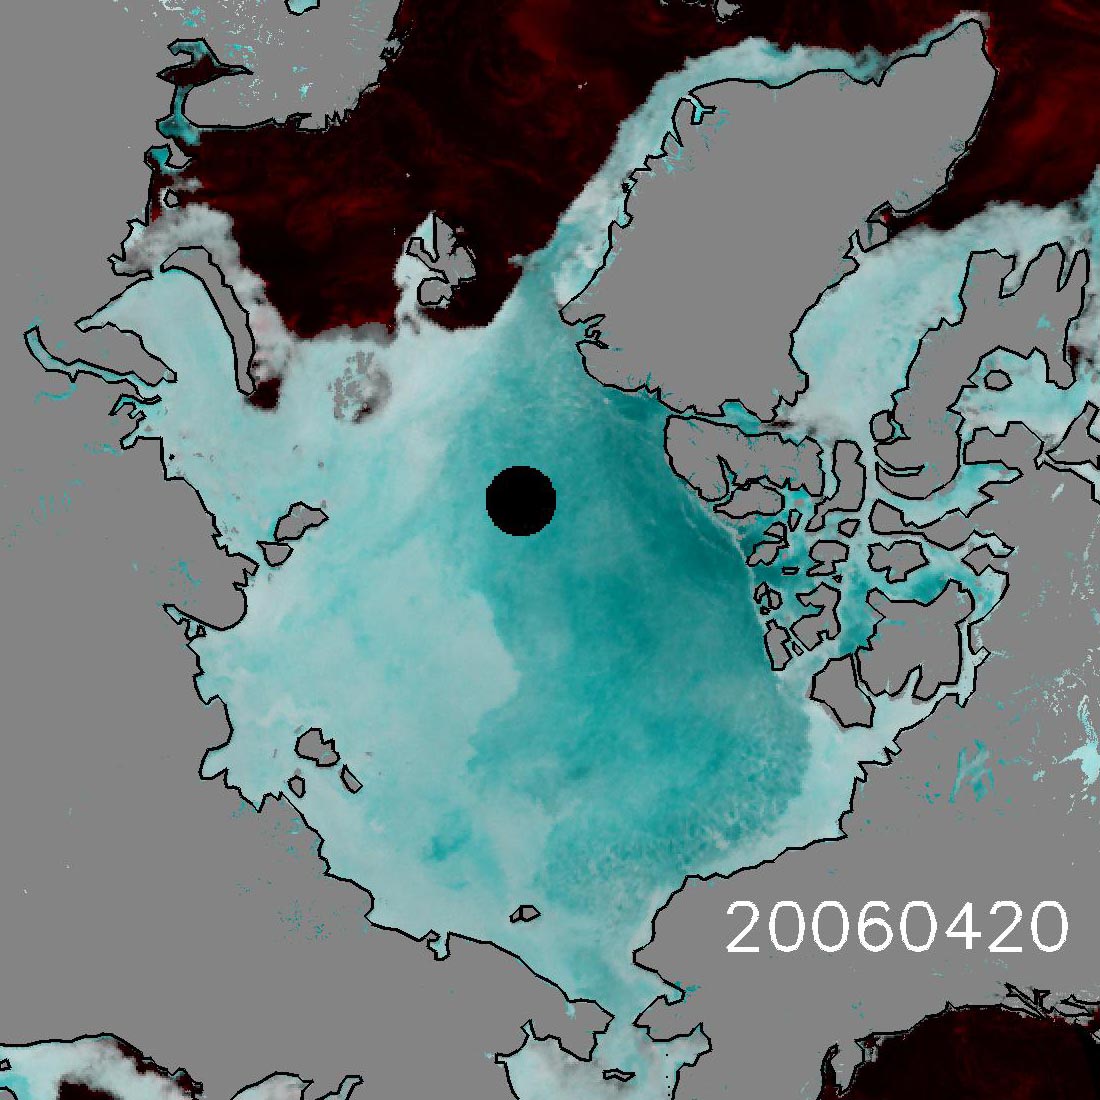
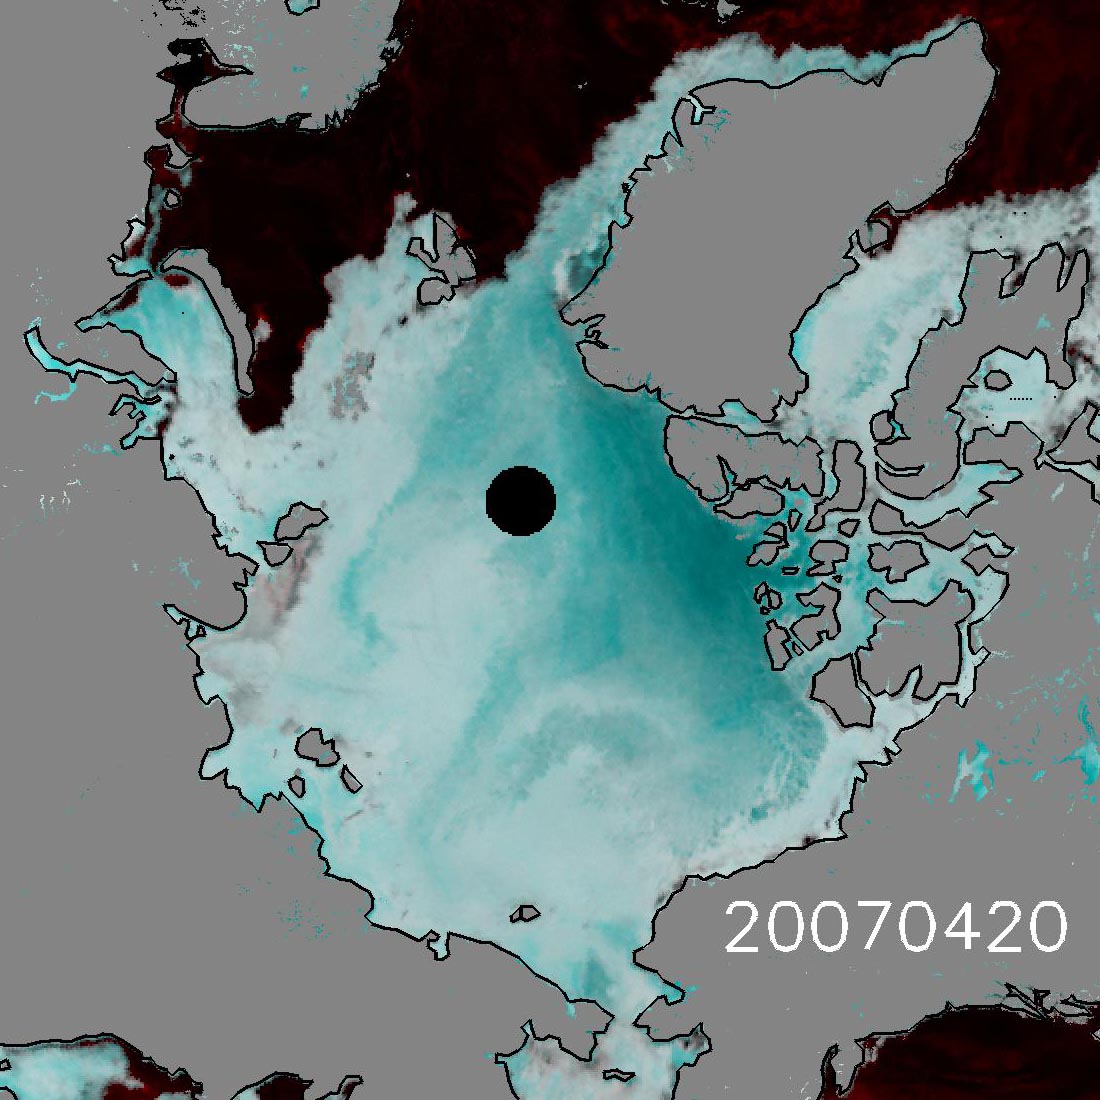
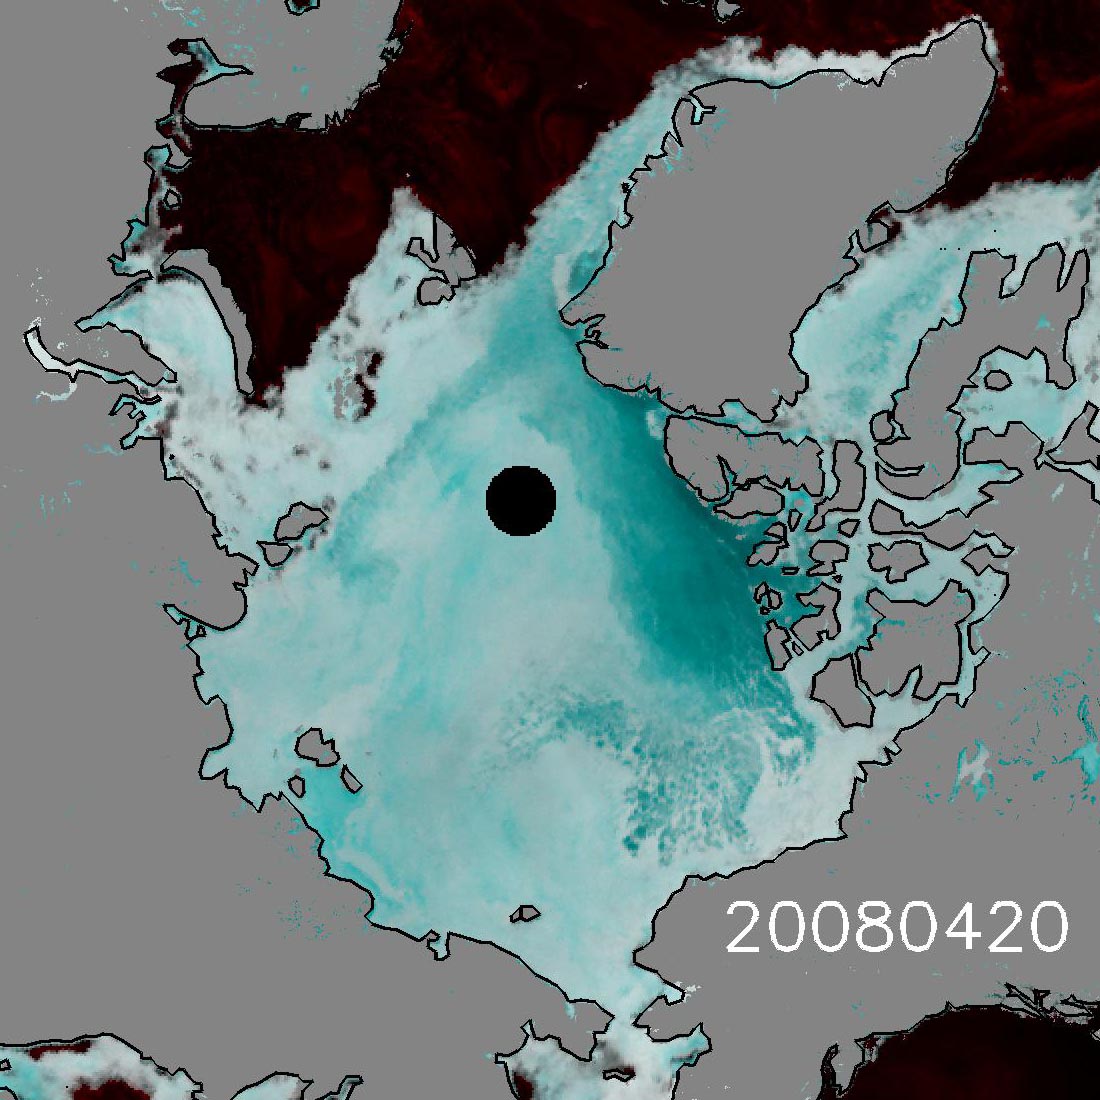
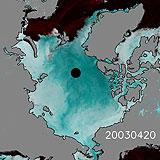
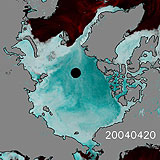
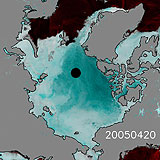
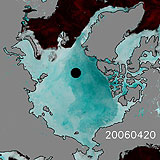
| Fig. 2 Spatial distribution of thin first-year ice (light blue) and thicker perennial ice (dark blue) in the Arctic Ocean captured on April 20 covering the last six years (2003 to 2008). |
Figure 2 presents color composite images prepared using AMSR-E brightness temperature data. The images indicate the spatial distribution of thin and thick Arctic sea ice and its temporal variation within the last six years. In general, older sea-ice has lower sea-ice emissivity in the microwave region. Thus, in the images above, older and thicker (perennial) ice looks dark (blue), while younger and thinner (first-year) ice looks bright.
The air temperature is still low in April, and thus the Arctic sea ice exhibits no significant year-to-year variation. However, you can see that the perennial ice fraction (dark blue) has rapidly shrunk recently. As also stated above, the Arctic sea-ice reached a record minimum in the summer of 2007 (*1) when the spring perennial ice fraction had significantly decreased from the previous year (2006). How about this year's fraction of the perennial ice? Compared to last year's fraction, the fraction of perennial ice is getting smaller and smaller. In addition, you can find that even the central Arctic Ocean around the North Pole (90°N), which is indicated by the black dot where there is no AMSR-E coverage, is covered with thin, young ice.
The decrease of the perennial ice fraction indicates that the entire Arctic sea-ice extent is rapidly thinning. When the Arctic ice gets too thin, the sea-ice becomes more vulnerable to summer heating, and dynamic and thermodynamic impacts from winds and ocean currents increase, which further accelerates the melting of the sea-ice. The AMSR-E images above tell us that preconditioning of the Arctic sea ice for summer melting this year will result in another record minimum.
JAXA has continued to monitor the Arctic sea ice using AMSR-E data since the launch of the Aqua satellite in May 2002. The reduction of the Arctic sea-ice extent usually lasts until the middle of September. Careful observations of the Arctic sea ice and surrounding environments are needed again.
You can find the latest data and images of sea-ice extent in the Arctic Ocean and previous observation images on Arctic Sea-Ice Monitor in the IARC-JAXA information system (IJIS) maintained by JAXA and located at the International Arctic Research Center (IARC, Fairbanks, Alaska).
Explanation of the Images:

Fig. 1
Figure 1 depicts the calculated concentration of sea ice based on the algorithm developed by one of the Principal Investigators (PI) for AMSR/AMSR-E algorithm development, Dr. Josefino C. Comiso from NASA GSFC. The calculation uses 36.5-GHz and 18.7-GHz horizontal and vertical polarization data acquired by AMSR-E. The spatial resolution of Fig. 1 data is approximately 25km.
Fig. 2
Figure 2 presents RGB color composites of AMSR-E brightness temperature images developed using 36.5-GHz and 18.7-GHz vertical polarization data. The spatial resolution of Fig. 2 data is approximately 25km.
|
|