ページの先頭です。
本文へジャンプする。
【Important Notices】This page is an archive page of information published in the past. Since the update has been completed, it may contain broken links or outdated information. For the latest information, please use the new site Earth-graphy (earth.jaxa.jp).
ここからサイト内共通メニューです。
サイト内共通メニューを読み飛ばす。
サイト内共通メニューここまで。
ここから本文です。

Seen from Space 2007

Korean Peninsula Flood by Heavy Rain

 
Fig. 1 Flood in Korean Peninsula, August 2007
Heavy rains in the middle of the Korean peninsula flooded farms; destroyed roads, railroads and bridges; and caused losses of agricultural facilities from August 7 to 11, 2007.
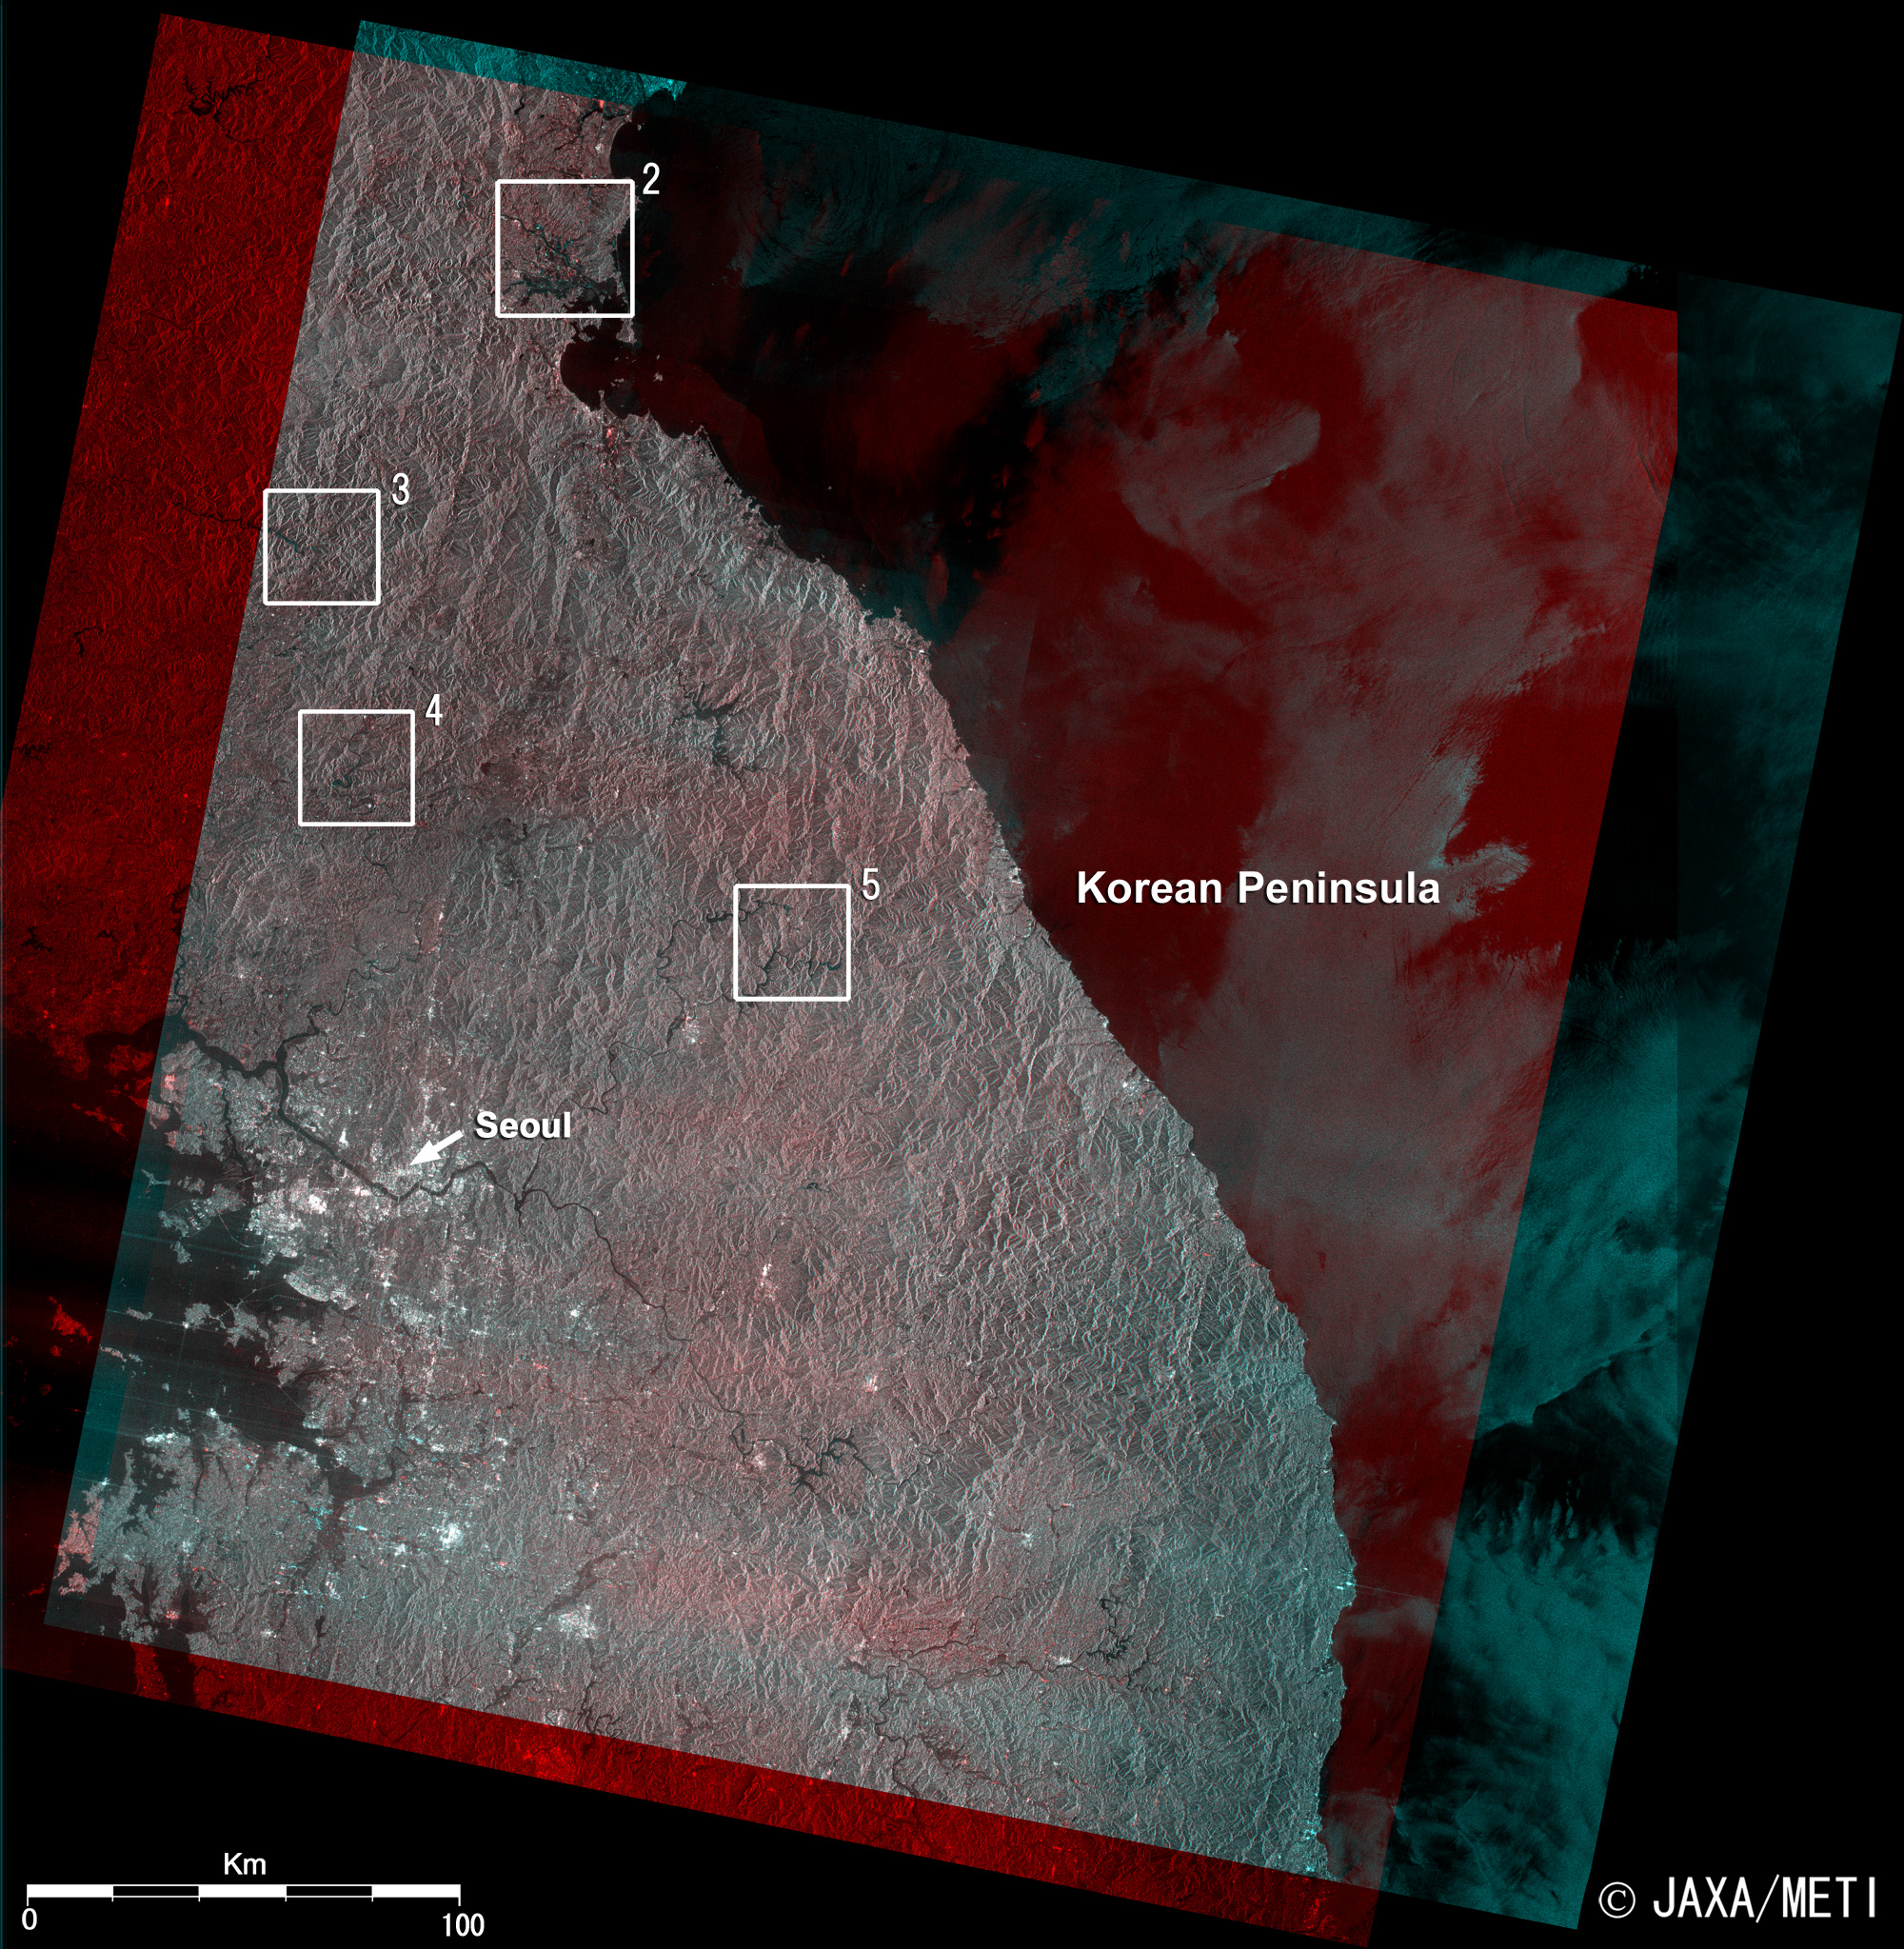
JAXA examined the influence of flooding using images acquired before and after the incident.
Figure 1 illustrates the influence of flooding with a blue-and-red composition image acquired by JAXA's Earth Observation Satellite "Daichi" on August 11 and July 25, 2007. The large area on the left of the figure is the middle of the Korean Peninsula. Notice the faint red or blue land area. The large red and blue areas on the left and right are not composite and area on the sea.

Fig. 2 Kowon
Kowon (kmz, 1.70MB, Low Resolution) is seen from Google Earth.
Fig. 3 Koksan
Fig. 4 Ichon Fig. 5 Yanggu, Korea
Figures 2 to 5 depict rivers widened by torrential rains in blue; increased soil moisture is indicated in red. These areas may have significant damage.

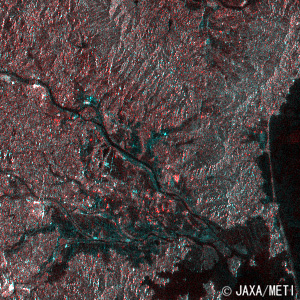
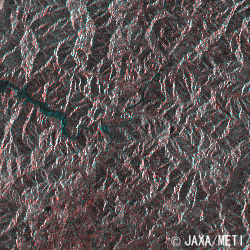
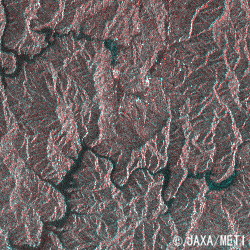
Figure 2 depicts Kowon and its vicinity on the east coast of the Korean Peninsula (North Korean); it is at the same latitude as Hanamaki City in Iwate Prefecture, Japan. The mouth of river is blue where it has overflown. The mountain near the river on the upper left side looks red, possibly indicating a landslide due to heavy moist soils.

Figure 3 depicts the Koksan region in Middle Western Korean Peninsula (Hwanghaepuk-to in North Korea), which is at the same latitude as Tsuruoka City in Yamagata Prefecture, Japan. Fields of 3,7000 hectares are flooded in the granary area of Hwanghaepuk-to; the area is most damaged in North Korea.

Figure 4 presents Ichon in the Middle Western Korean Peninsula. The blue dots near the meandering river in the middle of the figure may indicate flooding.

Figure 5 shows Yanggu, a strategic point from Seoul to the east coast that is rich in forests and water. You can see the swollen river in the figure.
News reports indicated that 11% of the rice and corn fields were lost and foretold serious damage to agricultural crops.


Explanation of the images:
Figs. 1 to 5. Click Figs. 1 and 2 to enlarge them.
Satellite: Advanced Land-Observing Satellite (ALOS) (Daichi)
Sensor: Phased-Array L-band Synthetic Aperture Radar (PALSAR)
Date: 0205 (GMT) on August 11, 2007, and 0203 (GMT) on July 25, 2007
Ground resolution: 100m
Map Projection: Universal Transversal Mercator (UTM)
PALSAR is a phased-array synthetic-aperture radar using L-band microwave signals to achieve cloud-free, day-and-night observation. In the flooded area, the water surface looks dark because all of the radar signal is reflected. In contrast, moderately moist soils appear bright. Figures 1 to 5 were composed using the before-flood image (green and blue) and the after-flood image (red). In the resulting images, blue indicates increased water surface and red indicates increased moisture in the soil after the flood.

Related Sites:
ALOS Research and Application Page
Typhoon/Flood, Seen from Space
本文ここまで。
image:Satellite Navigator
image:Satellite Applications and Operations Center(SAOC)
Earth Data Collection by JAXA Satellites
image:ページTOP