Seen from Space 2006
TRMM Observes Heavy Snow in Western Japan
| |
 |
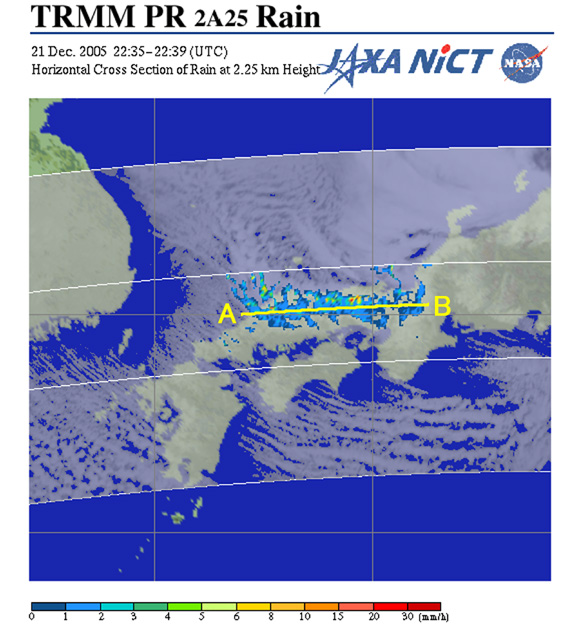
| Fig. 1. Distribution of heavy snow that fell in the Chugoku and Kinki districts and related cloud imagery |
A deep freeze hit the Japanese Islands in the winter of 2005-2006 causing extensive damage from the accompanying heavy snowfall. The monthly mean air temperature in December 2005 was 2.7°C lower than average in eastern Japan, and 2.8°C lower in western Japan. This broke the record set in 1946 when the collection of area statistics began. In January, new maximum records for snow depth were set, with approximately 4m of snow depth at some observation points. This heavy snow killed 80 people as of January 12, 2006, and disrupted daily life by suspending train schedules and preventing other means of travel. Some areas were isolated due to roads being blocked by avalanches, and the price of vegetables and other goods rose.
A heavy snow brought a prolonged electrical power failure in Niigata Prefecture and western Japan on December 22, 2005. The snow fell over a wide area of western Japan, and they saw the first December snowfall in 40 years at Tanegashima in Kagoshima Prefecture. On that day, a strong high-pressure area existed over Siberia after a cyclone moved to the east of Japan, therefore a typical strong winter pressure pattern developed.
The Tropical Rainfall Measuring Mission (TRMM) satellite observed these heavy snowfalls. Figure 1 superimposes the rainfall image from Precipitation Radar (PR) on the cloud image from Visible Infrared Scanner (VIRS), both aboard TRMM, and both taken at 0737 JST on December 22, 2005. The linear clouds that accompany the cold-air outbreak from the continent, on the Sea of Japan and on the East China Sea are clearly visible. The clouds over the Pacific indicate that the cold-air outbreak was very strong. A cloud band stretches from the sea east of the Korean Peninsula to Japan's Chugoku and Kinki districts (the VIRS image). A snow band extends east and west along the cloud band above the Chugoku area (the PR image). This "convergence band cloud" often brings heavy snowfall. In the northern area of Hyogo Prefecture, 6cm of snow fell in an hour; the red area delineates the heaviest snowfall.
 |
 |
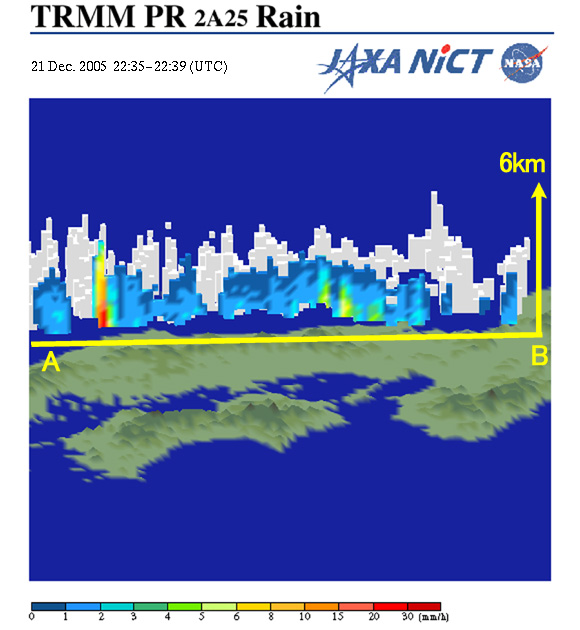
| Fig. 2. Bird's-eye view of the snowfall, and intersection of the precipitation intensity seen from the southern side |
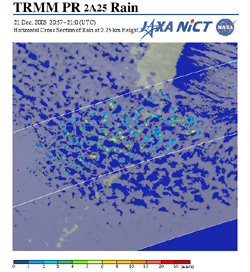
Fig. 3. Precipitation distribution and cloud image of southern Kyushu |
Figure 2 is a bird's-eye view of a vertical cross-section of Fig. 1 in an east-west direction. The height of the precipitation area was approximately 6km. This is not high when compared with summer rainfall. However, such low clouds often bring heavy snow in winter.
Figure 3 is an image composed of cloud and precipitation distribution from southern Kyushu to Okinawa, observed at 0600 JST on December 22, 2005. Each of the linear clouds seen in the VIRS image is very small, but the clearly defined snowfall area shows the developing convection. This is another characteristic of winter in Japan. Sunshine and strong snowfall alternate for short periods of time. The snowfall in Tanegashima was probably caused by such small snow clouds.
Explanation of the images:
(Figs. 1 to 3)
|
 |
|