ページの先頭です。
本文へジャンプする。
【Important Notices】This page is an archive page of information published in the past. Since the update has been completed, it may contain broken links or outdated information. For the latest information, please use the new site Earth-graphy (earth.jaxa.jp).
ここからサイト内共通メニューです。
サイト内共通メニューを読み飛ばす。
サイト内共通メニューここまで。
ここから本文です。

Seen from Space 2006

Variation of sea ice cover in the Antarctic Ocean

 
Fig. 1 Monthly sea ice distribution in the Antarctic Ocean during the past year
Ten-day interval movie is here.(Quick time form 11.4MB)
This article discusses the sea ice in the Antarctic Ocean.
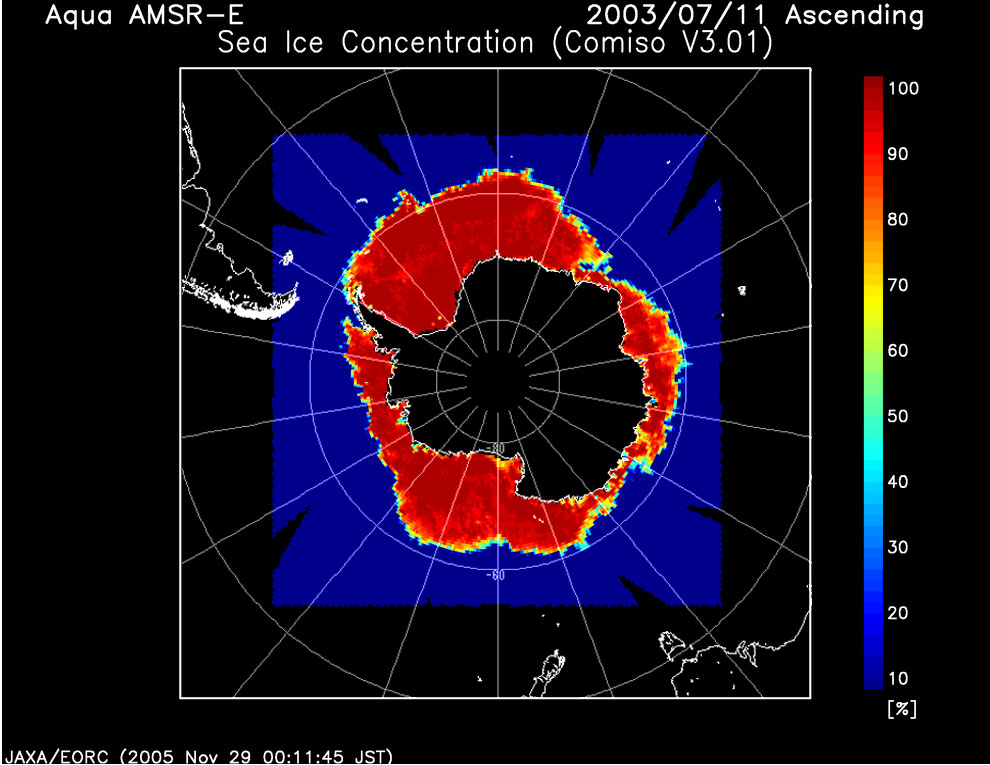
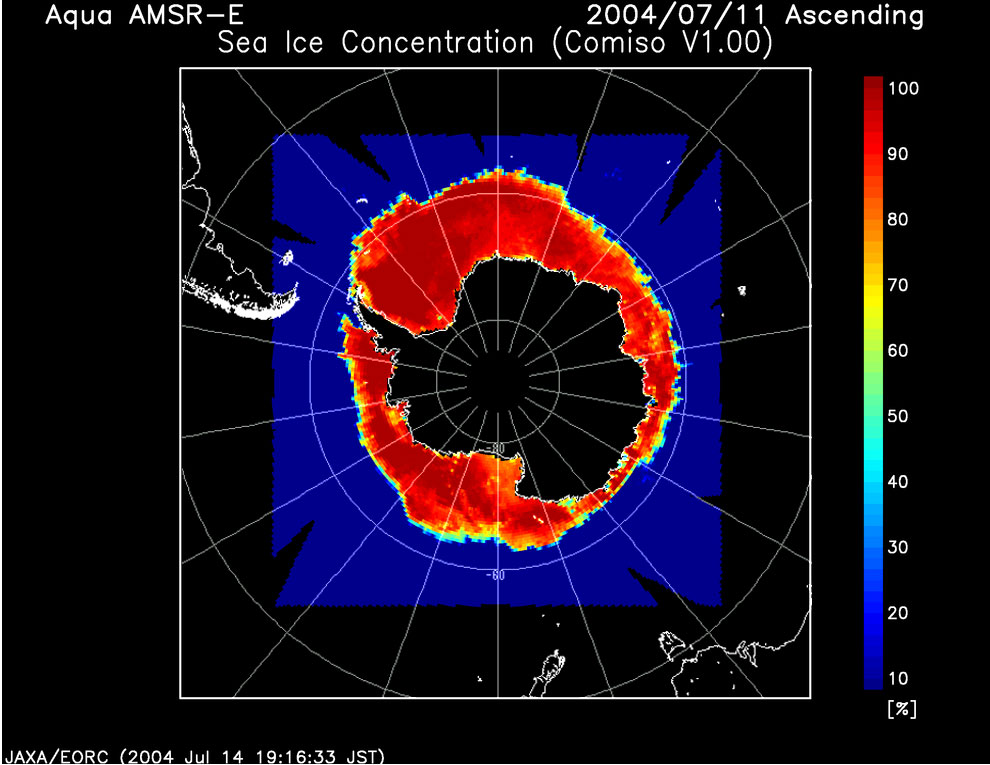
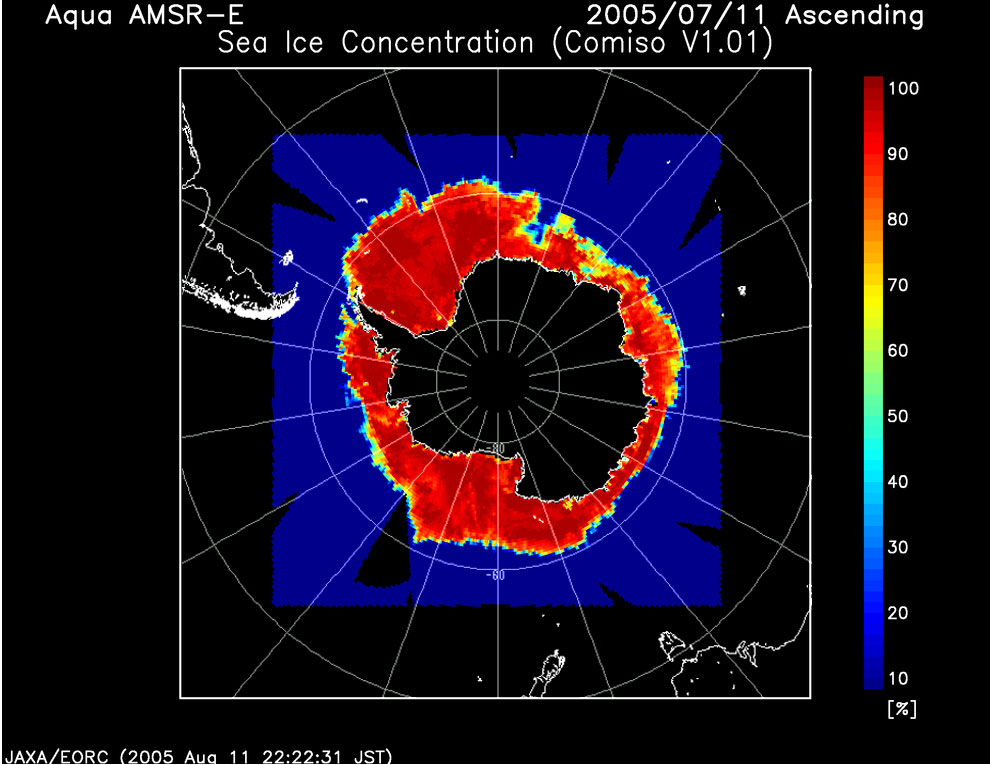
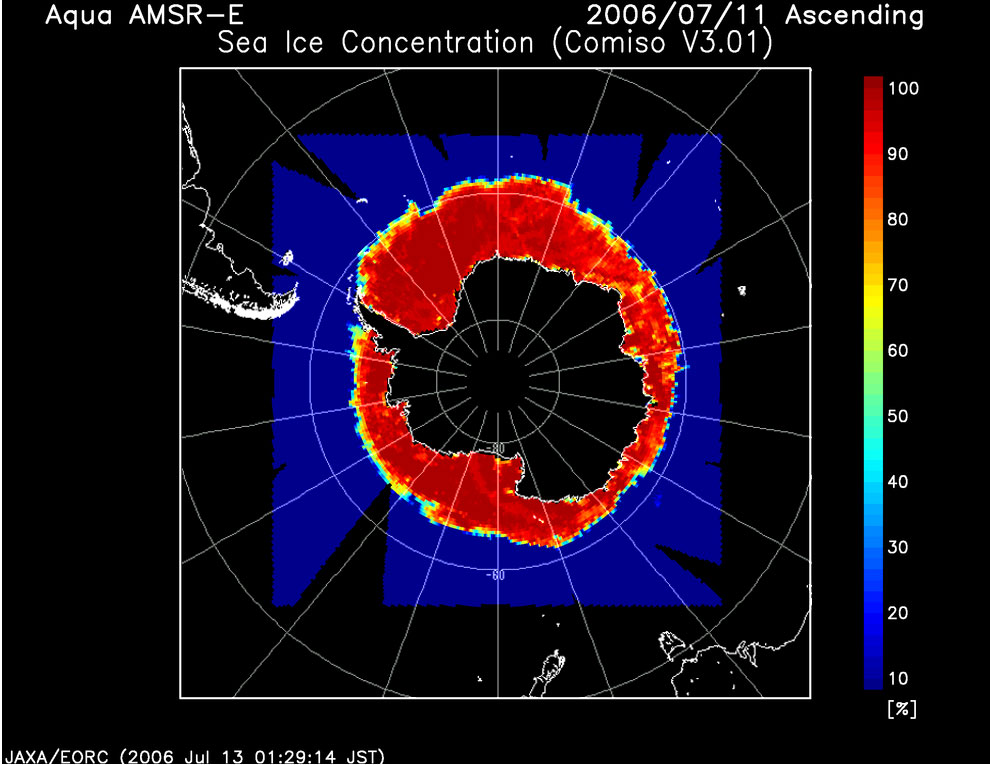
Figure 1 presents an animated movie of the yearly transition of sea ice in the Antarctic Ocean. The movie is composed of pictures captured by the JAXA's microwave instrument AMSR-E aboard NASA's Aqua satellite. The figure illustrates the observed sea ice in the white area in the center, the land in gray, and the sea surface in blue. The yearly sea-ice extent in the Antarctic Ocean experiences its greatest decrease in March (autumn in the southern hemisphere), unlike the Arctic Ocean ice, which decreases in September.

Fig. 2 Sea ice distribution in the Antarctic Ocean on July 11 in the past four years (2003-2006)
Figure 2 presents snapshot images of sea-ice distribution observed on July 11 (winter season in the southern hemisphere) in the past four years (2003 to 2006). The same images are available on the web of AMSR-E Level-3 browse image.
The figure indicates that the sea-ice cover of this year has a round shape, whereas the shape and position of the past sea-ice cover have varied significantly depending on the year.

Recent sea-ice observations by satellite indicate continued reduction of the extent of sea ice in the Arctic Ocean. In contrast, the extent of sea ice in the Antarctic Ocean does not exhibit such an explicit decreasing trend. Rather, snow depth over the sea-ice cover in the Antarctic Ocean has increased recently, and the sea ice extent also has expanded gradually but continuously.

Why does sea ice behave so differently in the two polar regions? Until now, no one has clarified the reason for the conflicting behavior. However, researchers believe that, as the climate of the Earth becomes warmer, sea ice itself floating on the ocean melts easier while the precipitation (snow fall) rate increases. The faint increase trend of the Antarctic sea ice extent is considered to balance the climate system of the Earth, which is believed to be getting warmer year by year, demonstrating the complexity and difficulty of understanding the formation of the climate system.

JAXA will continue to monitor these climatic trends by using Earth-observation satellites.


Explanation of the images:
Fig. 1-2
Satellite: EOS- Aqua (NASA)
Sensor: Advanced Microwave Scanning Radiometer for EOS (AMSR-E) (JAXA)
Date: 1-month intervals from July 12, 2005 to July 11, 2006 (Fig. 1 FLASH movie)
Ten-day intervals from July 12, 2002 to July 11, 2005 (QuickTime movie)
July 11, 2003, July 11, 2004, July 11, 2005, July 11, 2006 (Fig. 2)
Figures 1 and 2 depict the calculated concentration of sea ice, based on the algorithm developed by Dr. Josefino C. Comiso from NASA GSFC. Dr. Comiso was one of the Principal Investigators (PI) in developing the AMSR/AMSR-E algorithm by using 36.5-GHz and 18.7-GHz horizontal and vertical polarization data among the six observation frequencies of AMSR-E. Spatial resolution in the figure is approximately 20 km. Sea-ice concentration is the ratio of ice cover per unit area. The open water area is 0% and the sea-ice covered area is 100%. Areas with low sea-ice concentration are light blue and change to yellow and orange corresponding to higher concentrations, with the highest sea-ice concentration displayed as red or deep vermilion. The land is gray, the open water surface (sea surface) is deep blue, and areas with no data are white. The spatial resolution is approximately 15 km.

Related sites:
The largest global tract of sea ice covers the Antarctic Ocean, a huge depository of deep seawater.
Antarctica-An isolated continent-
Cryosphere, Seen from Space
本文ここまで。
image:Satellite Navigator
image:Satellite Applications and Operations Center(SAOC)
Earth Data Collection by JAXA Satellites
image:ページTOP