| |
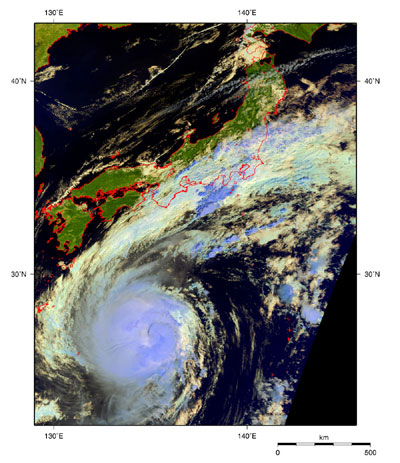 |
| Fig. 1. Typhoon No. 20 observed by MODIS |
Figure 1 depicts the clouds of typhoon No. 20 (Kirogi) as observed by MODIS on October 17. This typhoon was born on October 10 south of Shikoku Island. It moved slowly and then wandered toward the south for the first time and has remained on the sea in the south of Japan for a week.The typhoon has caused southern warm, damp air to flow upon the Japan islands. Frontal clouds grew, and it has been rainy in the Kanto region. In Fig. 1, the thick round clouds surround the eye of the typhoon, and join with frontal clouds spreading from the sea in the south of Kyushu Island to the Kanto region hiding Kii Peninsula. In the figure, the developed rain clouds with high-altitude solid ice cloud tops look grayish purple, and middle and low-altitude liquid water cloud tops look white-yellow. "Kirogi" means wild goose in Korean.
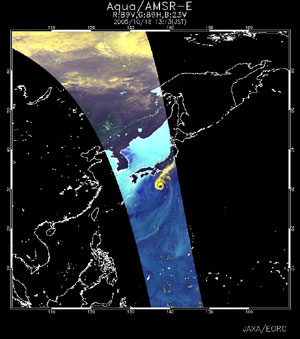 |
| Fig. 2. Typhoon No. 20 observed by AMSR-E |
Figure 2 presents typhoon No. 20 observed by AMSR-E. The atmosphere contains a lot of moisture and makes the sea area appear dark blue. The developed clouds appear yellow and are distributed in a doughnut shape, with the apparent eye of the typhoon being cloud-free.
 |
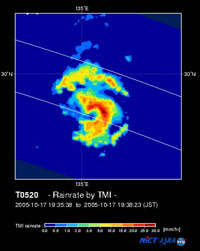 |
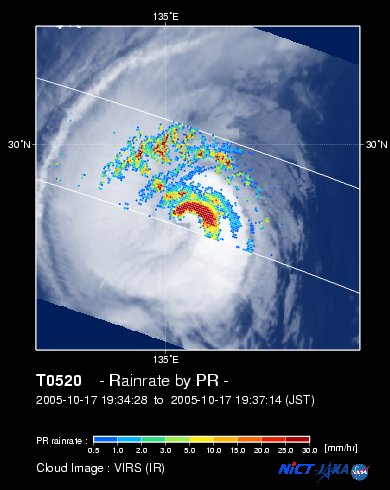
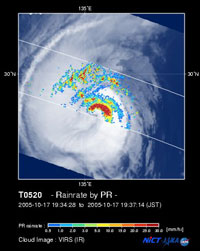
Fig. 3. Rain-rate distribution acquired by PR,
and cloud image acquired by VIRS |
Fig. 4. Rain-rate image acquired by TMI |
Figure 3 is a super-imposed image of rain-rates near the Earth's surface observed by PR, and the cloud image observed by VIRS; both sensors are aboard the TRMM satellite.
Figure 4 presents the precipitation observed by TMI aboard the TRMM satellite.
According to the observed image, heavy precipitation areas (red and yellow) of this typhoon form a circle approximately 420 km in diameter.
 |
| Fig. 5. Wind velocity distribution on the sea observed by AMSR-E |
Figure 5 illustrates the distribution of analyzed wind velocity on the sea south of the Japan islands on October 18. Wind velocity on the sea can be analyzed by observing wave conditions (swells and surfs) of the sea surface created by wind there. AMSR-E observes the sea surface not with visible lights but with microwaves, so we can estimate the distribution of wind velocity on the sea when visible sensors cannot be used, such as at night or with cloud cover. In Fig. 5, we can observe the round red-hatched area of strong 90-knot winds (1 knot is about 0.5 meter per second) in the center of the typhoon off the coast of Kii Peninsula. This global distribution report of sea wind "AMSR-E All Weather Ocean Wind Speed" has been released at the right-side link in our homepage "AMSR/AMSR-E." Click observed area on the world map and an expanded distribution picture as in Fig. 5 pops up.
According to JMA's press release issued at 1200 on October 18, the central pressure in typhoon No. 20 is 955 hPa, the maximum wind speed near the center is 40 m/s (10 minutes average), and winds of 50 knots or more extend 90 km.
We expect the typhoon to increase in speed to the northeast and approach the Kanto region, so more attention must be paid there.
Please monitor and heed future typhoon information.
Explanation of the images:
Fig. 1.
| Satellite: |
EOS-Terra (NASA) |
| Sensor: |
Moderate Resolution Imaging Spectro-radiometer (MODIS; NASA) |
| Time and date: |
1051 (JST) on October 17, 2005 |
|
Color composition was made by using three of 36 channels on MODIS; channel 7 of the short-wavelength infrared band (2,105 to 2,155 nm) for red, channel 6 of the near-infrared band (1628 to 1652 nm) for green, and channel 3 of the visible region (459 to 479 nm) for blue, resulting in the figure below.
|
| Green: | Abundant vegetation (ex. forests) |
| White, White-Yellow: | Clouds of water |
| Gray-purple: | Clouds of ice (high clouds) |
| Black: | Water surfaces (sea, lakes, and rivers) or no data |
Fig. 2.
Fig. 3.
Fig. 4.
Fig. 5.
*1 TRMM is a joint mission with participation of NASA, NICT, and JAXA.
|
 |
|