| |
 |
 |
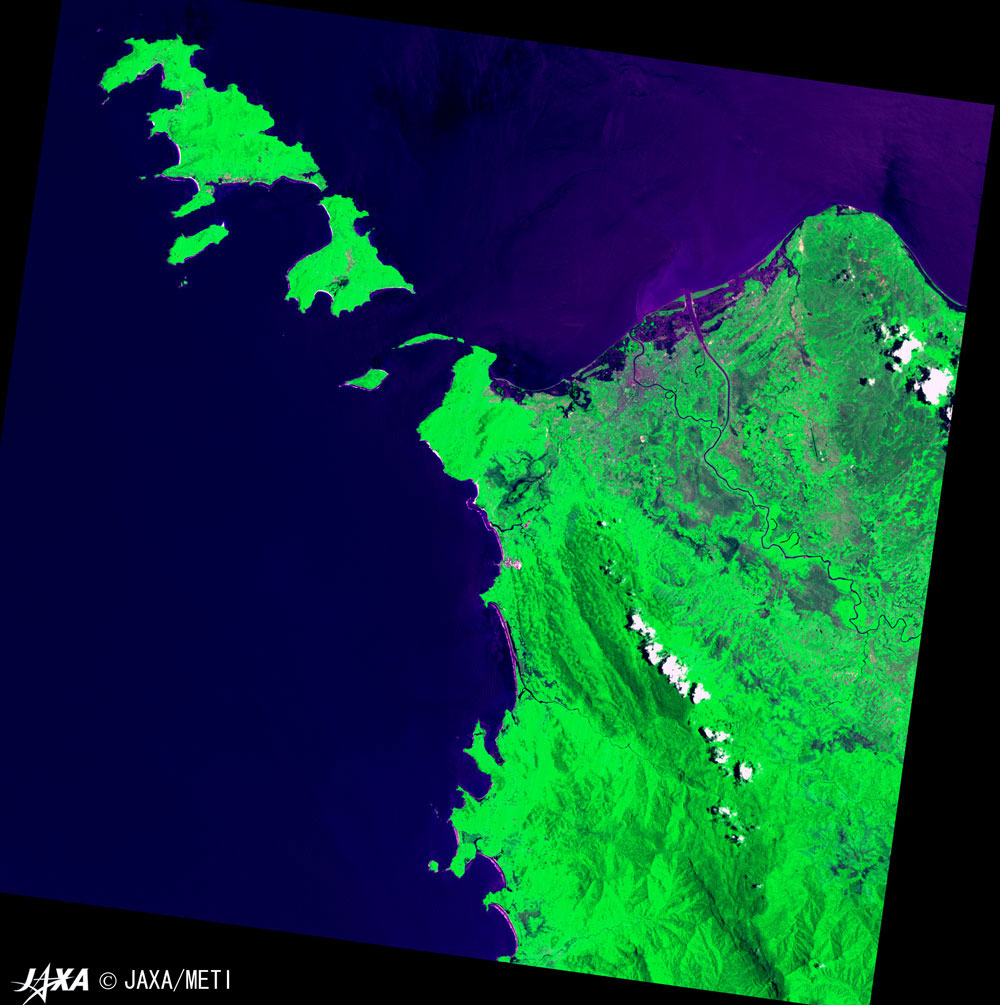
| Fig. 1 Banda Aceh just after disaster |
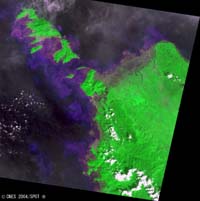
Fig. 2 Banda Aceh before disaster
|
A major earthquake ocurred off Sumatra Island at 0059 (UT) on December 26, 2004, bringing severe damage and many casualties to the nations surrounding the Indian Ocean and Andaman Sea, including many tourists from Europe, Australia and Japan.
Figure 1 depicts Banda Aceh captured by French Earth-observation satellite SPOT-2 3 hours 25 minutes after the earthquake. Sea water driven by the tsunami appears to remain in the coastal area (gray), and the original coast line is hard to recognize. You can also see some swirls of muddy sea water (puple or reddish purple parts).
Figure 2 depicts Banda Aceh observed by Japanese Earth Resources Satellite -1 (JERS-1) 9 years ago, showing that the land surface is covered by abundant vegetation almost up to the seashore.
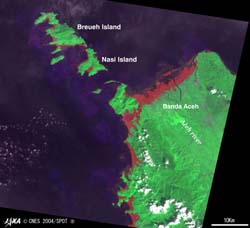 |
Fig. 3 Extracted area inundated by tsunami in Banda Aceh
|
In Fig. 3, the estimated area inundated by the tsunami was extracted and colored red based on the super-imposed image of Fig. 1 and the coast line extracted from Fig. 2. You can generally see that westward inlets and bays were inundated. The figure also indicates that the northwestward coastal area in Banda Aceh was inundated to 4.4 km inland from the usual coast line, and that the tsunami surged to 9 km above the mouth in the drain east of Aceh river. The peninsula west of Banda Aceh looks like an isolated island.
 |
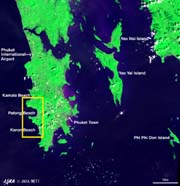 |
| Fig. 4 Phuket Island after disaster |
Fig. 5 Phuket Island before disaster |
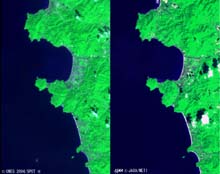 |
Fig. 6 Expanded comparison of Patong Beach before (right) and after (left) disaster
|
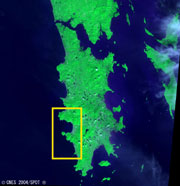
Figure 4 depicts Phuket Island as captured by the SPOT-2 satellite two days after the earthquake; Fig. 5 is an image acquired by JERS-1 satellite eight years ago. Figure 6 compares expanded images around Patong Beach from Figs. 4 and 5 to left and right. The figure depicts that some white sandy beachs that existed before the tsunami disappeared after the tsunami, and other sandy beachs became narrower after the tsunami. It is hard to distinguish inundated areas from city areas because there are many developed areas such as Patong Beach.
These images indicate how large the disaster was, but we cannot measure the mental damage inflicted on the suffering people. Our heartfelt sympathy goes out to all the sufferers of this disaster, and we pray that recovery from the disaster will be soon.
Explanation of the images
(Fig. 1)
(Fig. 2)
(Fig. 3)
| Estimated area inundated by the tsunami was extracted and colored red based on the super-imposed image of Fig. 1 and the coast line extracted from Fig. 2. |
(Fig. 4 and Fig. 6 left)
(Fig. 5 and Fig. 6 right)
| Satellite: |
JERS-1 (Japan) |
| Sensor: |
VNIR (Japan) |
| Date: |
0413 AM (UT) on January 30, 1997 (1313 JST) |
| Ground resolution: |
18.3 m x 24.2 m |
|
 |
Figures 1, 3, and 4 and the left image of Fig. 6 are composed of data processed after being purchased from Spot Image S.A. Color compositions of SPOT-2 images were made by assigning red to the visible 0.61 to 0.68 μm channel, green to the near-infrared 0.78 to 0.89 μm channel and blue to the visible 0.50 to 0.59 μm channel. Color compositions of JERS-1 images were made by assigning red to the visible 0.63 to 0.69 μm channel, green to the near-infrared 0.76 to 0.86 μm channel, and blue to the visible 0.52 to 0.60 μm channel. As a result, all the figures have natural coloring, and look the same as seen with the naked eye with vegetation slightly emphasized. In these images, the exposed soil and sand are white or pale brown, city areas are gray, forests are vivid green, grass is brownish green, clear water surfaces are black, and muddy water surfaces are purple or reddish purple.
|
Related Sites:
General information on the earthquake off Sumatra:
 USGS USGS
General information on disaster prevention, including photographs on the site:
Asian Disaster Reduction Center (ADRC)
Satellite images:
International Charter “Space and Major Disasters”
Earth Remote Sensing Data Analysis Center
NASA's Natural Hazards page
NASA's MODIS page
ESA's Earth Observation page
India's National Remote Sensing Agency's page
CSA's page
CNES' page
DLR's page
Spot Image S.A's page
DigitalGlobe Inc.'s page (Please click "Tsunami Media Gallery" lower right of the page)
Tsunami Gallery page of Space Imaging, Inc.
ORBIMAGE Inc.'s page
Tsunami simulation:
National Institute of Advanced Industrial Science and Technology (AIST)'s page
Others:
Pacific Tsunami Warning Center (PTWC)'s page
Appendix: What is "magnitude"?
“Magnitude” represents the size or energy of an earthquake; the larger the magnitude, the more powerful the earthquake. The original (Richter) magnitude was defined as common logarithms of the maximum displacement measured in micrometers recorded on a kind of seismometer located 100 km from the earthquake epicenter. If the maximum displacement increases by a factor of 10, the magnitude increases by 1. Considering the energy of an earthquake, if the magnitude increases by 1, the energy of the earthquake increases by √1000 or 31.6 times. If the magnitude increases by 2, the energy of the earthquake increases 1000 times.
Besides the Richter magnitude, “moment magnitude” is used. “Moment magnitude” is based on the product of the area of the fault plane causing the earthquake at the epiceter and the quantity of the shift, and represents the size or energy of a fault movement.
|