ページの先頭です。
本文へジャンプする。
【Important Notices】This page is an archive page of information published in the past. Since the update has been completed, it may contain broken links or outdated information. For the latest information, please use the new site Earth-graphy (earth.jaxa.jp).
ここからサイト内共通メニューです。
サイト内共通メニューを読み飛ばす。
サイト内共通メニューここまで。
ここから本文です。

Seen from Space 2004

Powerful and Major Typhoon DIANMU Approaching

 
Fig. 1 Typhoon DIANMU acquired by AMSR-E (June 18, 2004)

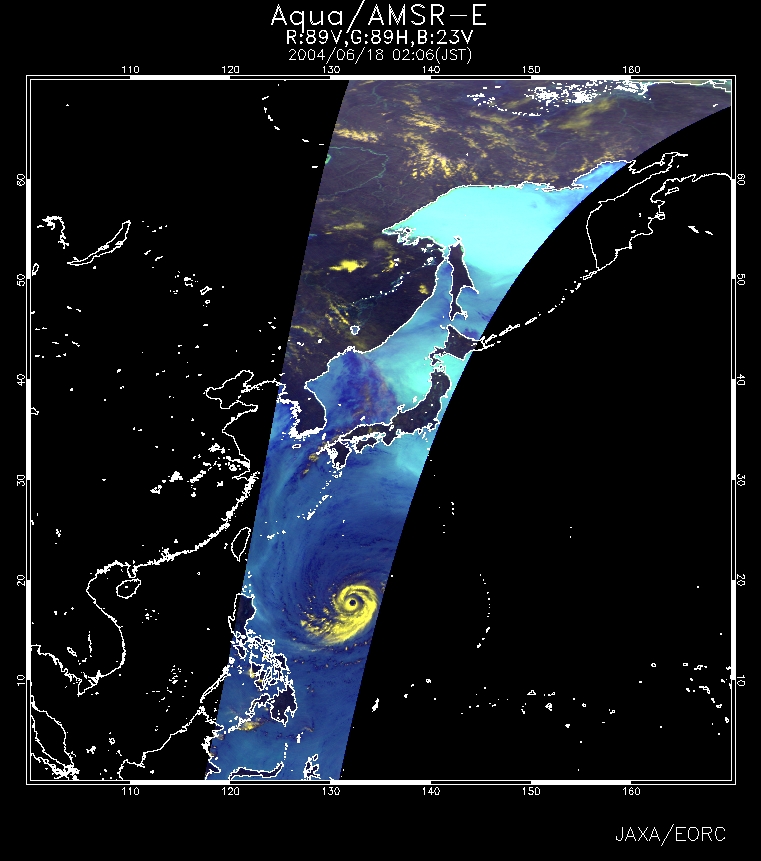
Typhoon DIANMU (NO.6 in 2004) was acquired by AMSR-E, developed by JAXA and flown aboard Aqua, and by TMI flown aboard the Tropical Rainfall Measuring Mission (TRMM).

Figure 1 is an AMSR-E near-real-time image. Dark blue on the sea surface indicates a large volume of water vapor in the atmosphere, and yellow, well-developed clouds. These images can be seen in " Today's Image " on EORC's webpage.


Fig. 2 Precipitation of typhoon DIANMU acquired by TMI (June 18, 2004)

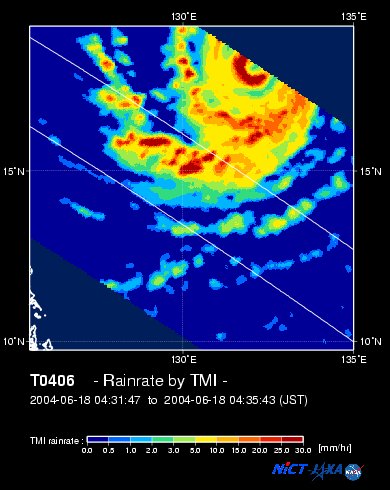
Figure 2 indicates the precipitation as acquired by TMI. In the orange area, the rain is heavy enough to bounce from the ground onto your feet while walking, and in the red area, the rain is so heavy that an umbrella would not prevent you from getting wet. You can see the strong precipitation area in red around the clear eye.


Fig. 3 3D rainfall structure acquired by PR (June 18, 2004)

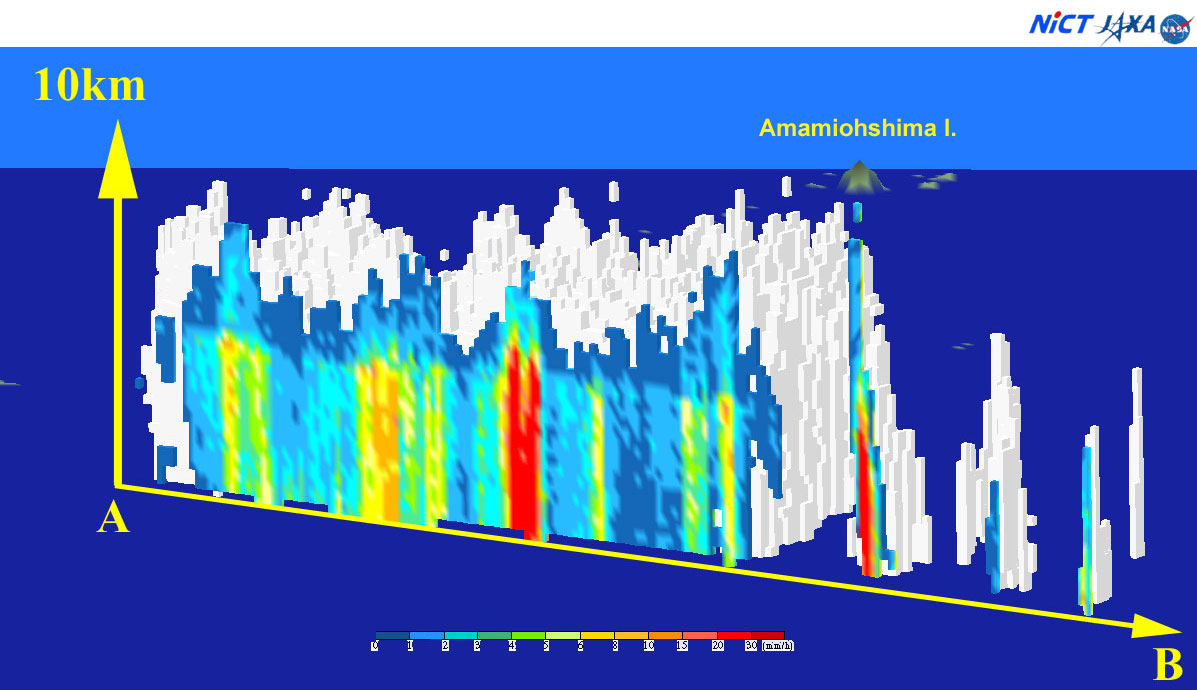
Figure 2 depicts the three-dimensional rainfall structure and the cross- section acquired by PR observation. The top of the rainfall is 8 km high and you can find intense rainfall even in the area far from the eye of typhoon.


Related sites:
TRMM Tropical Cyclone Database
TRMM Tropical Cyclone quick report
AMSR-E Tropical Cyclone quick report
AMSR-E Today's Image

Explanation of the images
Figs. 1
Satellite: Aqua (NASA)
Sensor: AMSR-E (Advanced Microwave Scanning Radiometer for EOS-PM (Aqua)) (JAXA)
Time and date of observation: 02:06 (JST) on June 18, 2004
Figure 1 depicts heavy rainfall area in light yellow,
less atmospheric humidity and cloudy areas in light blue, and heavy atmospheric humidity and cloudy areas in dark blue.

Fig. 2
Satellite: Tropical Rainfall Measuring Mission (TRMM)
Sensor: TRMM Microwave Imager (TMI)
Time and date of observation: 04:35 (JST) on June 18, 2004
Figure 2 depicts precipitation (mm/h)
estimated by microwave radiation from the land surface.

Fig. 3
Satellite: Tropical Rainfall Measuring Mission (TRMM)
Satellite: Precipitation Radar (PR)
Time and date of observation: 04:40 (JST) on June 18, 2004
Figure 3 depicts the three-dimensional rainfall structure (mm/h) acquired by precipitation radar.

本文ここまで。
image:Satellite Navigator
image:Satellite Applications and Operations Center(SAOC)
Earth Data Collection by JAXA Satellites
image:ページTOP