Seen from Space 2004
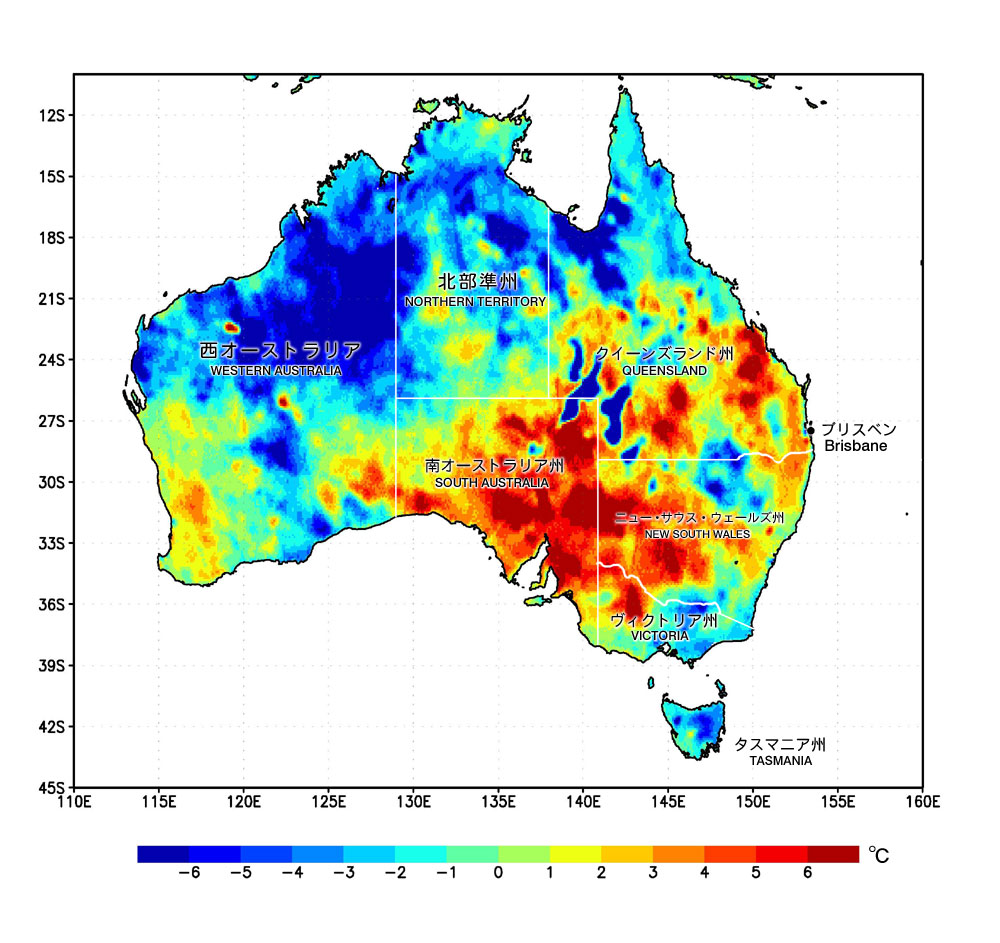
Heat Wave in Australia
AMSR-E captured the heat wave (*1) during February 2004 in southern and eastern Australia. Based on AMSR-E data, the figure indicates the difference between estimated average air temperatures near land surfaces during February 2003 and February 2004. Red and orange indicate where it was warmer in 2004 than in 2003; blue indicates where it was cooler in 2004 than in 2003. You can see that the orange and red parts are distributed in southern and eastern Australia, implying that the air temperature during February 2004 was 3 to 6 degrees Celsius higher than that in the past year. The Australian Bureau of Meteorology reported that they observed the heat wave and/or air temperature above 45 degrees Celsius in Queensland, New South Wales, northern Victoria and South Australia during February 2004. The local news reported that the heat wave was responsible for the deaths of twenty people near Brisbane, Queensland. On the other hand, the bureau reported that it was cooler in northwestern Australia and Tasmania compared with an average year. The blue areas (where it was cooler in 2004) near the border between Queensland and South Australia are thought to be valleys where there was some precipitation in February 2004. The red areas in Western Australia might not represent actual air temperature but may be noise interference from signals on the ground at the same frequency as AMSR-E. (*1) The Australian Bureau of Meteorology defines a "heat wave"as several consecutive days of above average temperature for a particular location. (*2) AMSR-E is a radiometer that observes microwaves from the Earth's surface in six frequency bands. We estimated air temperature in Australia using AMSR-E (10 GHz band vertical polarization data here) because microwaves radiated from the Earth vary with the temperature of the Earth's surface. (*3) More precisely, AMSR-E estimates brightness temperature of the land surface and the atmosphere just above the land surface, which can be equal to the air temperature just above the land surface. Explanation of the image Satellite: Aqua (NASA) Sensor: AMSR-E (Advanced Microwave Scanning Radiometer for EOS-PM (Aqua)) (JAXA) Date of observation: February 2003 and February 2004 Related topics: Heat Wave in Europe |