Seen from Space 2003
European Heat Wave in Summer '03 Also Affected Sea Temperatures
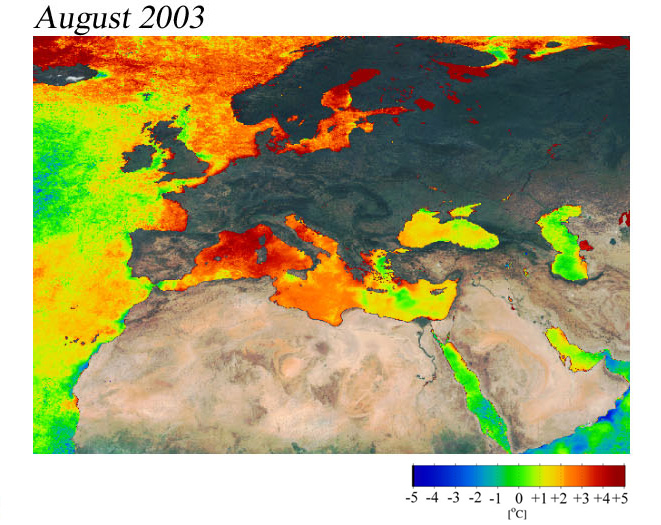
As reported in the article " The Heat Wave in Europe" on our home page in August '03, AMSR-E data revealed very high land-surface temperatures in Europe. In this article, we report that GLI data also revealed unusually high sea-surface temperatures around Europe, especially in the Mediterranean Sea. This image shows the differences in the sea-surface temperatures around Europe between the monthly mean values in August '03 and the nominal value, the average sea-surface temperatures in August from 1971 to 2000. Red, yellow and green indicate sea and lake areas; dark areas indicate land. Most sea areas have sea-surface temperatures above the nominal value. In the Mediterranean Sea across the south of France through the west of Italy, the temperatures were 3 to 4 degrees Celsius higher than the average. In the summer '03 (from June to August), most of Europe suffered the hottest heat wave ever recorded. The average air temperatures in this season eclipsed the previous record set in 1757. A shocking report indicated that France experienced the highest heat wave this summer. Peak daytime temperatures were about 10 degrees Celsius higher than usual, and as many as 15,000 people were killed. The death toll in Europe due to the heat wave was estimated at over 19,000. The heat wave in Europe not only caused serious human suffering but also damaged the economy. Throughout France, Spain, Portugal and Italy, the intense heat and the dry conditions sparked large wildfires. Moreover, severe water shortages, withering crops and decimated livestock were common across Europe. This damage cost the European economy an estimated billions of dollars. In spite of such havoc, the wine industry seems to be the bright spot. Although the heat wave have led to the earliest harvest in more than a century and significantly smaller crops than usual, vintners are predicting excellent quality, particularly in red varieties. Explanation of image Sensor: Global Imager (GLI) Observation period: August 1 to 31, 2003 In the sea area, the temperature indicates the difference between the average of August 2003 acquired by GLI and August temperatures for 1971 to 2000 (Reynolds and Smith (1995)). The sea-surface temperature was derived from thermal infrared channel (channels 34, 35, and 36) data, after making a cloud-free image by removing highly reflective sea areas with visible channels 8 (545nm) and 19 (865nm) and removing sea areas with high water vapor content with thermal infrared channels 34 (8.6µm), 35 (10.8µm), and 36 (12.0µm). The land area was composed by allocating the minimum reflectivity for a month of GLI visible channels 13 (678nm), 8 (545nm), and 5 (460nm) to red, green, and blue, which is just like a cloud-free Earth surface seen from space. |