Next is a color-composite image acquired by SAR that can observe under any climate (*2). We colored for forests greenish yellow; mountains blue; vegetation like paddy rice, which grows in dry-season and is covered with water in rainy-season, red; and water areas like seas, lakes, rivers, wetlands, and rice paddies, black. Various colors of Mekong Delta represent the conditions of the paddies' growth. From these images, we can obtain information on forest biomass, crop growth conditions, water level of rice paddies, rivers, and lakes, and estimate the amount of marsh gas.
The Earth Observation Research Center (EORC) is conducting a research program to find an analysis method to utilize the data in a complementary way. The program is called the Kyoto & Carbon Initiative (For additional information, visit here .). The program makes full use of the characteristics of optical sensor GLI and SAR, and international research communities are contributing to quantifying the global carbon cycle, such as forest monitoring for the Kyoto Protocol, and the Intergovernmental Panel on Climate Change (IPCC). This project is an important theme that promotes multiple utilization of GLI on Midori-II and the Advanced Land Observing Satellite (ALOS), which is scheduled to be launched next year.
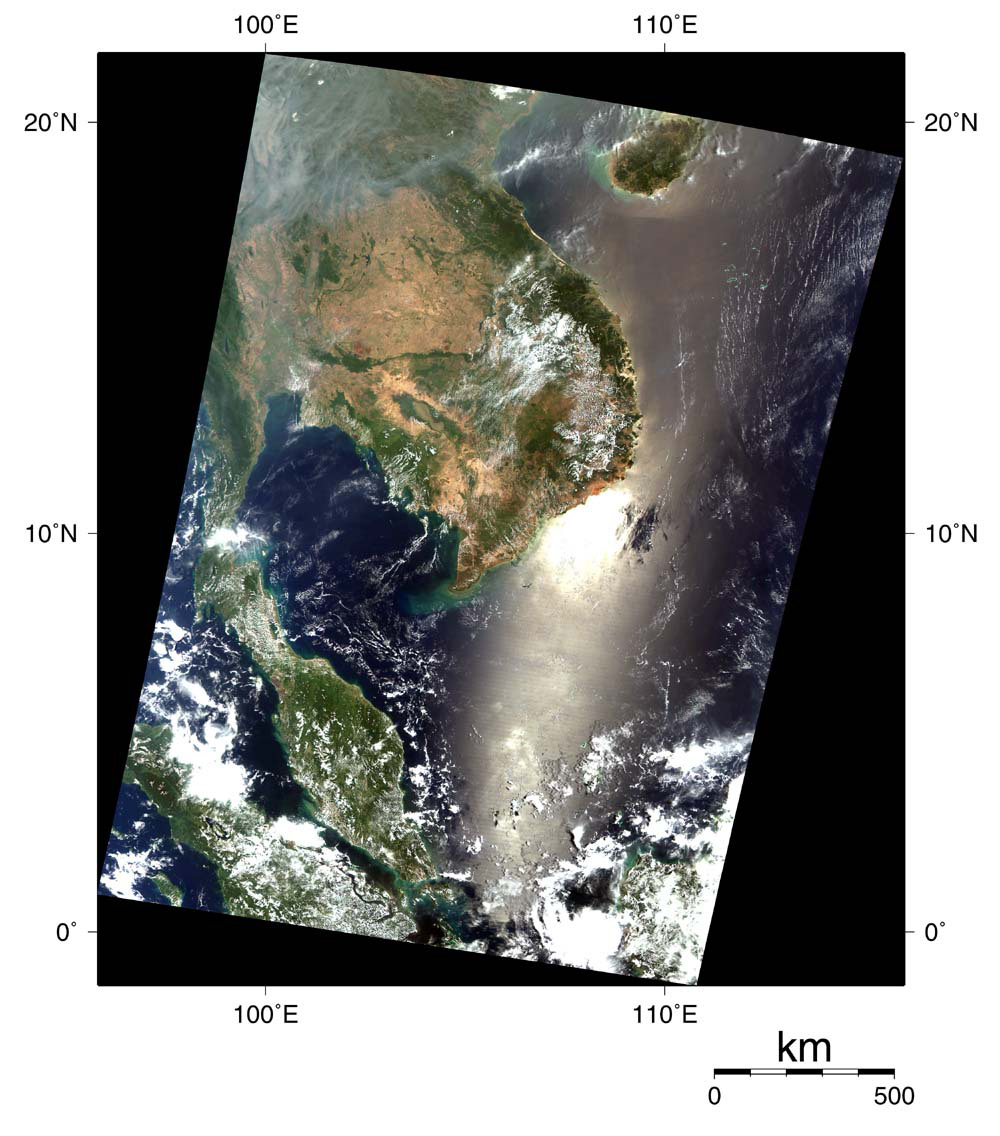
*1.
This image was acquired by GLI using a 1km resolution spectral channel with a 1,600km observational width on April 13, 2003. GLI can acquire this whole area in one observation from a polar orbit over Indochina.
*2.
This is a composite image made from images of SAR on Japanese Earth Resources Satellite-1 "Fuyou" (JERS-1) during January and February 1997 (dry season), and August 1998 (rainy season) using 18m resolution spectral channel in 75km observational width. This mosaic image can be made by arranging strip images acquired from a polar orbit that shifts west every day. First, we make two images, (i) dry season (January and February 1997) and (ii) rainy season, which express the back scattering intensity of radar through brightness of color. We then, make a radar texture image (from the dry season image)(iii), which expresses the ratio of the standard deviation to the mean value of back scattering intensity through brightness of color, each region of 8 lines x 8 pixel rows lined up with the interval of 12.5 meters. In this image, mountain ranges with complex topography look bright, and flat plains look dark. We made this composite image by coloring (i) with red, (ii) with green, and (iii) with blue. We are planning to distribute CD-ROMs of these JERS-1/SAR composite images of Southeast Asia without charge soon. (For additional information about the Global Forest Mapping Program, visit here .).
|