Seen from Space 2021
Eruption of La Soufrière volcano in St Vincent
La Soufrière volcano in "Saint Vincent and the Grenadines" located in the Caribbean Sea erupted on April 9, 2021 for the first time in over 40 years. For this eruption, JAXA/EORC introduces observation results by Advanced Land Observing Satellite-2 "DAICHI-2" (ALOS-2) and Global Change Observation Mission - Climate "SHIKISAI" (GCOM-C).
Observation results around the crater by "DAICHI-2"(ALOS-2)
Figure 1 shows the location of La Soufrière volcano and the observation area by Phased Array type L-band Synthetic Aperture Radar-2 (PALSAR-2) onboard ALOS-2.
Figure 2 shows the images around the crater of La Soufrière volcano before and after eruption (April 7, 2021/April 21, 2021) captured by ALOS-2. These are false color composite images of data observed in high resolution 10m mode (dual polarization), with HH polarization allocated to purple and HV polarization allocated to green. The upward direction of the image is the same direction of satellite at the time of observation (approximately west-southwest). Based on the principal of synthetic aperture radar, this direction of the image is suitable for interpreting landform three-dimensionally. There were two lava domes, old and new one inside caldera before eruption, however, both domes were destroyed by explosive eruption this time. It is likely that parts of them spread into the sky as a large amount of volcanic plume.
Figure 3 is an animation of ALOS-2 image starting from January 2021 to the eruption in April. The new lava dome has gradually expanded from January to April. Both old and new lava domes were destroyed by the eruption.
Figure 4 is an image called "coherence image", which is obtained by the same data before and after eruption as Fig. 2. Coherence shows similarity of the image and it is known that in case volcanic ash deposits, the value decreases (the color become darker). From this image, we can find that most of the areas except the southern part of the island are covered with volcanic ash.
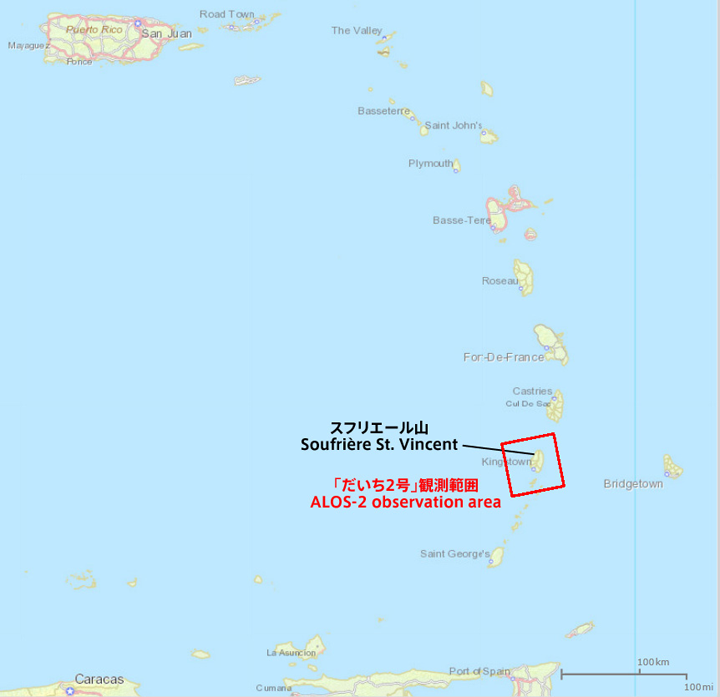
Figure 1. The location of La Soufrière volcano and the observation area by ALOS-2
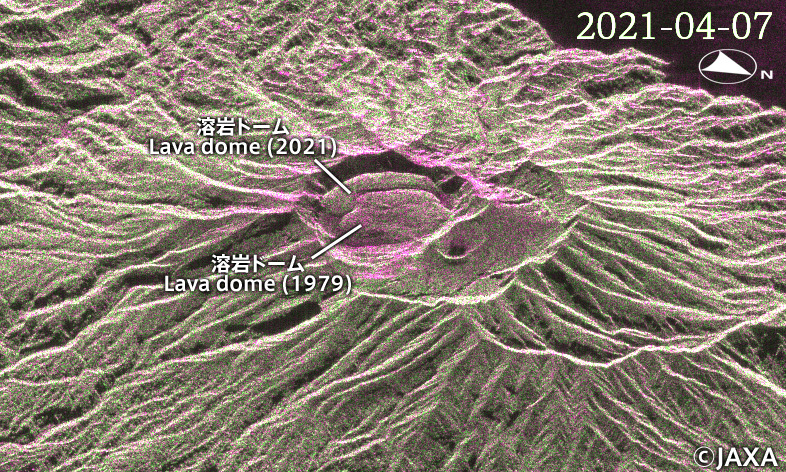
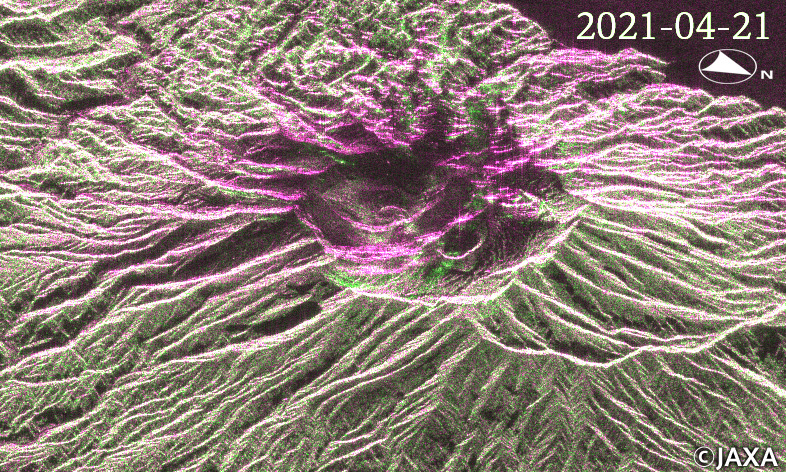
Figure 2. ALOS-2 images observed before(left) and after(right) the eruption of Soufrière St. Vincent volcano
Figure 3. Animation of ALOS-2 image from January 13 to April 21, 2021 (every 14 days)
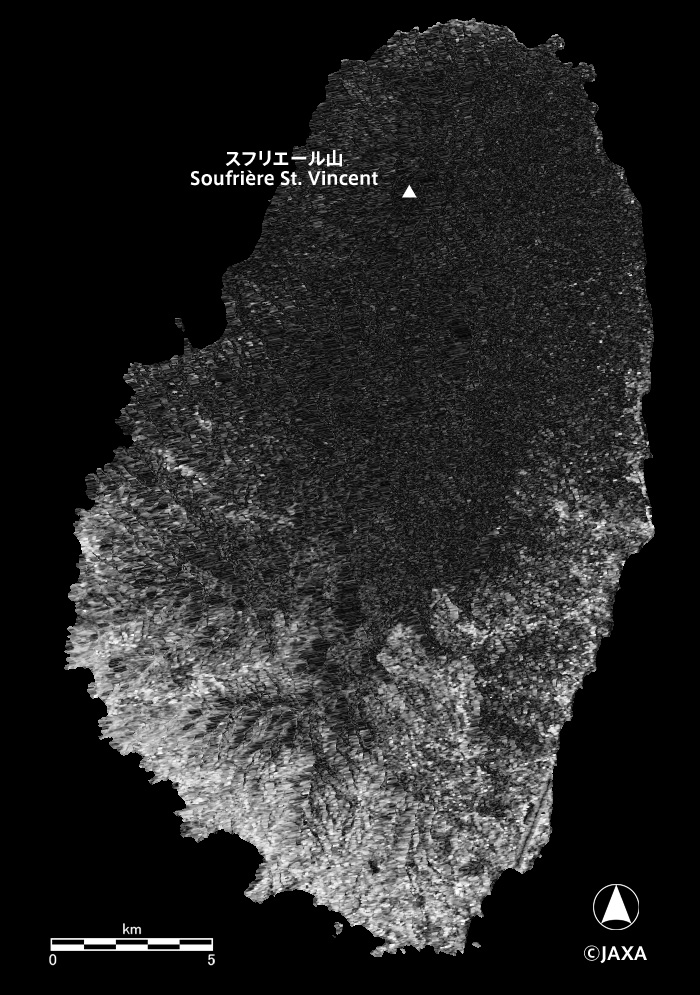
Figure 4. The coherence image using ALOS-2 data on April 7 and 21, 2021. Dark parts of the image broadly correspond to ash fall areas.
Observation results of volcanic plume by "SHIKISAI"(GCOM-C)
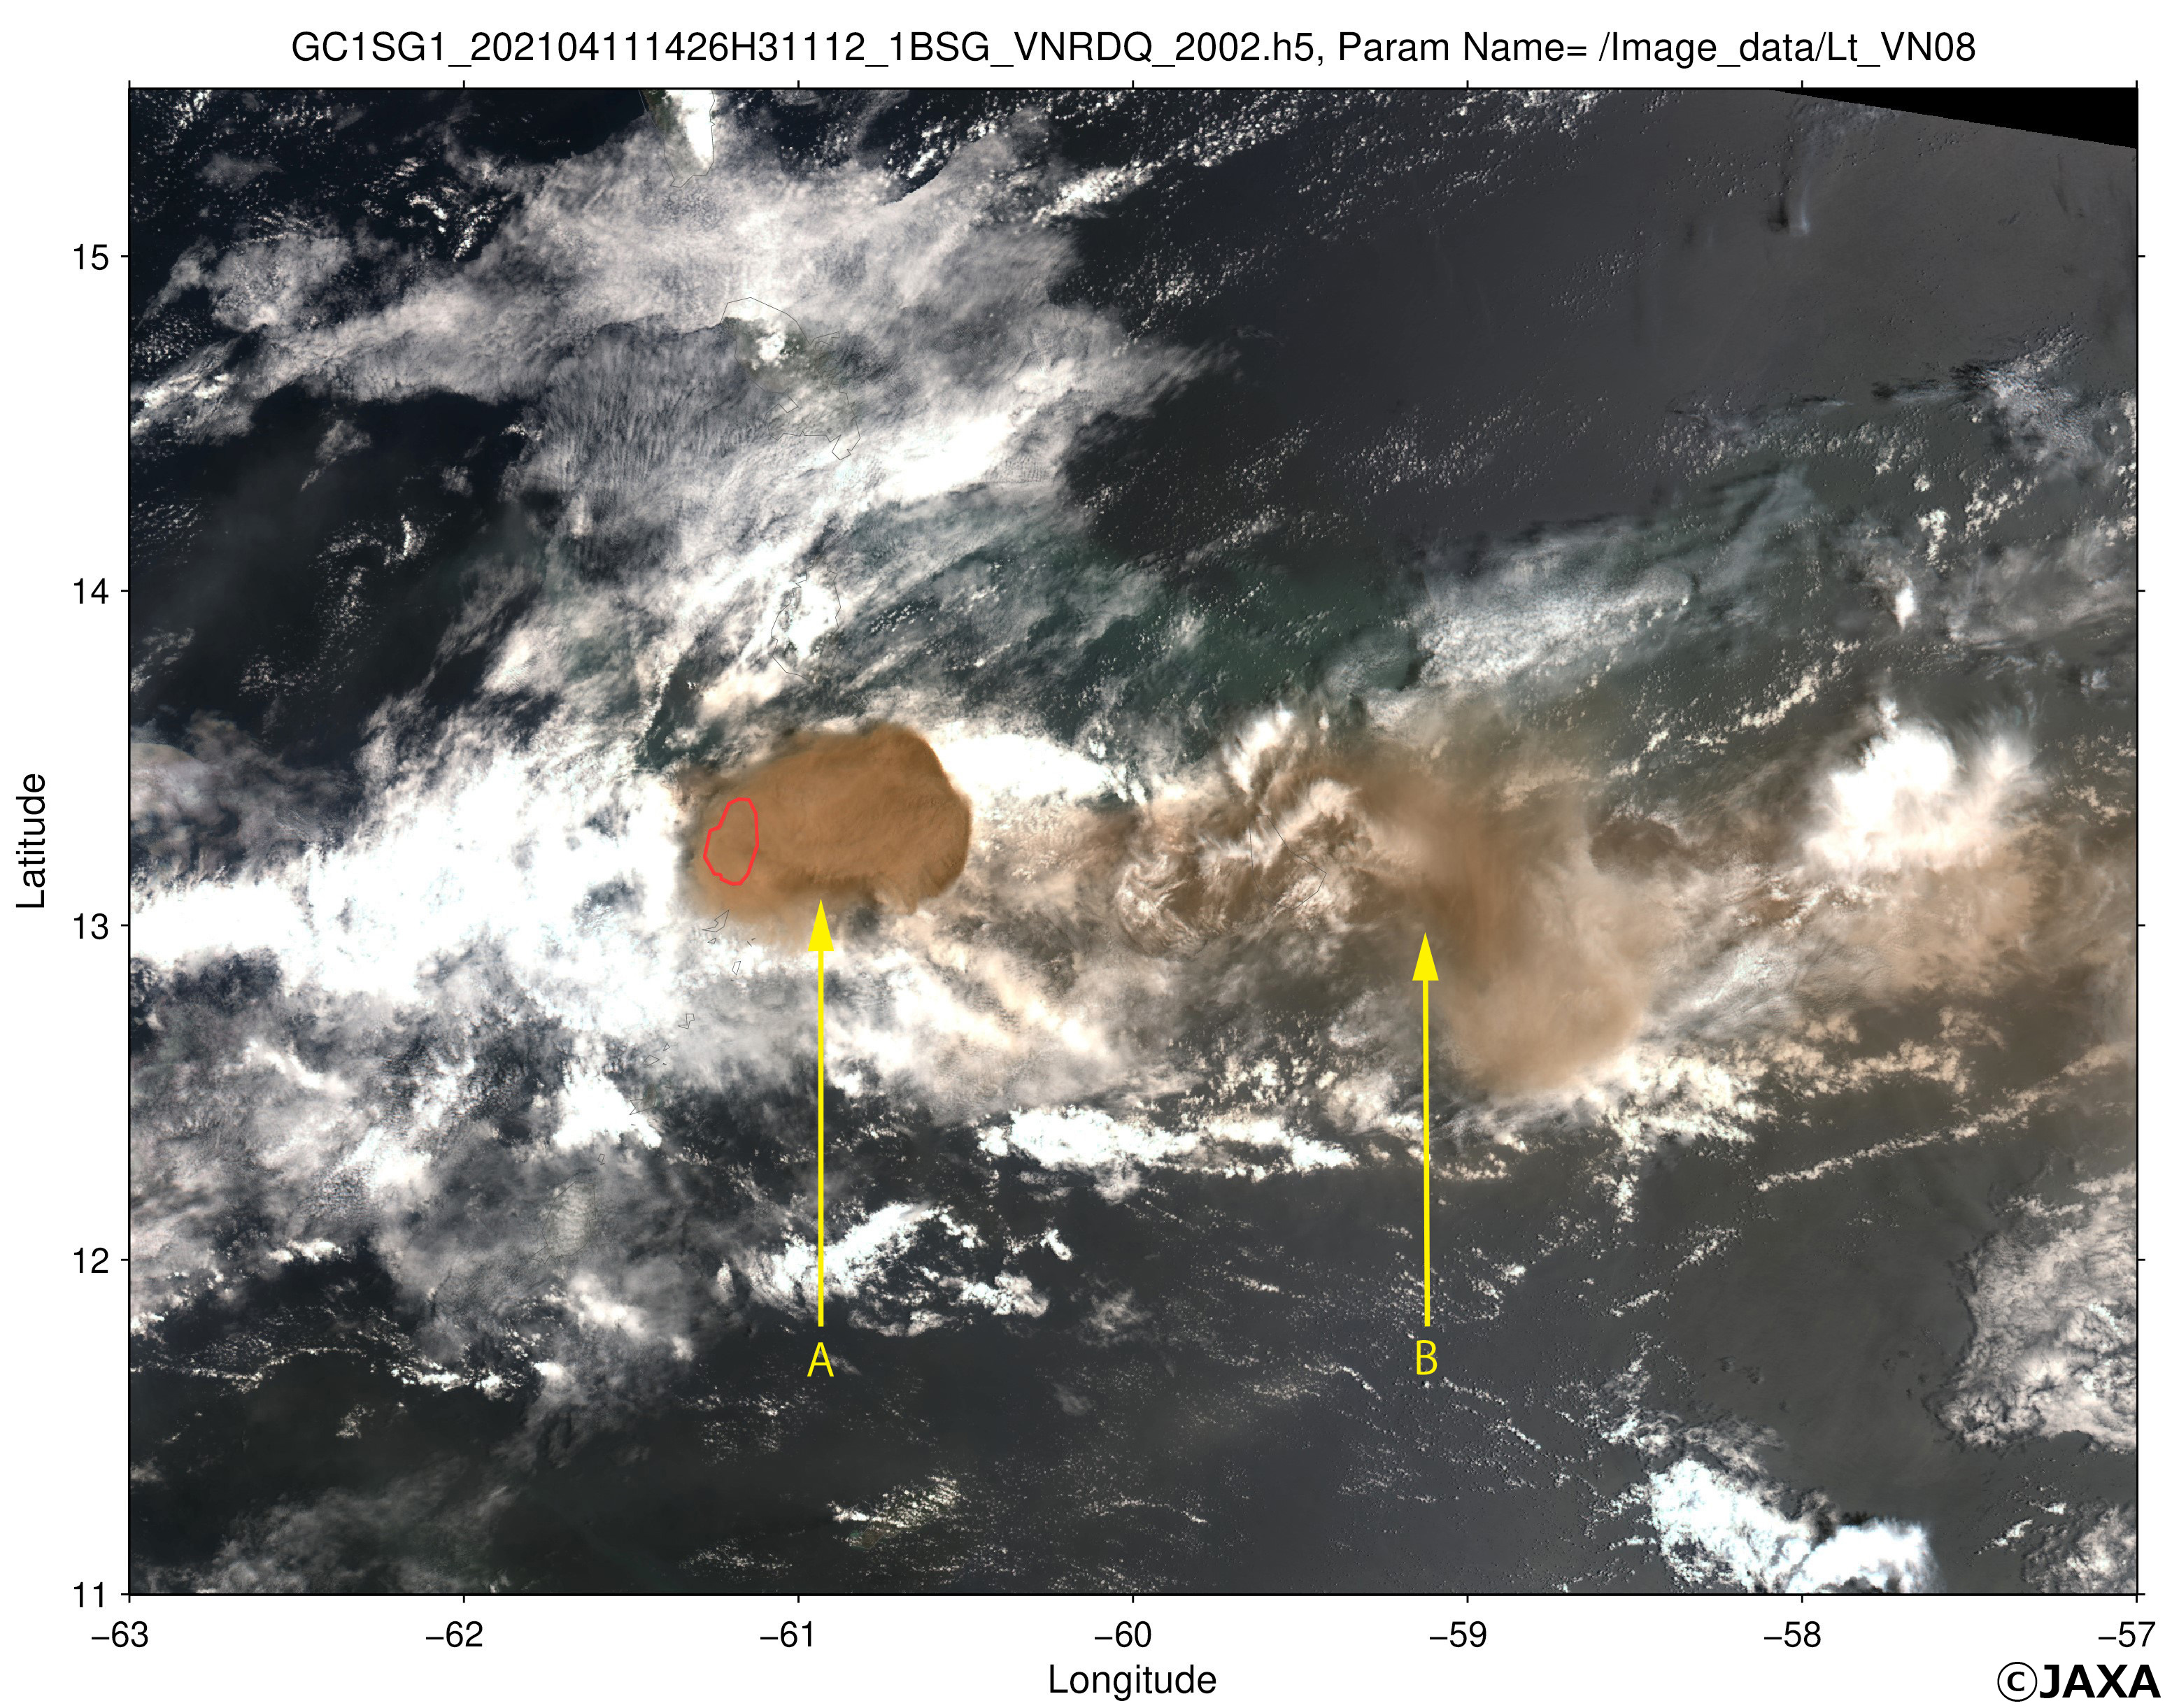

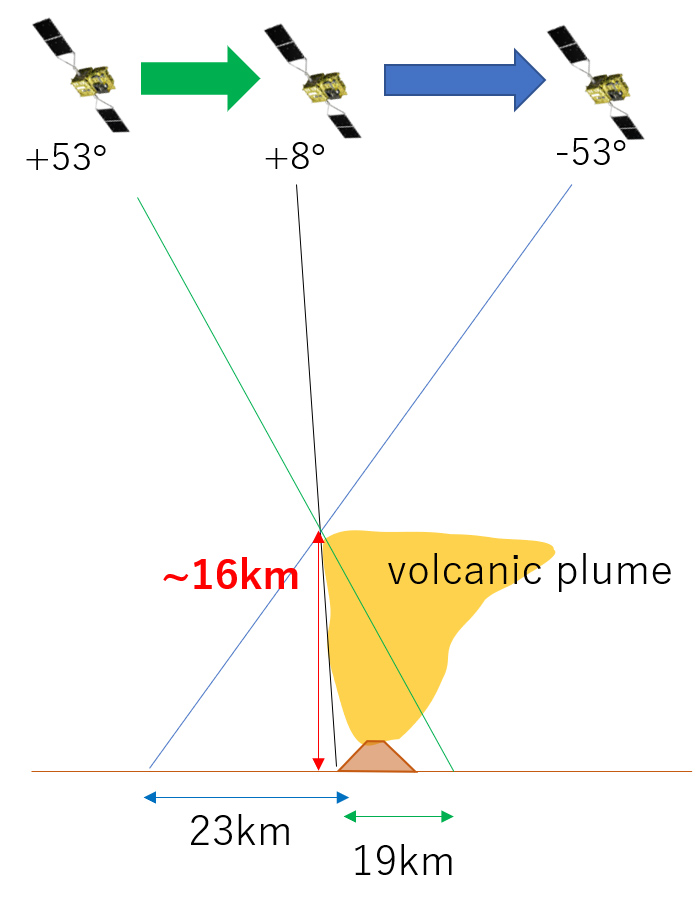
Figure 6. Animation by observation images of forward viewing, nadir viewing and backward viewing at wavelengths of 867nm captured by SGLI onboard GCOM-C around 14:26 on April 11, 2021 UTC (left) and the schematic figure of observation angle (zenith angle) of forward, nadir and backward (right). The flight direction of satellite roughly corresponds to the direction from upper right to lower left in the left figure.
It is known that volcanic plumes not only deposit volcanic ash in neighboring area, but also affect airplane operations, and in case small particles of volcanic ash and volcanic gases such as sulfur dioxide are transported to altitude of stratosphere, they have effect to block solar insolation remaining in the atmosphere for a while as aerosols.
Figure 5 is the RGB image observed by SGLI onboard GCOM-C. On slightly east side of the sky above St. Vincent Island (indicated by the red border line), we can see volcanic plume as dark brown color ("A" in the fig. 5), which seems to be erupted on the day. Since the image was observed from almost the zenith direction (satellite zenith angle: about 8 degree), the raised plume can be clearly distinguished with the surrounding clouds, which appear white. Light brown color part in the east side seems to be volcanic plume, which had erupted shortly before the observation by SGLI and was swept away by the wind ("B" in the fig. 5). SGLI has function of multi-angle observation toward orbital direction (fig. 6) and we can estimate the altitude of the volcanic plume by investigating the apparent displacement for the multiple viewing angles. Regarding the volcanic plume (A), change of the apparent displacement on the image at three observation angles were about 19 km between the forward view and the nadir view (+8 degree), and about 23 km between the nadir view and the backward view (+53 degree). So the altitude of this volcanic plume was estimated to be about 16 km. (SGLI has observation channel for thermal infrared bands (11µm and 12µm) and the oxygen molecule absorption band (763nm), and almost same altitudes were estimated by the both ways.) This altitude corresponds approximately to the upper edge altitude of troposphere in tropical area, so it was supposed that part of the volcanic plume reached to the altitude of stratosphere. If emission of large-scale volcanic plume continues for a long time, there is a possibility that the aerosols in the stratosphere would affect air temperature by reflecting the solar irradiance. It is important to continue careful monitoring by using the various observation methods.
Explanation of the Images
Figures 2 and 3
| Satellite | Advanced Land Observing Satellite-2 "DAICHI-2" (ALOS-2) |
|---|---|
| Sensor | Phased Array type L-band Synthetic Aperture Radar-2 (PALSAR-2) |
| Date | January 13 - April 21, 2021 |
Figure 4
| Satellite | Advanced Land Observing Satellite-2 "DAICHI-2" (ALOS-2) |
|---|---|
| Sensor | Phased Array type L-band Synthetic Aperture Radar-2 (PALSAR-2) |
| Date | April 7, 2021 and April 21, 2021 |
Figures 5 and 6
| Satellite | Global Change Observation Mission - Climate "SHIKISAI" (GCOM-C) |
|---|---|
| Sensor | Second generation GLobal Imager (SGLI) |
| Date | April 11, 2021 around 14:26 (UTC) |


