Seen from Space 2020
Typhoons landed in the Philippines and Vietnam one after another...the heavy rainfalls observed by satellites
Under the Global Precipitation Measurement (GPM) project, JAXA has been observing global precipitation from space using the Global Satellite Mapping of Precipitation (GSMaP), which was created by combining multi satellites such as Global Change Observation Mission - Water "SHIZUKU" (GCOM-W) and utilizing the Dual-frequency Precipitation Radar (DPR) as the core calibrator. This article reports on satellite observations of rain and water vapor for several typhoons that are causing serious water-related disasters in the Philippines and Vietnam during October and November 2020.
Typhoons landed in the Philippines and Vietnam one after another
Each track for tropical storms (TS) No. 15-20 in 2020 (T2015-T2020) is shown in Fig. 1. Four tropical storms continually landed in Vietnam from the South China Sea from mid- to late October (Here after all represents UTC). Also, Super Typhoon (STY) "GONI"(T2019), which occurred in the East Sea of the Philippines in late October, made landfall in the Philippines in November, causing extensive damage in Luzon and other areas. Soon after, TS "ATSANI" (T2020) passed north of the Philippines and turned into a tropical depression over the west-southwest coast of Taiwan.
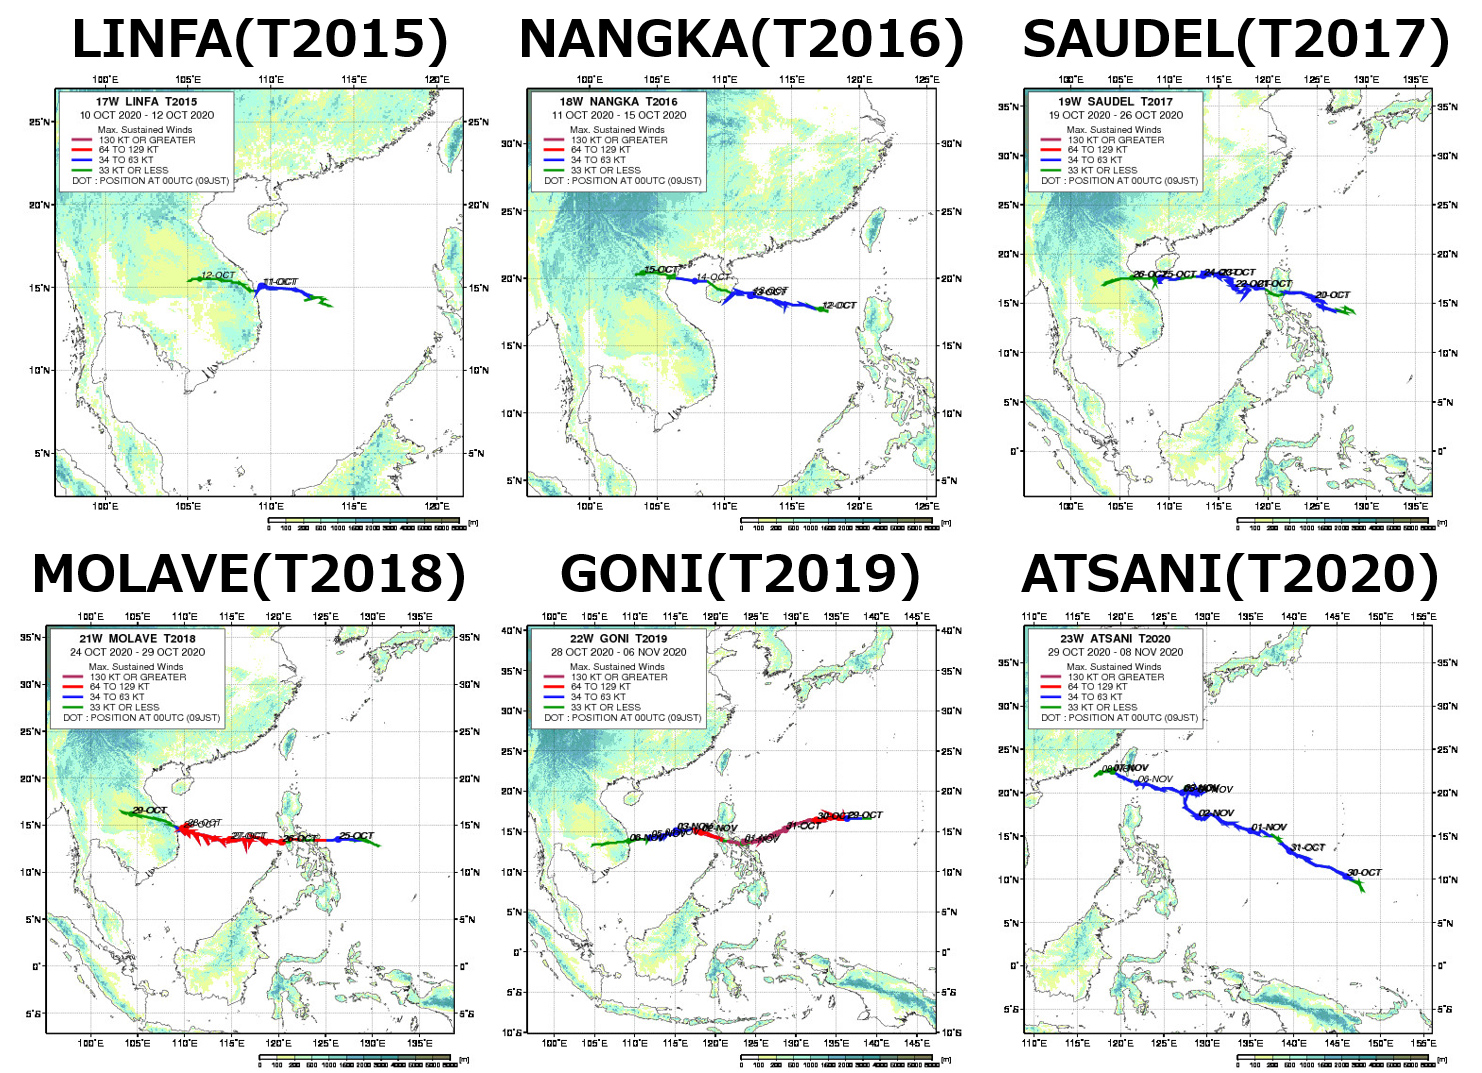
Figure 1. Track maps for tropical storms No. 15-20 in 2020 (T2015-2020) by JAXA/EORC Tropical Cyclone Database
(original data : Japan Meteorological Agency and University of Wisconsin "CIMSS Tropical Cyclones Page")
Figure 2 shows time series of rainfall with multiple typhoons obtained by GSMaP. We can find the situation that tropical cyclones passed through the Philippines and Vietnam one after another with heavy rains from the middle of October to the beginning of November. As of November 10, 2020, TS "ETAU" (T2021) and Typhoon "VAMCO" (T2022) are still occurring. (Realtime map can be seen on the GSMaP website "JAXA Realtime Rainfall Watch").
Figure 2. Time series of 3-hourly mean precipitation around the South China Sea by GSMaP
(October 6 - November 6, 2020)
Torrential rains once every 20 years continuously occurred
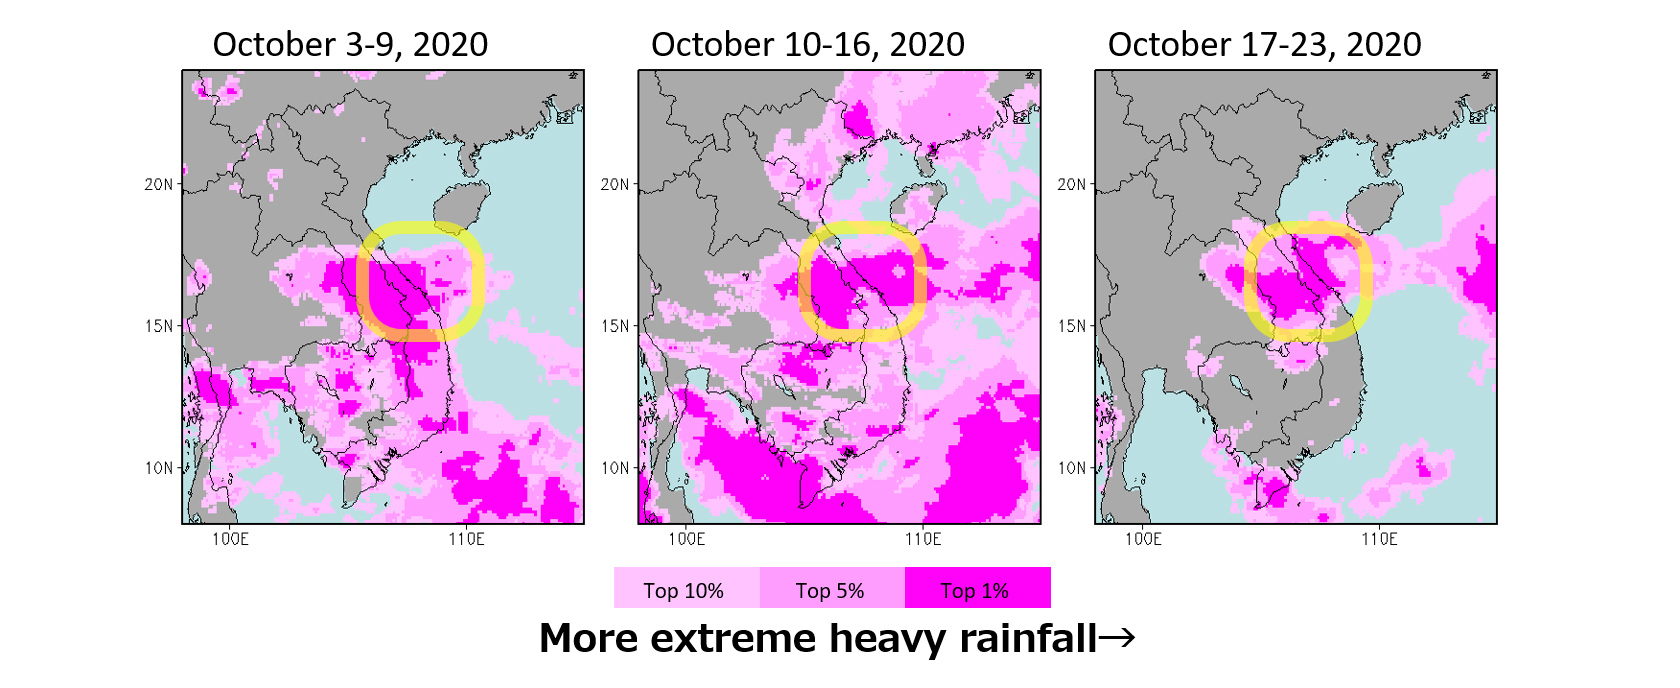
It is possible for GSMaP to statistically analyze rainfall data for the past 20 years because long-term data is available for more than 20 years. Figure 3 shows the extreme heavy rainfall index during the period of heavy rainfall in Vietnam in October. There are continuous rainfall areas shown as darkest pink in central Vietnam that is comparable to the heaviest rainfall which has only occurred once in the past 20 years. We can see the condition that long-term continuous heavy rain was occurring from early to middle and end of October 2020.
Along with the rain data from GSMaP, we used the Japan Meteorological Agency (JMA)'s long-term reanalysis of near-surface winds (Japanese 55-year Reanalysis; JRA-55) to examine the differences from the climatological normal. Figure 4 focuses on the 20 days in October 6-25, in which Central Vietnam had especially much rain. It shows the result of characteristics in the year 2020 compared to the average condition of rain and wind.
As for the precipitation (shown in color), the mean rainfall over the past 20 years has been relatively heavy in central Vietnam, as shown by the yellow circle in Figure 4 (Fig. 4, left), but it was particularly heavy in 2020 (Fig. 4, center). Looking at the difference from the normal year (Fig. 4, right), we can see that it rained more than 75 mm per day on average in 2020 compared to the same period in the past, mainly in central Vietnam.
Looking at winds (indicated by vectors) near the ground (925 hPa surface), northeasterly winds blowing from the East China Sea to the South China Sea dominate in normal years (Fig. 4, left), but these winds were particularly strong in 2020 (Fig. 4, center). The difference from the normal year suggests that the cyclonic circulation in the South China Sea is strengthening (Fig. 4, right).
![Daily rainfall [mm/day] (color) by GSMaP and wind (vector) near the ground (925 hPa surface) by JMA's JRA-55 during October 6-25.](images/tp201113_03.jpg)
The amount of water vapor was 1.3 times higher than normal in the South China Sea
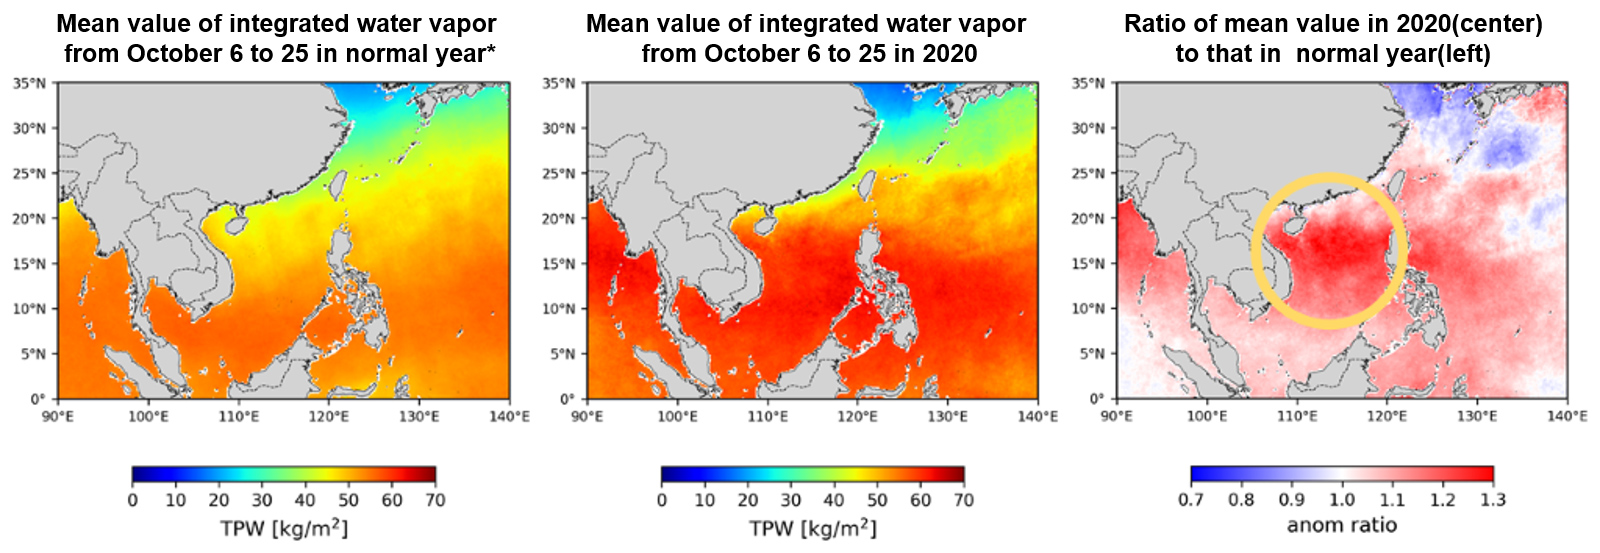
Moreover, we can find out how much the amount of water vapor in the atmosphere, which is the source of rain, compared with normal year during this period by Advanced Microwave Scanning Radiometer 2 (AMSR2) onboard Global Change Observation Mission - Water "SHIZUKU"(GCOM-W). Figure 5 shows the mean value of vertically integrated water vapor content in normal year (Fig. 5, left), the mean value in 2020 (Fig. 5, center), and the anomaly ratio (Fig. 5, right) for the same area and period (20 days from October 6 to 25) as in Figure 4. The anomaly ratio is shown as the observed value in 2020 divided by the normal value. An anomaly ratio of "1" indicates that condition is same as normal year, while a ratio greater than 1 indicates an above normal. Integrated water vapor content was about 10kg/m2 higher at this period of 2020 (Fig. 5, center) compared with normal year (Fig. 5, left) in the South China Sea. Looking at the anomaly ratio (Fig. 5, right), we can find that the offshore area in central Vietnam had about 1.3 times as much water vapor as normal.
Severe floods occurred in the center of Vietnam
By utilizing GSMaP, we can monitor the status of rainfall. However, from the perspective of disaster prevention, it is important to provide the information at an appropriate time not only on the amount and location of rainfall, but also on when, where, and how much the rainwater collects, and whether there is an actual risk of river flooding or not. In order to do this, the integration of observation and computer simulation is essential.
JAXA has developed terrestrial hydrological simulation system, "Today's Earth - Global(TE-Global)" jointly with the University of Tokyo. TE-Global makes it possible to monitor the estimated result of river discharge and flooded area etc. all over the world every three hours with 0.25-deg.(lat/lon) resolution. Figure 6 shows an animation of daily-averaged river discharge (left) and its "return period" (right) estimated by TE-Global in October 2020. In the river discharge animation, we can see how the river discharge increases with the landfall of multiple typhoons and how it dynamically flows from upstream to downstream. However, this information alone does not allow us to evaluate which areas were actually in danger. "Return period" is one index of "how extreme the current event was" based on past statistics. By monitoring this, we can understand the areas which were actually at high risk of flooding. In animation, continues high return period (means much extreme phenomenon) is estimated around central Vietnam. It is correspondent with the distribution of heavy rainfall observed by GSMaP in Figure 6. Also, it is consistent with the distribution of the states which were suffered from flood damage reported by the United Nations, "Viet Nam: Floods, Landslides and Storms" released on October 28.
Figure 6. Animation of daily river discharge (left) and its return period (right) estimated by land surface simulation system, "TE-Global" in October 2020. In the return period animation, the warmer color shows that the river discharge was estimated to be extremely large compared to the normal value.
Three-dimensional structure of rainfall associated with Super Typhoon "GONI", which caused extensive damage in the Philippines.
Even after the flood in the center part of Vietnam happened on October, typhoons happened in a row. STY "GONI" (TS2019) hit the Philippines, causing extensive damage in November, too. Figure 6 shows three-dimensional structure of rainfall associated with STY "GONI" (TS2019) before landfall in the Philippines captured by DPR onboard GPM Core Observatory.
Figure 7. Three-dimensional structure of rainfall associated with Super Typhoon (STY) "GONI" (TS2019) observed by DPR
(October 29, 2020 around 16:46 (UTC))
As describes above, JAXA satellites observe various physical quantities related with "water" on the earth such as rain, water vapor and so on. These satellite observations are utilized climate monitoring in Asia-Pacific region and the numerical weather prediction by JMA. The observations are also useful to our daily life. JAXA will contribute to support serious water-related disasters by continuing these observations in the future.
Explanation of the Images
Figure 2
| Satellite | Global Precipitation Measurement Core Observatory (GPM Core Observatory) |
|---|---|
| Sensor | Global Satellite Mapping of Precipitation (GSMaP) |
| Date | October 6 - November 6, 2020 |
Figure 5
| Satellite | Global Change Observation Mission - Water "SHIZUKU" (GCOM-W) |
|---|---|
| Sensor | Advanced Microwave Scanning Radiometer 2 (AMSR2) |
| Date | October 6 - 25, 2012 - 2019 (left) October 6 - 25, 2020 (center) |
Figure 7
| Satellite | Global Precipitation Measurement Core Observatory (GPM Core Observatory) |
|---|---|
| Sensor | Dual-frequency Precipitation Radar (DPR) |
| Date | October 29, 2020 16:46 (UTC) |


