Seen from Space 2020
Visualization of California wildfires by earth observatory satellites
California in USA has many famous national parks and rich forests. It has experienced many wildfires due to dry condition in summer. California's wildfires occurred on August 16, 2020 records the worst scale damage as of late in September 2020. This kind of wildfires damage our health and economic activity or land ecosystem. Furthermore, it is known to have a big impact to air quality related with the emission of greenhouse gas, such as carbon dioxide and so on. This article analyzes California wildfires with multiple views by JAXA earth observatory satellites and visualizes the background and effect of the wildfires.
The background of wildfires
Thinking about the background of massive wildfires, it contains various factors. This article shows the investigation with focus on two factors as below.
1) Drought in rainy season
California has mainly a Mediterranean climate. From November to winter around March, it is a rainy season. However, there was few rains during January to February 2020 and California faced to record drought. Since the year 1864, it is the first time for California to record rainfall amount as nearly zero in February. JAXA has generated and provided global precipitation data called "Global Satellite Mapping of Precipitation (GSMaP)" using multiple satellite data, such as the Global Precipitation Measurement (GPM) and Global Change Observation Mission-Water "SHIZUKU" (GCOM-W). GSMaP website in EORC provides the statistical index related with drought (SPI: The Standardized Precipitation Index) calculated by GSMaP. Figure 1. shows the result of SPI monthly distribution around California in February 2020. Unlikeground observation, satellites can monitor broader area condition. It is an advantage of satellite observation. According to Figure 1, SPI is less than -1.5 in most part of California. In case the SPI shows its value from -1.5 to -2.0, it indicates "Severe dryness". If SPI is less than -2.0, it indicates "Extreme dryness". So, we can understand that California faced significant drought condition compared with normal year. Under this condition, it is assumed that forests, vegetation and its soil in California could not keep enough moisture in rainy season and had been exceptionally dry condition.
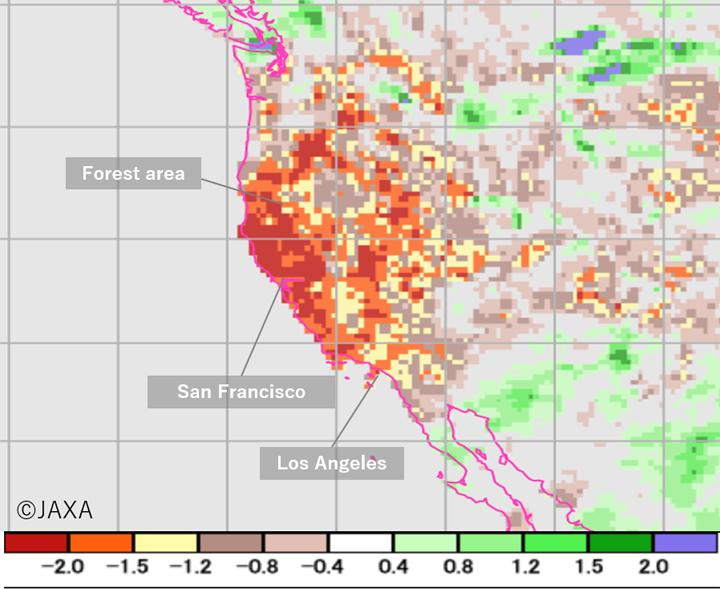
Figure 1. The Standardized Precipitation Index (SPI) (GSMaP) in a month.
SPI of California calculated by GSMaP precipitation amount in February 2020. SPI in most part of California indicates less than -1.5. It shows that California faced significant drought condition compared with normal year.
2) Heat wave
In California, record heat continued from this August to September due to heat wave effect. It was a new record high temperature of 54.4°C in Death Valley National Park on August 16, and 49.4°C in Los Angeles on September 6. Second generation GLobal Imager (SGLI) onboard Global Change Observation Mission - Climate "SHIKISAI"(GCOM-C) can obtain various information by observing 19 wavelengths from near-ultraviolet region to thermal infrared region. Figure 2. is an image of Land Surface Temperature (LST) estimated from infrared band (wavelength 10.8µm, 12.0µm) which observed during daylight from August 8-14, 2020. Red parts show higher temperature. Especially, the land surface temperatures of bare land, fields around forests and shrubby areas exceeded 60°C. Based on the condition that the plants were too dry at that moment, it expected to be fired easily.
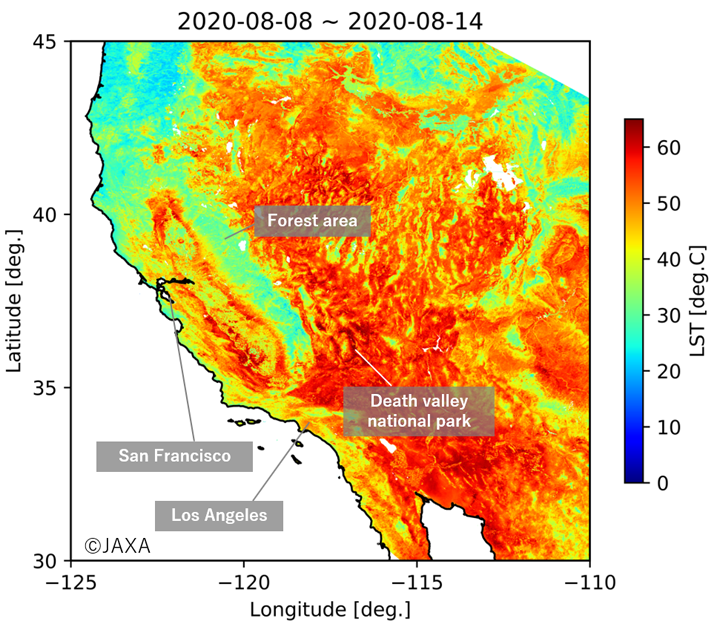
Figure 2. Average Land Surface Temperature (LST) during August 8-14, 2020 observed by "SHIKISAI"
The land surface temperatures of bare land, fields around forests and shrubby areas exceeded 60°C. Based on the condition that the plants were too dry at that moment, it expected to be fired easily at the area just before fires.
Visualization of wildfires
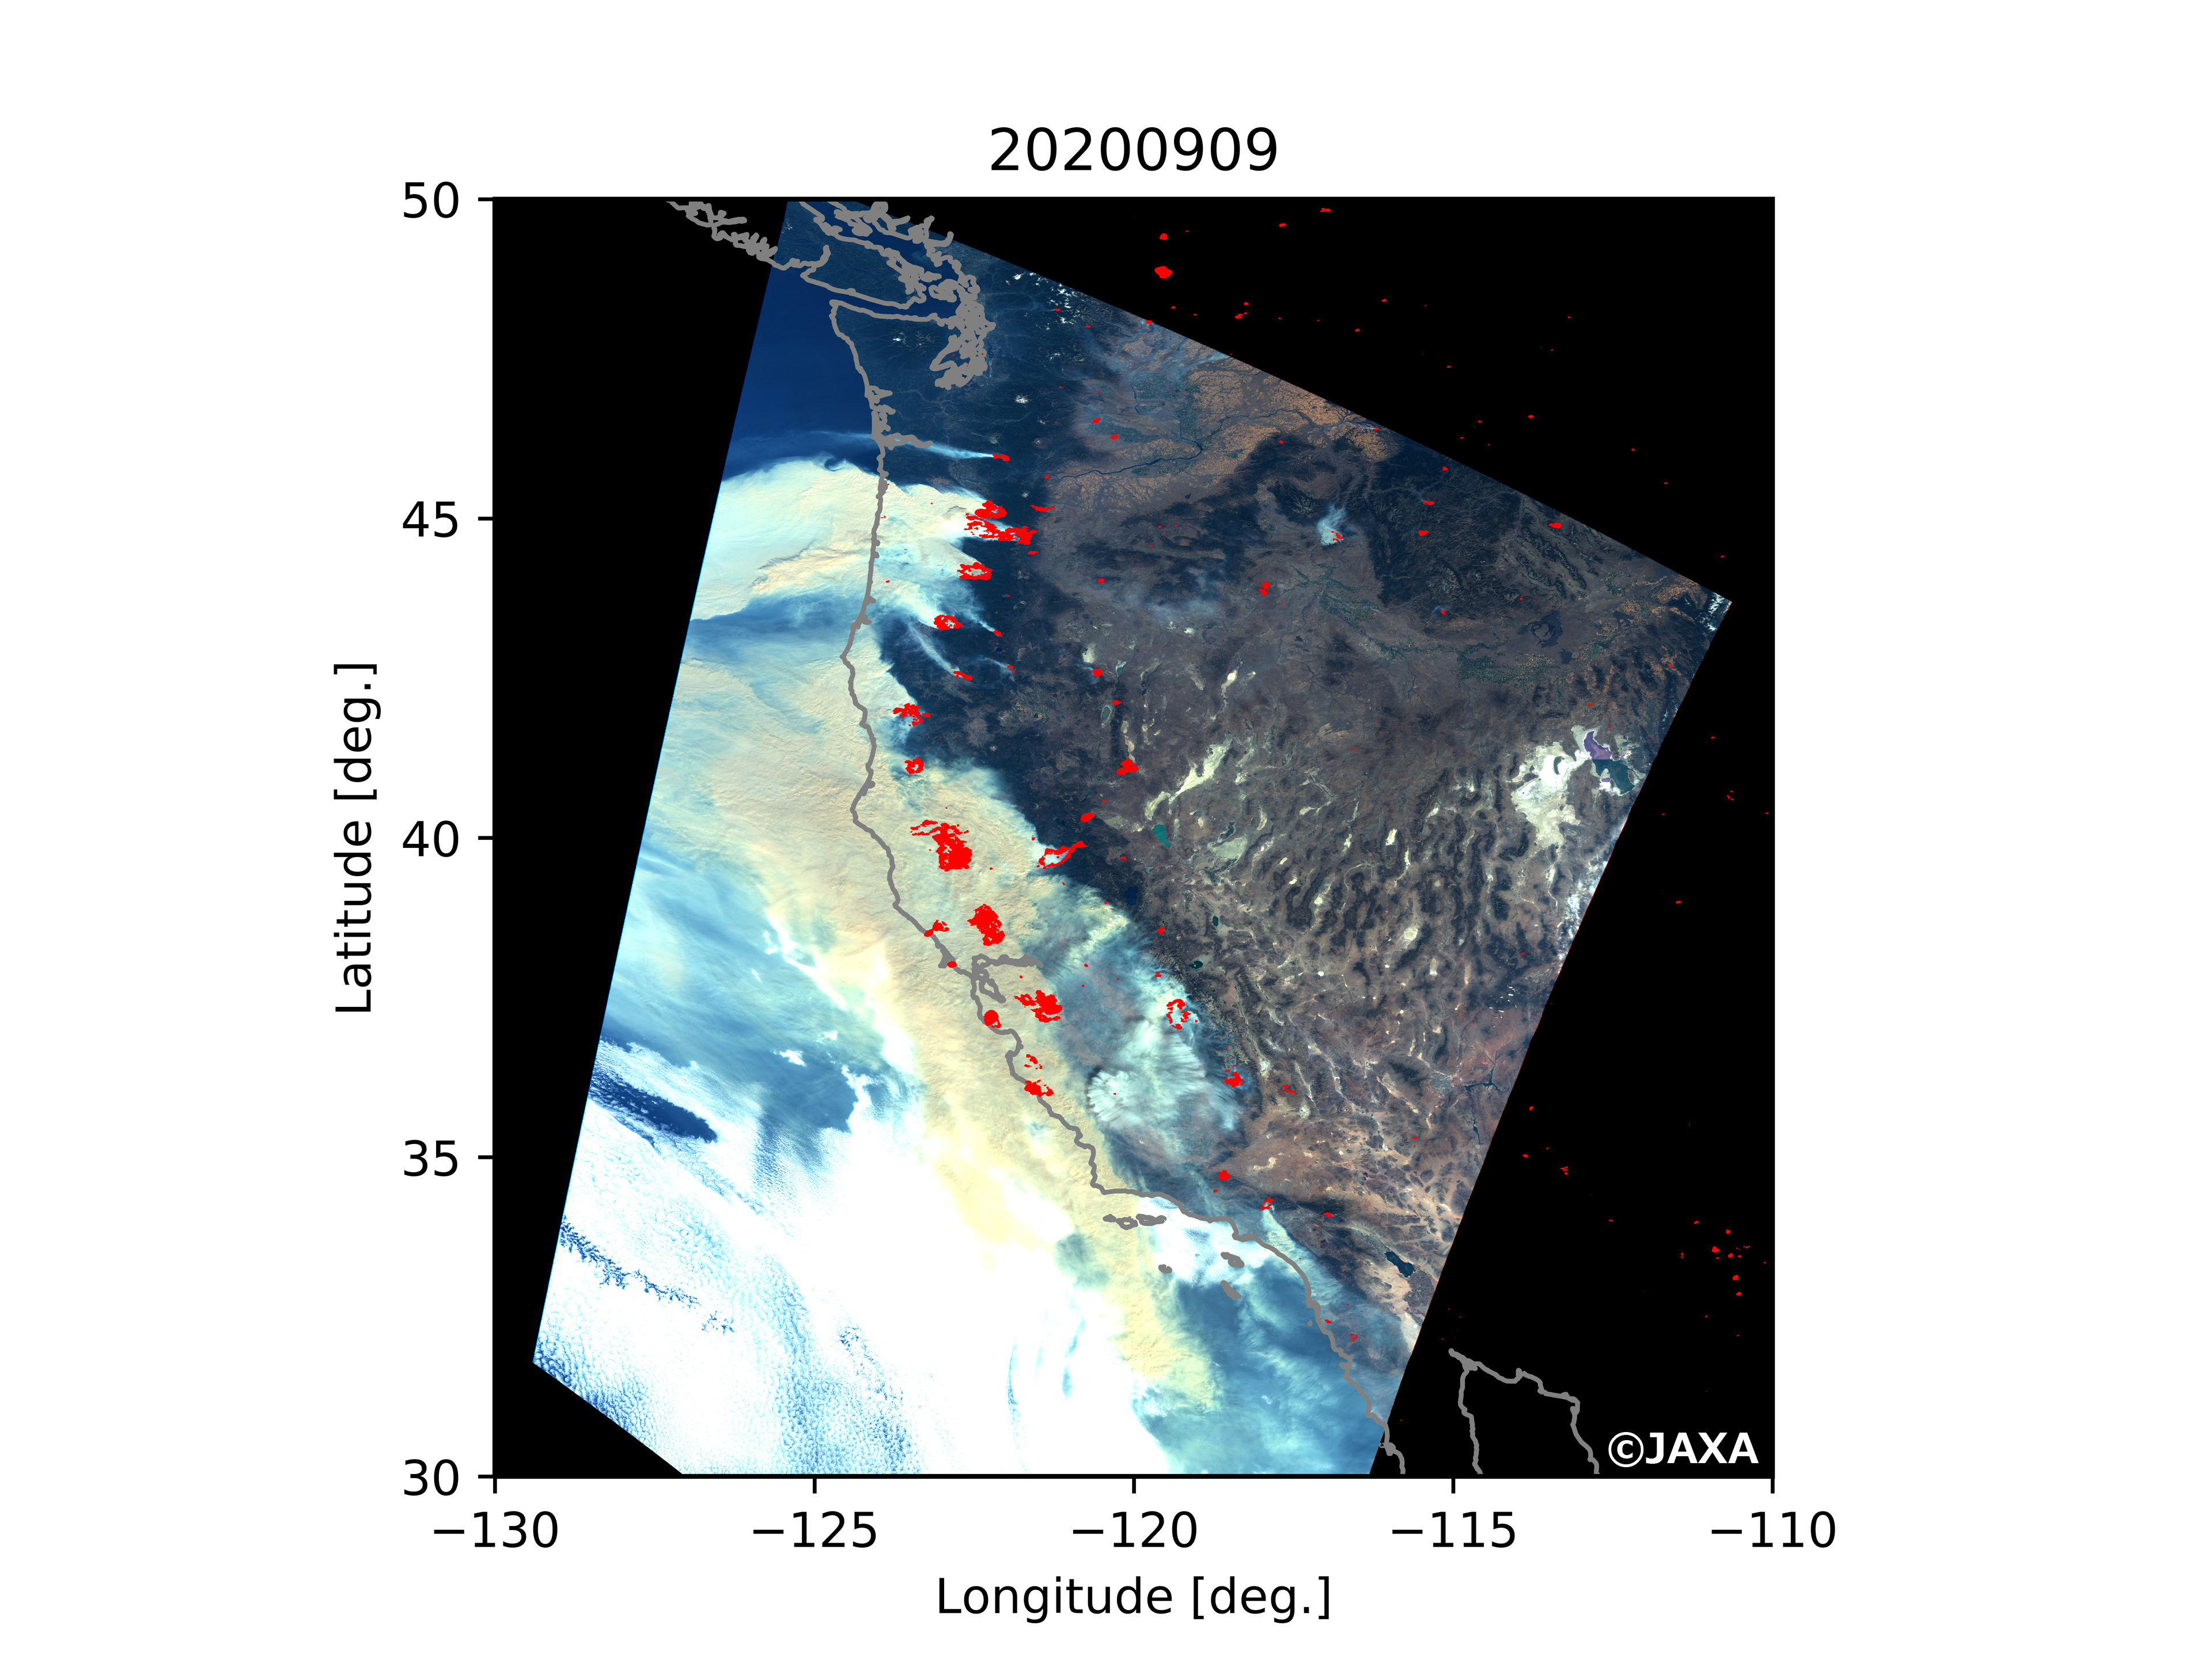
Figure 3. shows the condition of California wildfires on September 9, 2020 combining RGB image of "SHIKISAI" visible band. The overlayed plotted red points show the hotspots (the point which seems to be burning at the moment) extracted by thermal infrared band of "SHIKISAI" during August 1 to September 9. Originating the hot spots, we can see the smoke by forest fires is emitting so much in the Pacific side.
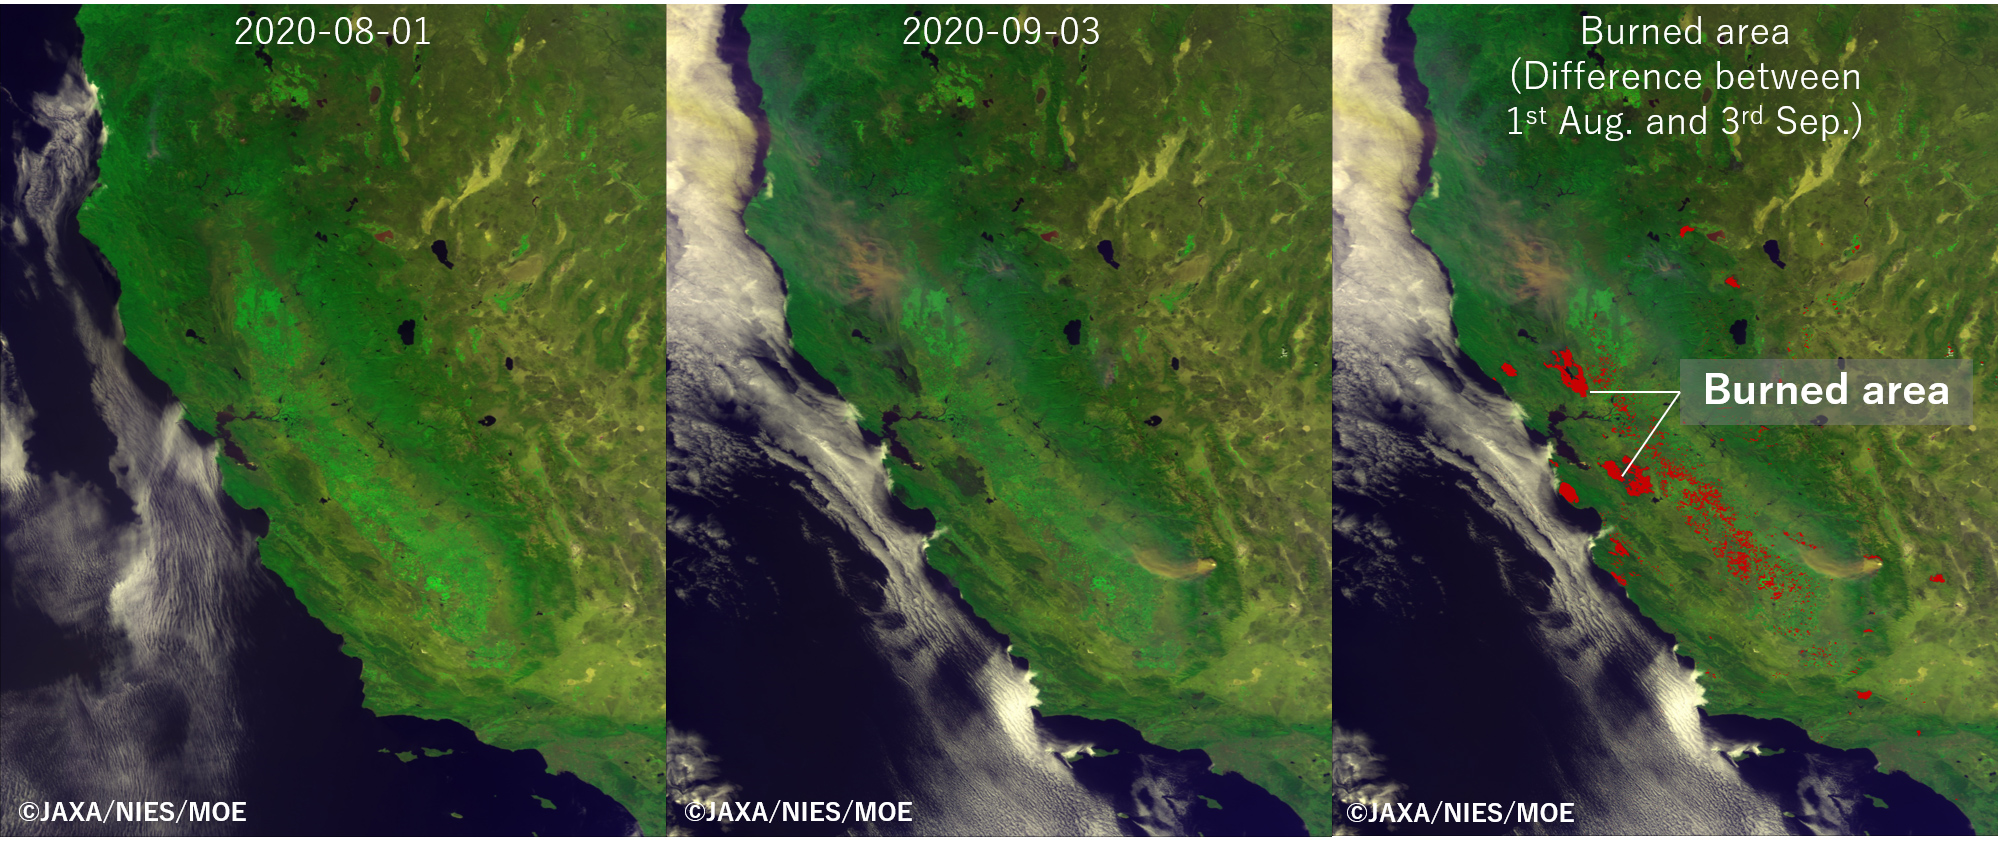
Figure 4. is the images observed by Cloud and Aerosol Imager (CAI) onboard Greenhouse gases Observing SATellite "IBUKI" (GOSAT). The burning areas as of September 3, 2020 are extracted (red points) by difference in before and after the fires.
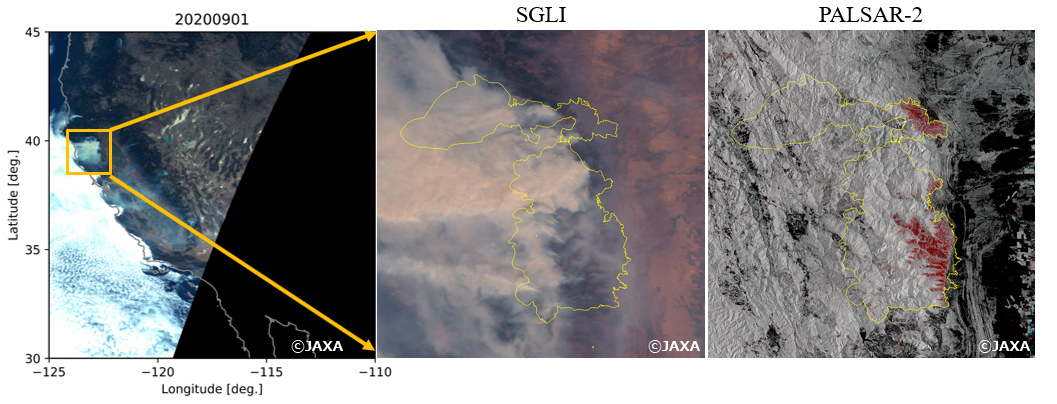
As seen above, it is possible for optical sensors onboard "SHIKISAI" and "IBUKI" to capture the condition and change of visible fires, but the sensors cannot capture the ground condition under cloud and/or smoke. On the other hand, Phased Array type L-band Synthetic Aperture Radar-2 (PALSAR-2) onboard Advanced Land Observing Satellite-2 "DAICHI-2" (ALOS-2) can observe ground surface day and night regardless of the weather because it utilizes electric waves going through clouds and smokes. Figure 5. shows the comparison between visible image and ALOS-2/PALSAR-2 image on September 1, 2020. "SHIKISAI" cannot catch the change of grand surface because sky above is covered by smoke. However, image of PALSAR-2 can extract the forest burning area clearly by merging before and after HV polarized wave images, which can detect forest distribution (red area in figure 5. Right).
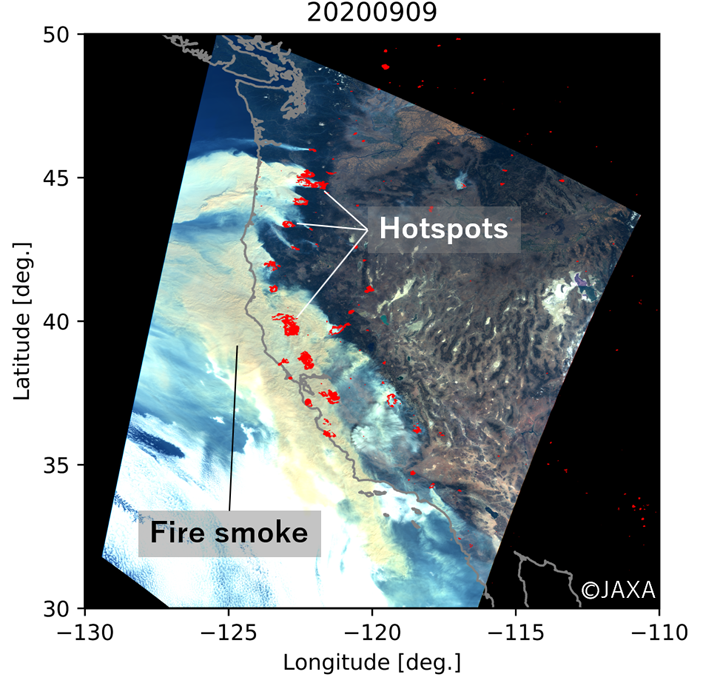
Figure 3. Visible images and hotspots in the west coast of USA on September 9, 2020 observed by "SHIKISAI". The pixel which exceed certain threshold value of brightness temperature is extracted as hotspots during the night without solar insolation using thermal infrared band of "SHIKISAI". Originating the hot spots, we can see the yellow colored smoke by forest fires is emitting so much in the Pacific side.
Effects on air quality
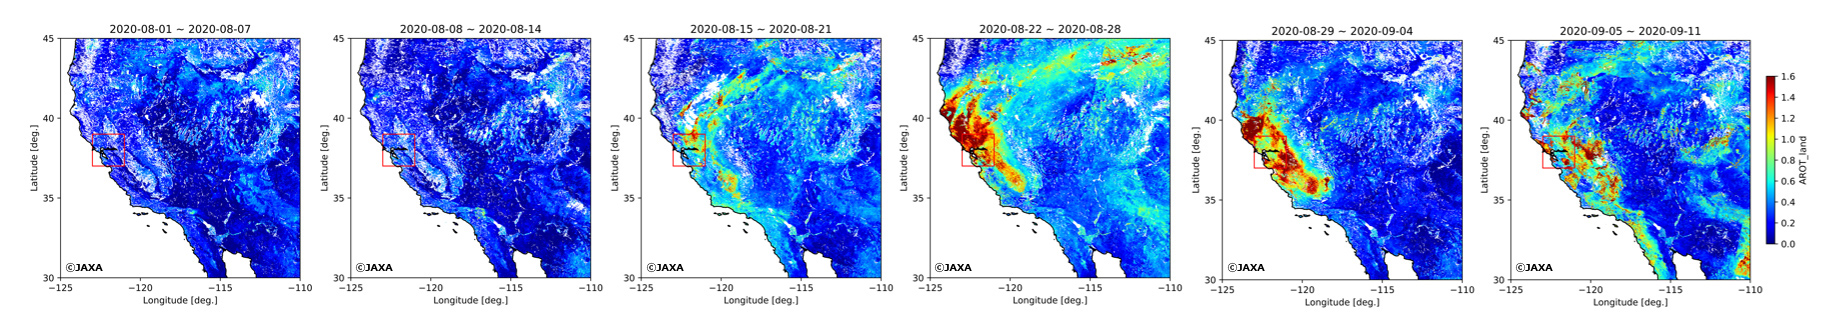
Wildfires directly damage forest itself and surrounding the land ecosystem. Furthermore, CO2 and aerosol particle (dust flowing the air) etc. emitted by forest fires secondarily effect the areas far from atmosphere environment or fire scene. It is possible for "SHIKISAI" to measure aerosol distribution by using near-ultraviolet observation and polarization observation. Figure 6. shows time series images (a week average) of Aerosol Optical Thickness (AOT) during August 1 to September 11, 2020 calculated by using band of near-ultraviolet radiation (0.38µm). We can find that August 16, the date of fire occurs is the trigger of increasing sudden AOT around San Francisco and particles by fires are emitting to the air. Furthermore, aerosol movement from sky above in California to the east can be seen by the effect of the wind. It leads to the worry about air pollution toward huge area.
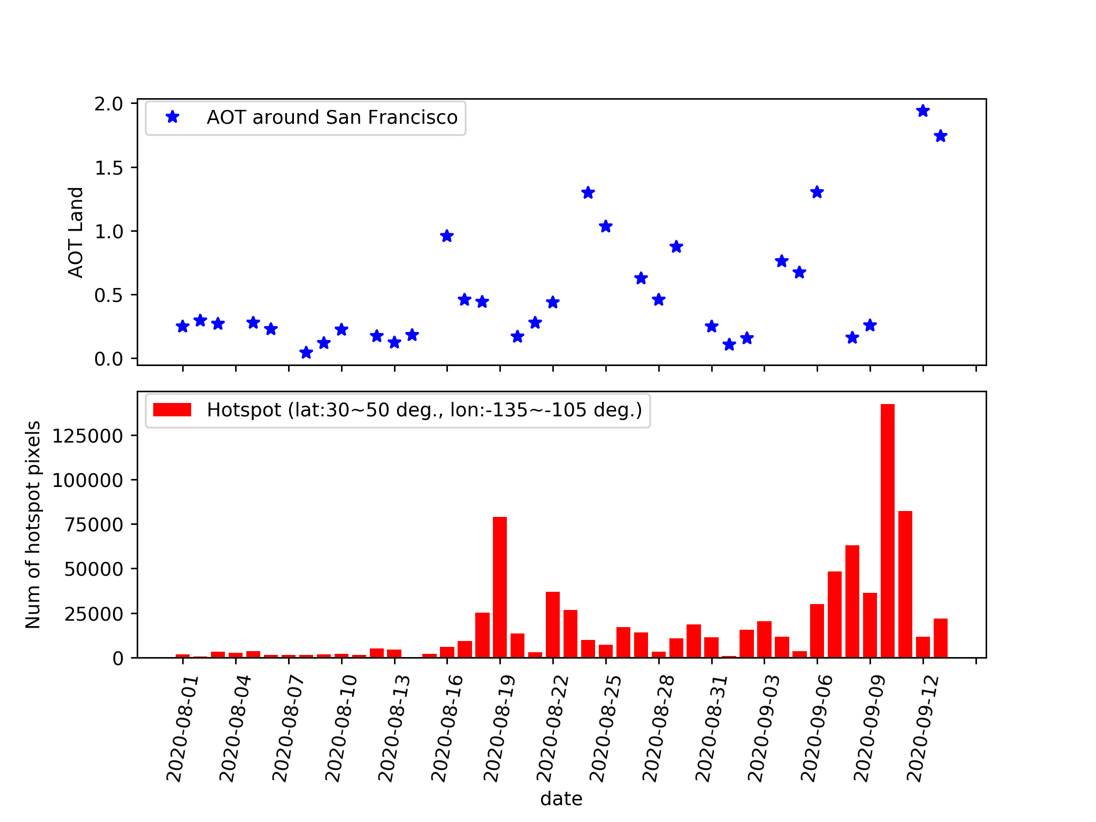
Figure 7. compares AOT at daily intervals and pixel number detected at night using thermal infrared band around San Francisco. The change of pixel number shows the fire area expansion around August 16. The fire looks turning out at the end of August, but the pixel number clearly shows that fire swiftly increases again in the beginning of September. Comparison of AOT shows that aerosol quantity released to the air is changing in association with increase and decrease of hotspots. Such highly concentrated aerosol is harmful for human body and it is imaginable that highly concentrated aerosol affects climate in a longer term depend on the occurrence of fire. So, it is important to continue wide range and steady satellite monitoring.
Summary
The background of California wildfires, damage status and the effect to air quality can be visualized this time by utilizing the advantage of multiple satellites. Wildfires make a big impact to local ecosystem including human beings. Moreover, it has possibility to result in global warming by greenhouse gas emissions with forest burning and air pollution by aerosol emissions. If global warming proceeds, it leads to negative spiral such as increase of drought and heat wave, risk increase of wildfires occurrence. [Bowman et al. (2017), University of East Anglia (2020)]. It is important to understand the background factors of these mega fires and the effect toward earth environment by utilizing satellites which can observe the earth constantly in wide scope.
Explanation of the Images
Figure 1
| Satellite | Global Precipitation Measurement Core Observatory (GPM Core Observatory) |
|---|---|
| Sensor | Global Satellite Mapping of Precipitation (GSMaP) |
| Date | February 2020 |
Figure 2,3,5,6
| Satellite | Global Change Observation Mission - Climate "SHIKISAI" (GCOM-C) |
|---|---|
| Sensor | Second generation GLobal Imager (SGLI) |
| Date | August 8-14, 2020 (Figure 2) September 9, 2020 (Figure 3) September 1, 2020 (Figure 5. Left , Middle) August 1- September 11, 2020 (Figure 6) |
Figure 4
| Satellite | Greenhouse gases Observing SATellite "IBUKI" (GOSAT) |
|---|---|
| Sensor | Cloud and Aerosol Imager (TANSO-CAI) |
| Date | August 1, 2020 (Left) September 3, 2020 (Middle) |
Figure 5 (right)
| Satellite | Advanced Land Observing Satellite-2 "DAICHI-2" (ALOS-2) |
|---|---|
| Sensor | Phased Array type L-band Synthetic Aperture Radar-2 (PALSAR-2) |
| Date | July 7, 2020 September 1, 2020 |


