Seen from Space 2012
Sea ice observation in the Sea of Okhotsk
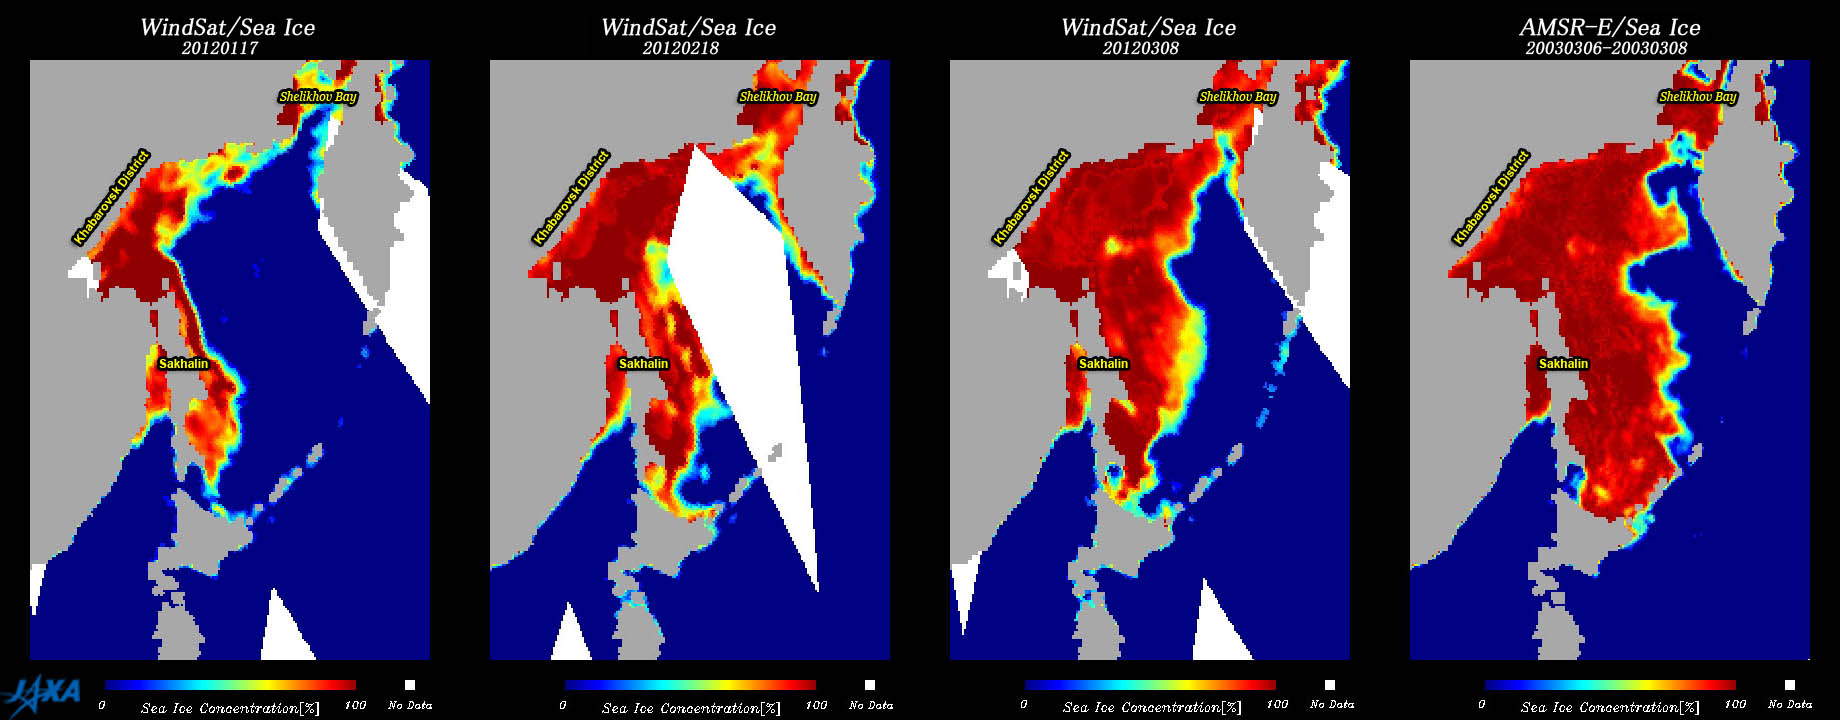
(a) January 17, 2012 (b) February 18, 2012 (c) March 8, 2012 (d) March 8, 2003
Fig. 1. Sea ice in the Sea of Okhotsk observed by microwave radiometers. (a)–(c): Images obtained by WindSat. (d) Images obtained by AMSR-E. Figures 1 (a)–(c) show sea ice coverage in 2012 in the Sea of Okhotsk; these images were recorded by satellite-based microwave radiometers, WindSat*3 and AMSR-E*1. These instruments measure the microwave radiation emitted from Earth. Since microwaves can penetrate the cloud we can observe sea ice even under cloudy weather conditions. The colors in Figure 1 represent sea ice coverage over specific areas, with red representing the highest degrees of concentration*2. During the 2011 winter, regions along the Sea of Japan recorded heavy snowfall. In addition, sea ice levels in the Sea of Okhotsk increased during the same year. The origins of sea ice in the Sea of Okhotsk are located along the coast of Khabarovsk District, the Bay of Shelikhov, and the east coast of the island of Sakhalin. Sea ice is transported to the coast of the island of Hokkaido by the action of sea surface winds or ocean currents. In 2012, offshore sea ice was first visible along the coastal city of Abashiri on January 17, 2012, also referred to as “the first day of sea ice.” Delayed by the action of headwinds, the sea ice drift did not arrive at the coast until February 17, also referred to as “the first arrival of sea ice.” On the day of “the first arrival of sea ice,” ships cannot cruise around the port since the dense concentration of sea ice interferes with their navigationThis date marked the third-latest sea ice arrival since observations began in 1959. Figure 1 (a) shows an image of the first sea ice observed off the coast of Abashiri; figure 1 (b) shows sea ice just after its arrival to the coast. The highly concentrated region of sea ice highly continually flows from the east coast of Sakhalin to offshore Hokkaido. The region of sea ice coverage in the Sea of Okhotsk is greatest from the end of February to the beginning of March. AMSR-E has observed this region from 2003 to 2011. During this period, the largest area of sea ice coverage was observed in March 2003 (Figure 1 (d)). Figure 1 (c) shows sea ice coverage on March 8, 2012. Contrary to that observed in 2003, sea ice coverage in 2012 extended to the eastern region of the Sea of Okhotsk rather than to the southeast. *1) The Advanced Microwave Scanning Radiometer for EOS (AMSR-E) was developed by the Japan Aerospace Exploration Agency (JAXA) and was onboard the 2002 launch of Aqua, NASA’s international Earth Observing System. This satellite is used to collect data on sea surface temperature, precipitation, soil moisture, and sea ice in the Arctic Ocean. On October 4, 2011, the AMSR-E automatically halted its observation because its antenna’s rotation torque had reached its limit of 40 revolutions per minute required to maintain normal operating function. The Global Change Observation Mission 1st - Water "SHIZUKU" (GCOM-W1) was launched successfully on May 18, 2012(JST). The Advanced Microwave Scanning Radiometer 2 (AMSR2) on "SHIZUKU" (GCOM-W1) is a successor to the AMSR-E. 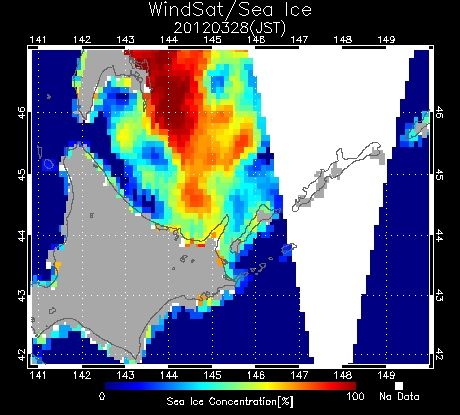 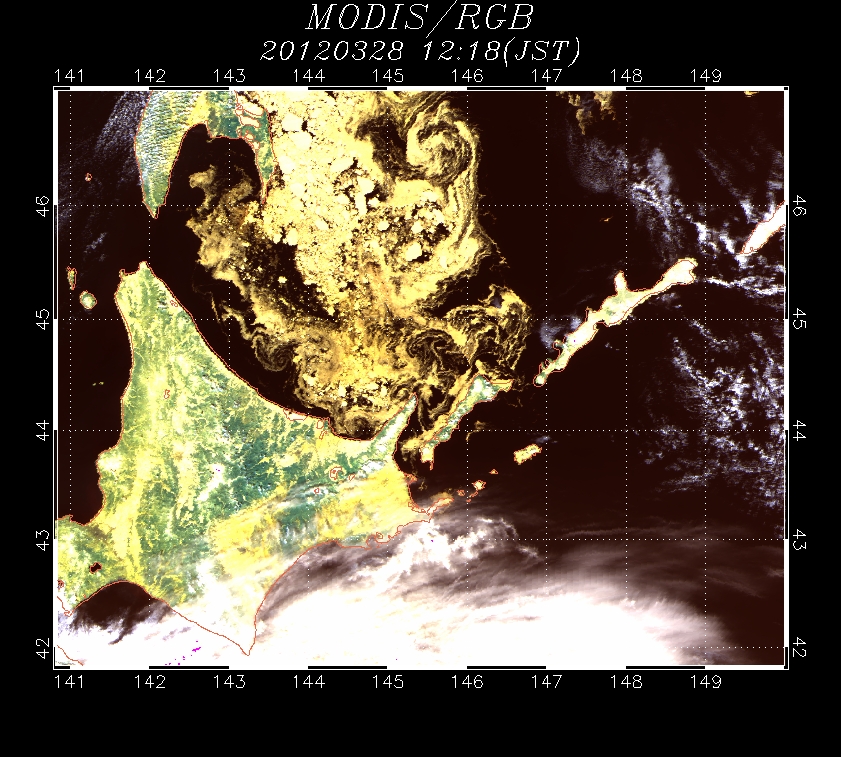 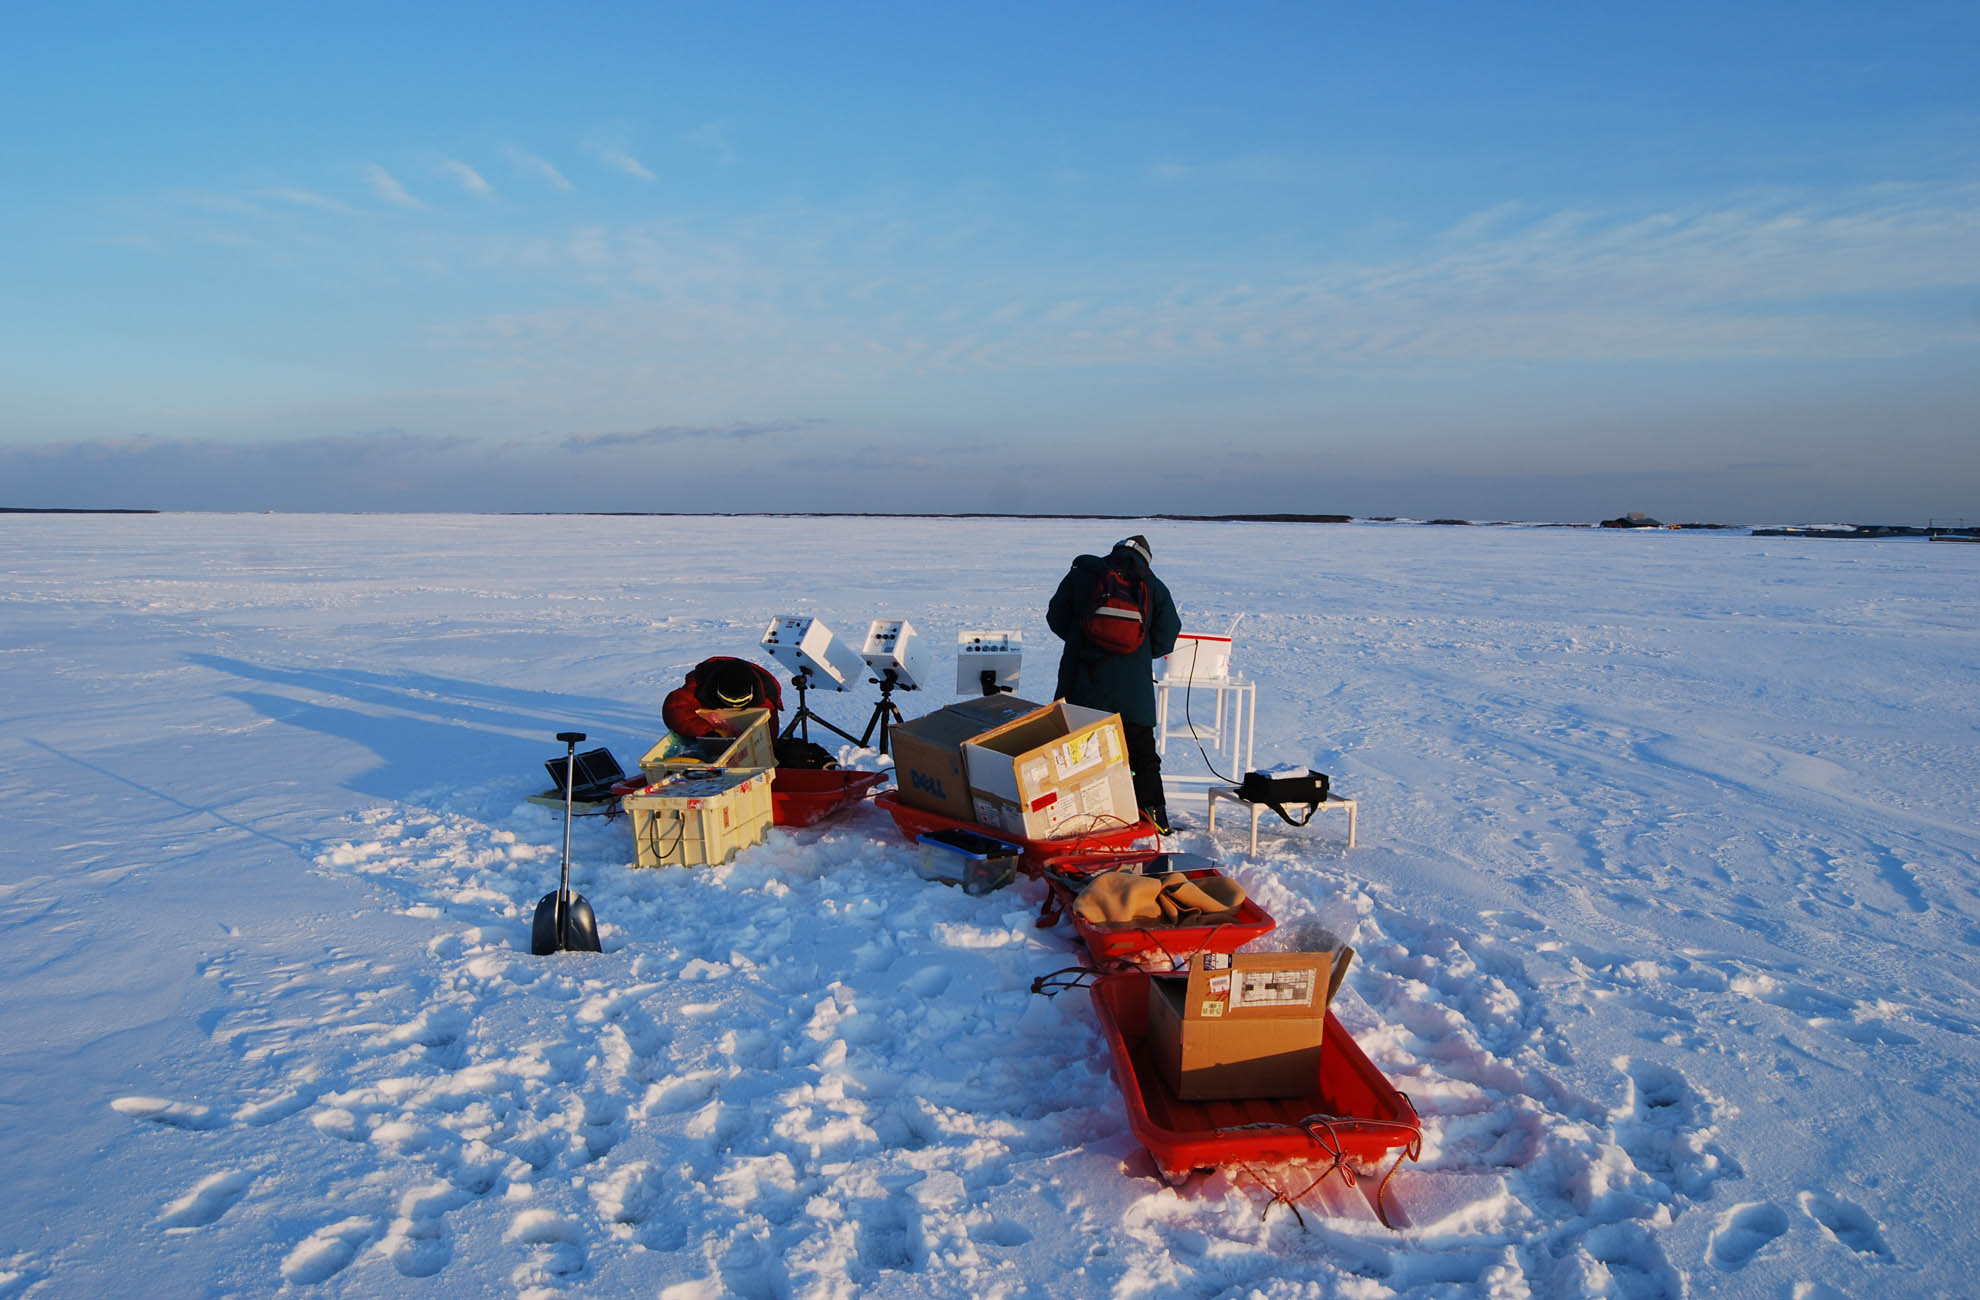
(a) WindSat observation (b) MODIS observation (c) Field survey on sea ice
Fig. 2. Sea ice observation conducted through the use of various sensor technologies. (a), (b) Sea ice concentration images at the shoreline of Hokkaido on March 28, 2012, obtained by WindSat and NASA’s Moderate Resolution Imaging Spectroradiometer (MODIS) optical sensor, respectively. (c) Field survey of microwave radiation conducted on sea ice. The accumulation of long-term observation data is crucial for elucidating the mechanisms of climate change such as decreases in sea ice proliferation and areas of snow cover. Although AMSR-E observations halted on October 4, 2011, the Japan Aerospace Exploration Agency (JAXA) continues to conduct sea ice observation by WindSat. JAXA’s Global Change Observation Mission’s water-observation satellite (GCOM-W1), also referred to as SHIZUKU, will be launched on May 18, 2012. Onboard will be the Advanced Microwave Scanning Radiometer-2 (AMSR2), a follow-on sensor and successor of the nonfunctioning AMSR-E model. Although WindSat, AMSR-E, and AMSR2 are satellite-based microwave radiometers, their specifications, including that of spatial resolution, differ slightly. Therefore, it is necessary to verify the accuracy of data obtained from each satellite for a greater understanding of the long-term trends of sea ice concentration. Figures 2 (a) and 2 (b) show images of sea ice concentration at the shoreline of Hokkaido on March 28, 2012, obtained by WindSat and NASA’s Moderate Resolution Imaging Spectroradiometer (MODIS) optical sensor, respectively. Figure 2 (c) shows a field survey of microwave radiation conducted on sea ice. To validate data observed by satellite-based microwave radiometers, it is necessary to obtain data from optical sensors such as MODIS; the Second Generation Global Imager (SGLI), which is scheduled for launch in 2015 onboard JAXA’s Global Change Observation Mission’s climate-observation satellite (GCOM-C1); and synthetic aperture radar (SAR) data. It is important to observe the characteristics of microwave radiation from sea ice in detail and to apply this information to improve algorithms for satellite data analysis. This investigation will help to foster a greater understanding of the long-term trends of sea ice coverage and their impact on the Earth. Explanation of the Images:
Related Sites
|


