Seen from Space 2010
The Snow Country beyond the Tunnel
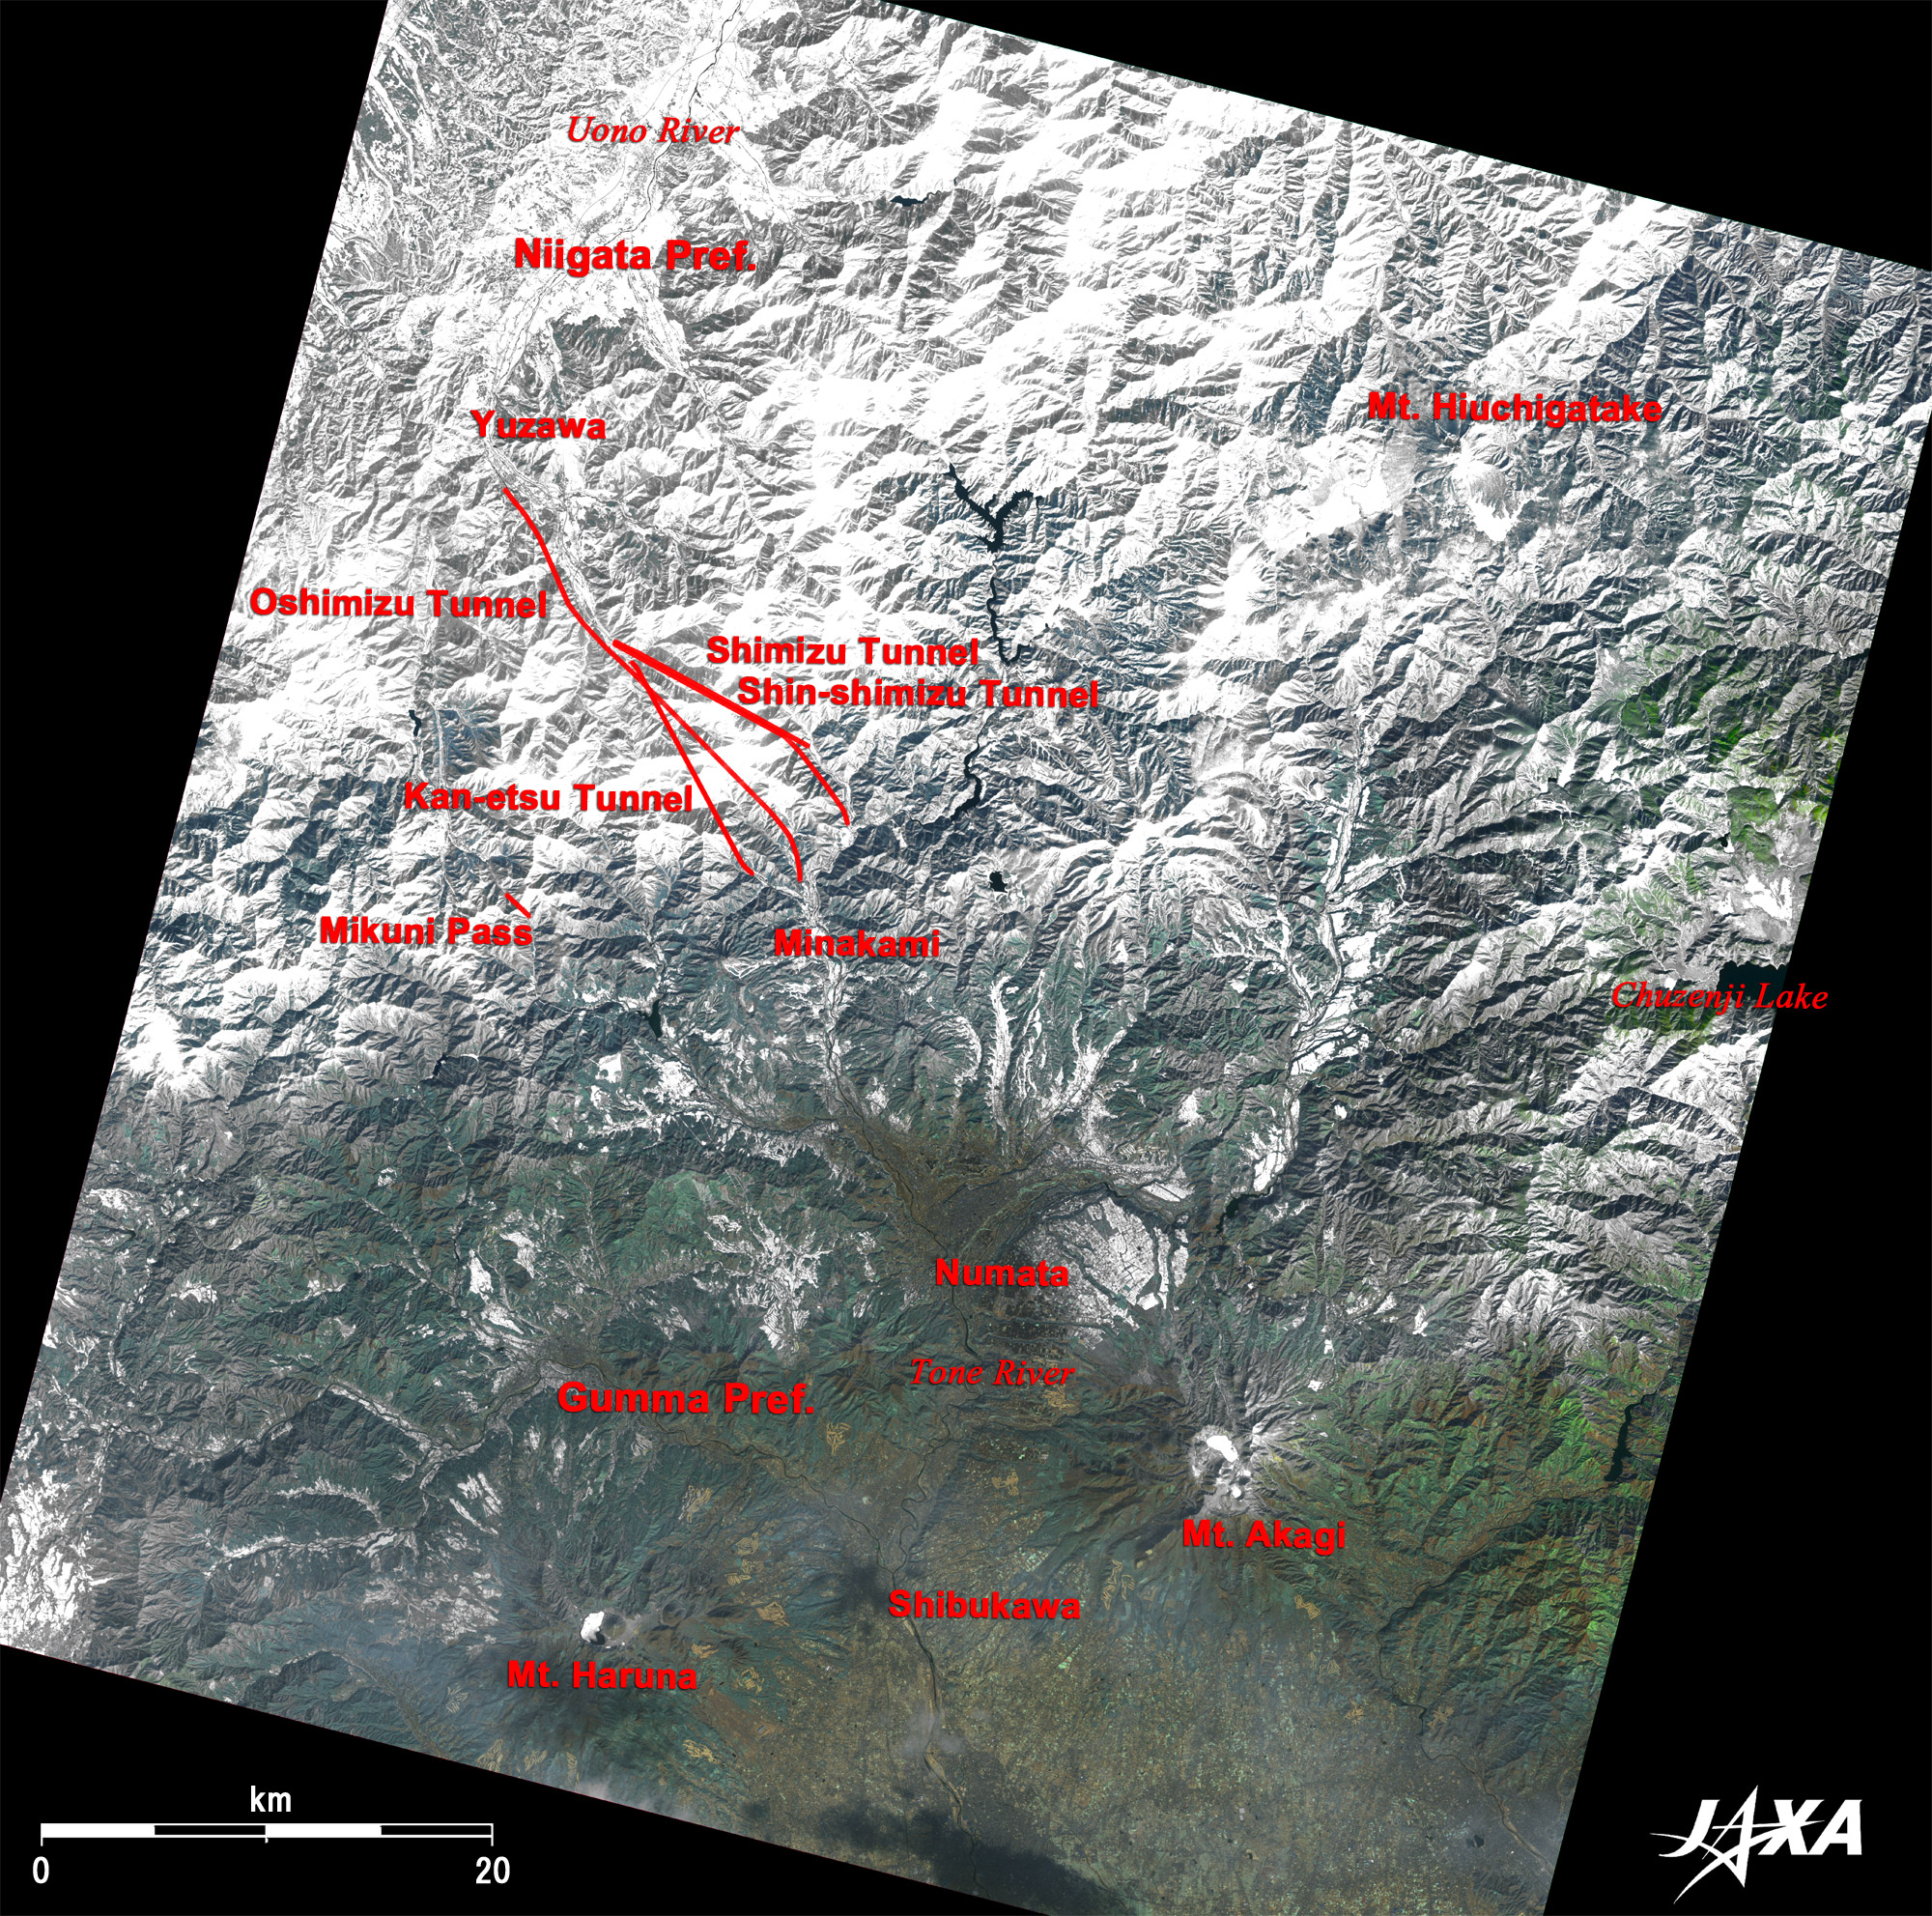 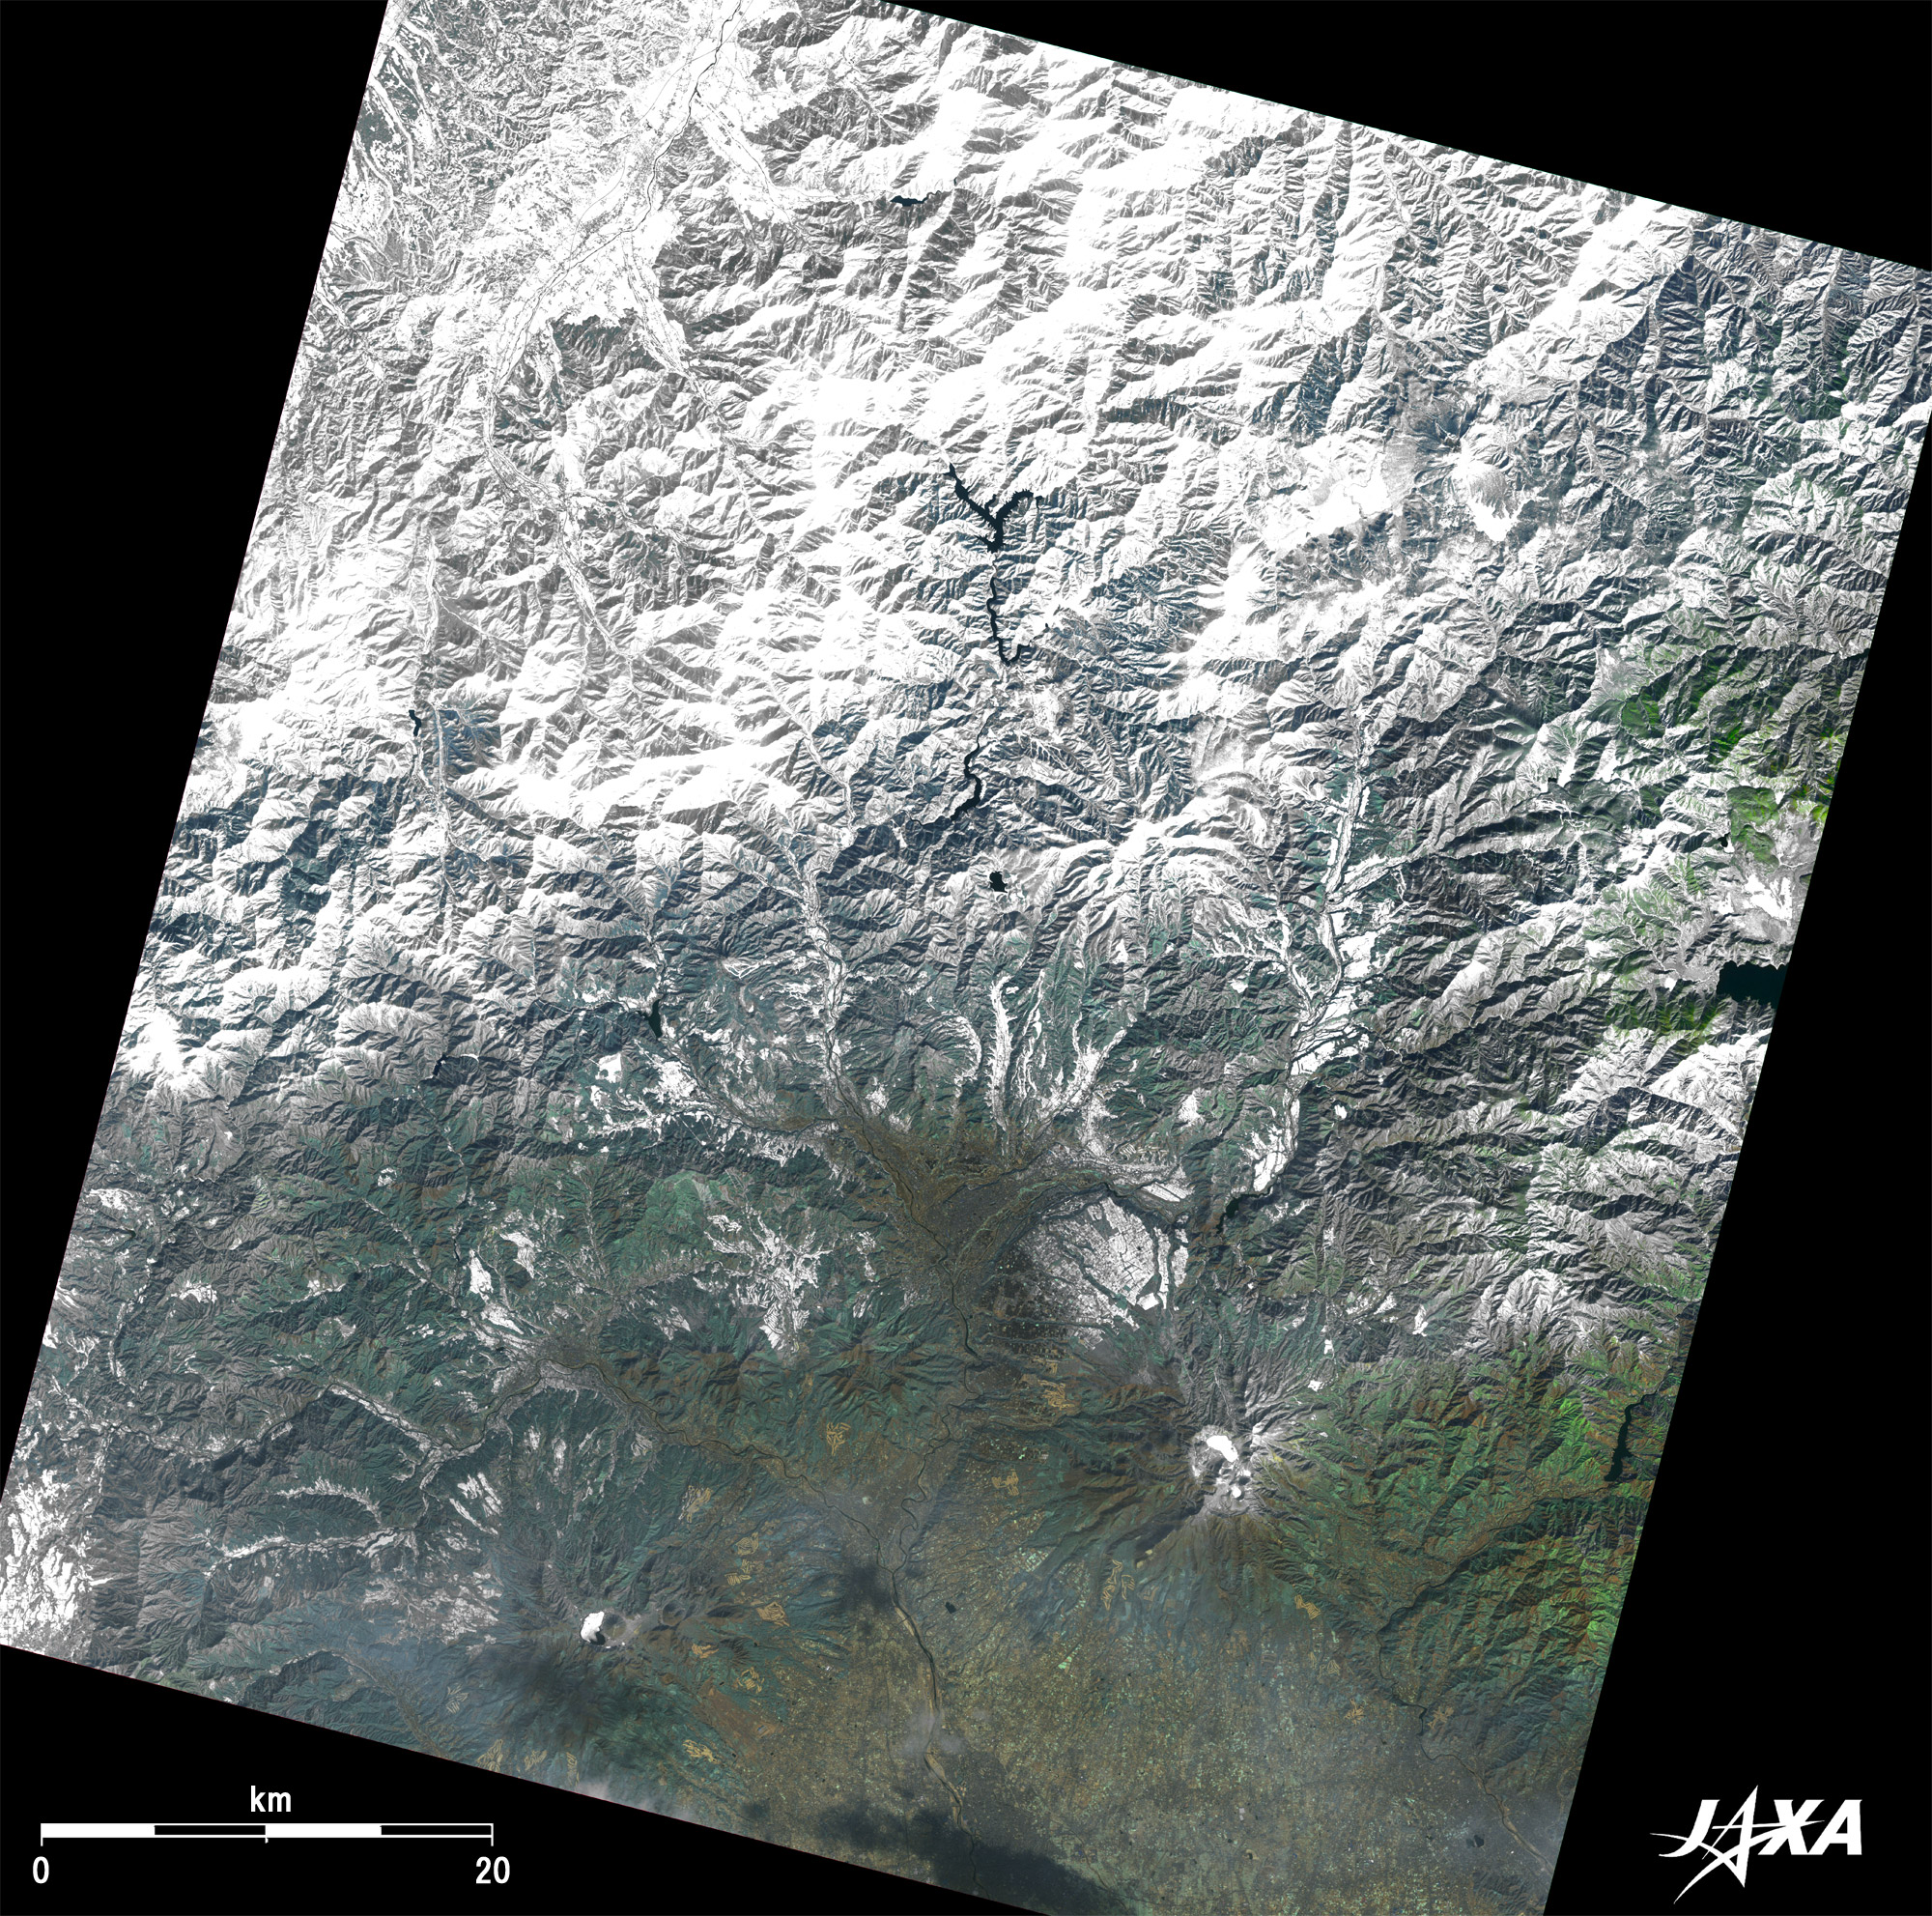 Fig. 1. Vicinity of the Border between Gunma and Niigata Prefectures
“The train came out of the long tunnel into the snow country.” This is the opening sentence of a famous novel by the Nobel Prize-winning Japanese author Yasunari Kawabata. Joetsu Border (the border between Gunma and Niigata Prefectures) is the locale of the long tunnel and is also the “climatic boundary” that divides the clear wintery sky of the Pacific Ocean side with the heavy snowfall that blankets the Japan Sea side. Satellite imagery clearly shows the difference of climate in this area. 
Long Tunnels at the BorderFigure 1 depicts the vicinity of the border between Gunma and Niigata Prefectures as observed in February 22, 2009. The Mikuni Mountain Range of this area is about 2,000 meters above the sea and it separates the east (the Pacific Ocean side) and the west (The Japan Sea side) of the main island of Japan. The main traffic routes between Tokyo’s metropolitan area and Niigata prefecture converge in this area where the Joetsu Bullet Train, Kanetsu Expressway, Japan Railway’s (JR) Joetsu Line, and National Route 17 cross at the chokepoints of the mountain range. Each traffic route passes through a tunnel in this area. 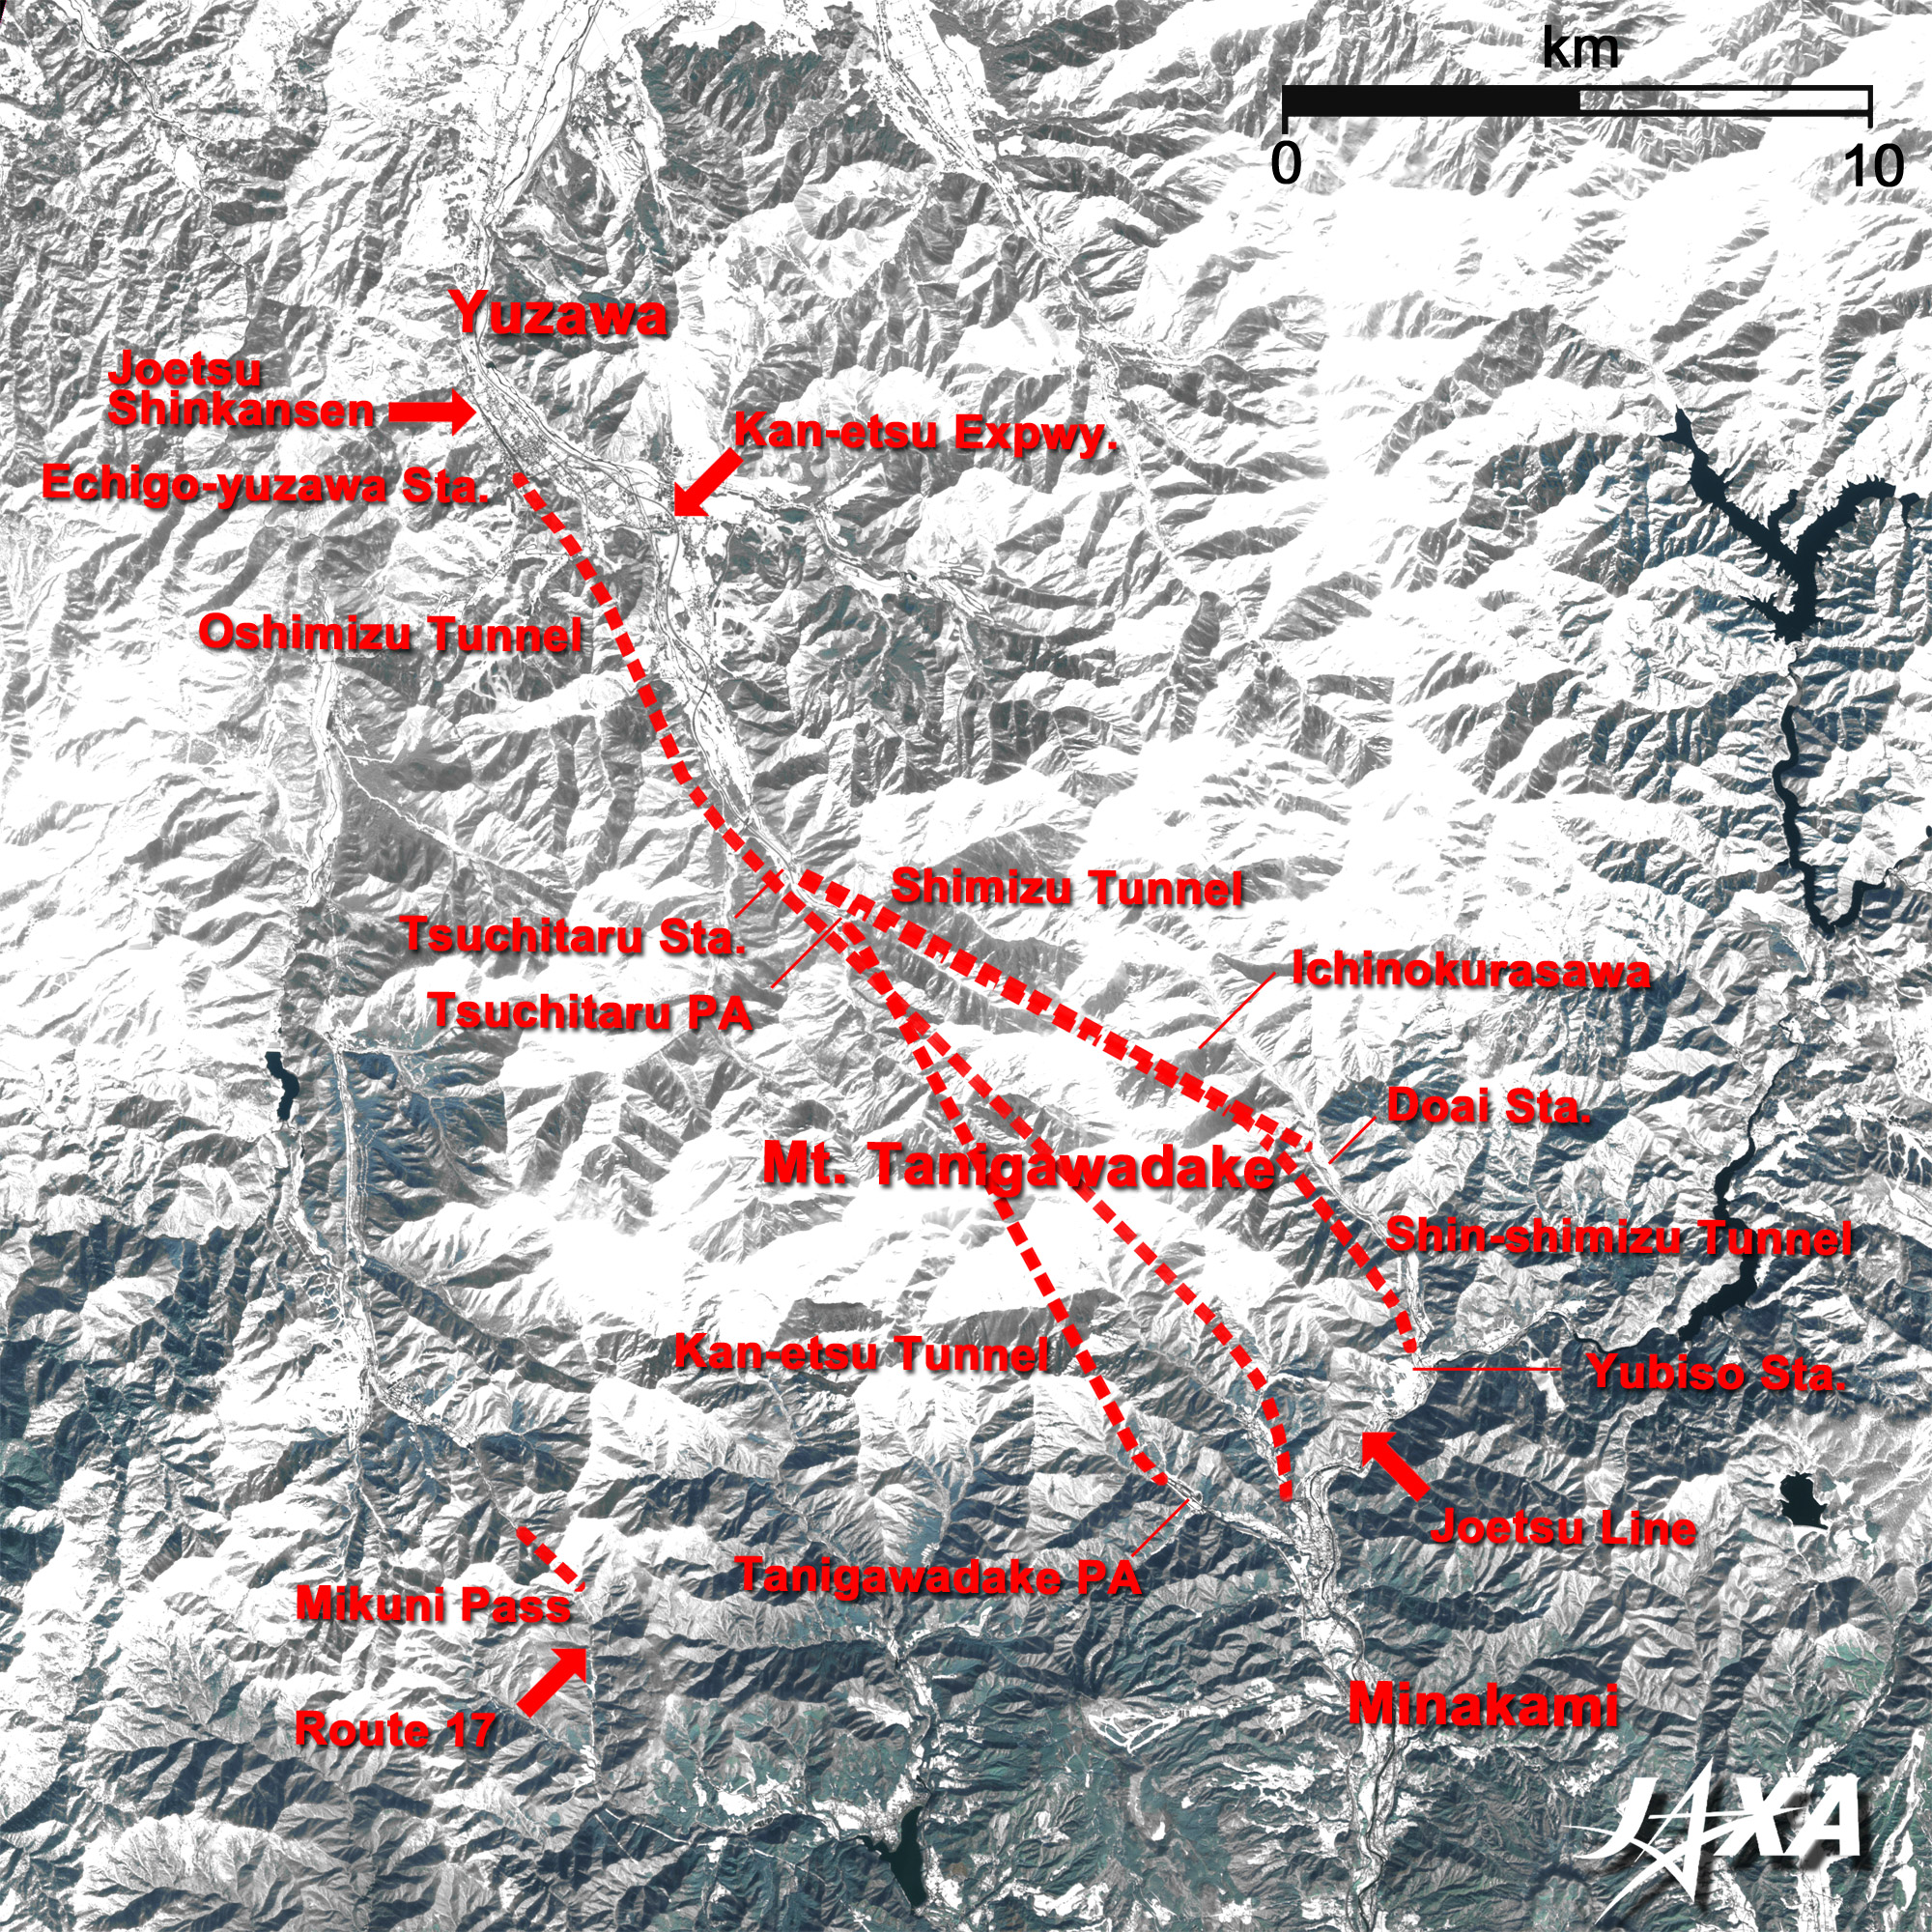  Fig. 2. Enlargement of the Vicinity of Tunnels
Vicinity of Tunnels (kmz, 1.86 MB, Low Resolution) as seen on Google Earth Figure 2 is an enlarged image of the vicinity of tunnels. The Oh (large)-Shimizu Tunnel (22.2 kilometers) of the Joetsu Bullet Train, the Kanetsu Tunnel (11 kilometers) of the Kanetsu Expressway, and the New Shimizu Tunnel (13.5 kilometers) of the JR Joetsu Line all stretch more than 10 kilometers. The long tunnel that appears in the novel “Snow Country,” is Shimizu Tunnel (9.7 kilometers) and is still used along with Oh-Shimizu Tunnel. Shimizu Tunnel was the longest in Japan when it opened for traffic in 1931. These tunnels are located below Mt. Tanigawadake, which is well known for its steep rock face.
The Climatic Boundary seen from SpaceFigure 1 clearly reveals a snowy area and a clear area. Snow conditions are completely different between Yuzawa and Numata, even though they are only 20 kilometers apart. The tunnels are located where the snow conditions change. In this way, satellite imagery, which can capture a wide area at once, is quite convenient to grasp snow coverage distribution. How does the difference in such snow coverage appear? Winter on the Japanese Islands sees a lot of snow brought to the Japan Sea side by a monsoon from the north, which blows off from a continental high pressure system and picks up the damp air over the Japan Sea. In contrast, the weather on the Pacific Ocean side, which is located in the lee of a mountain range, is milder and has little rainfall. 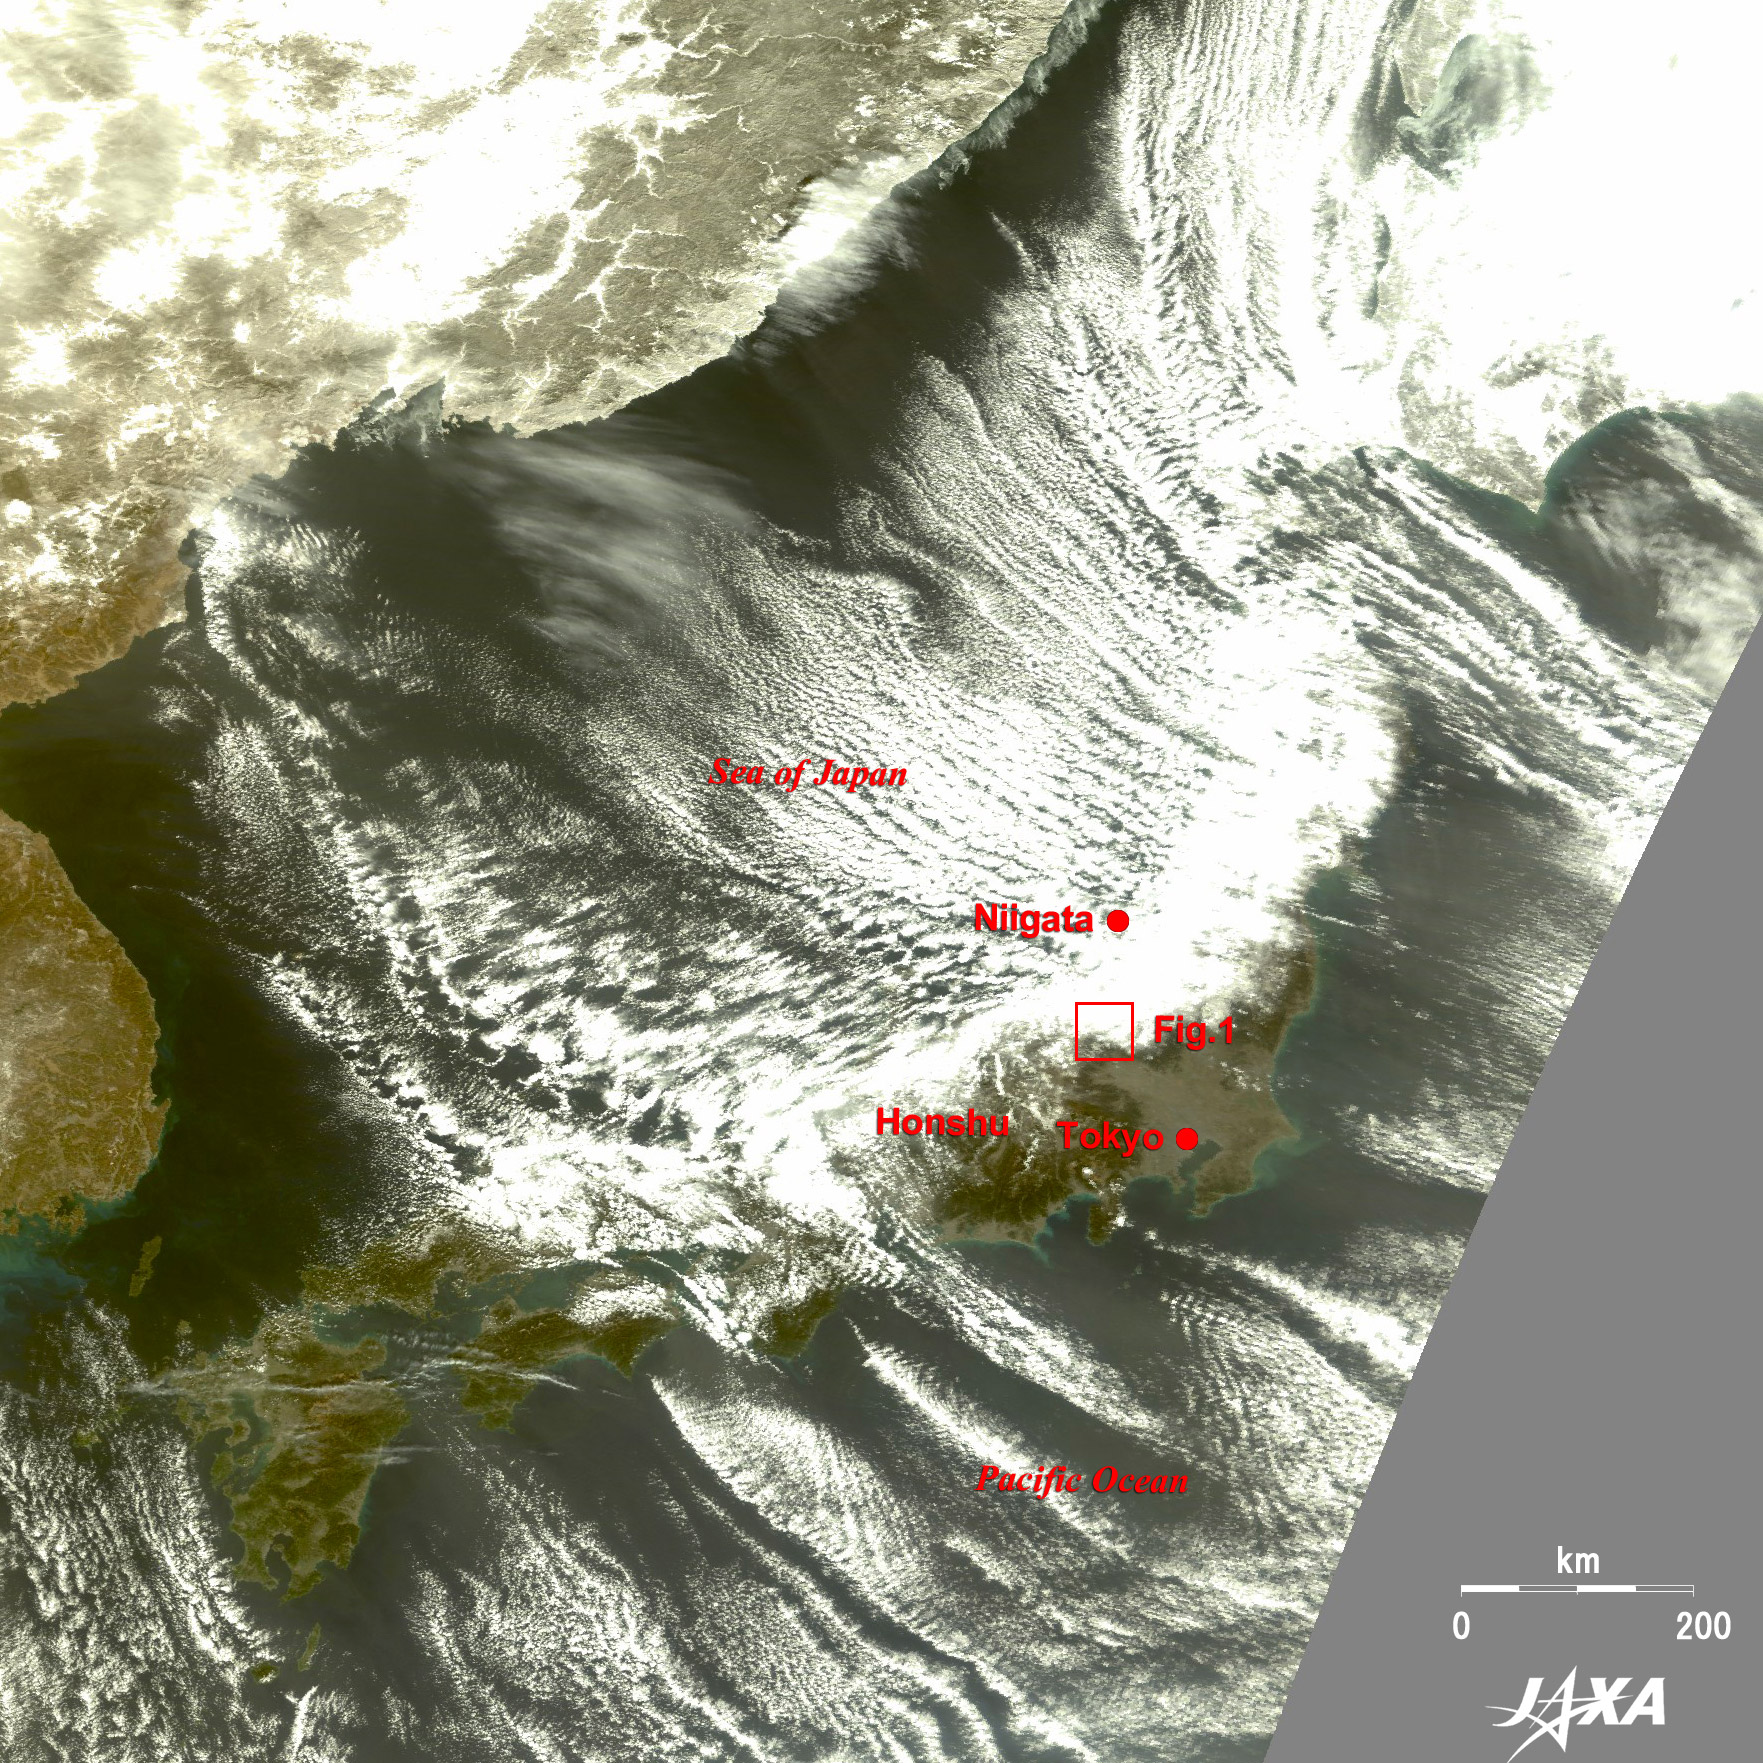 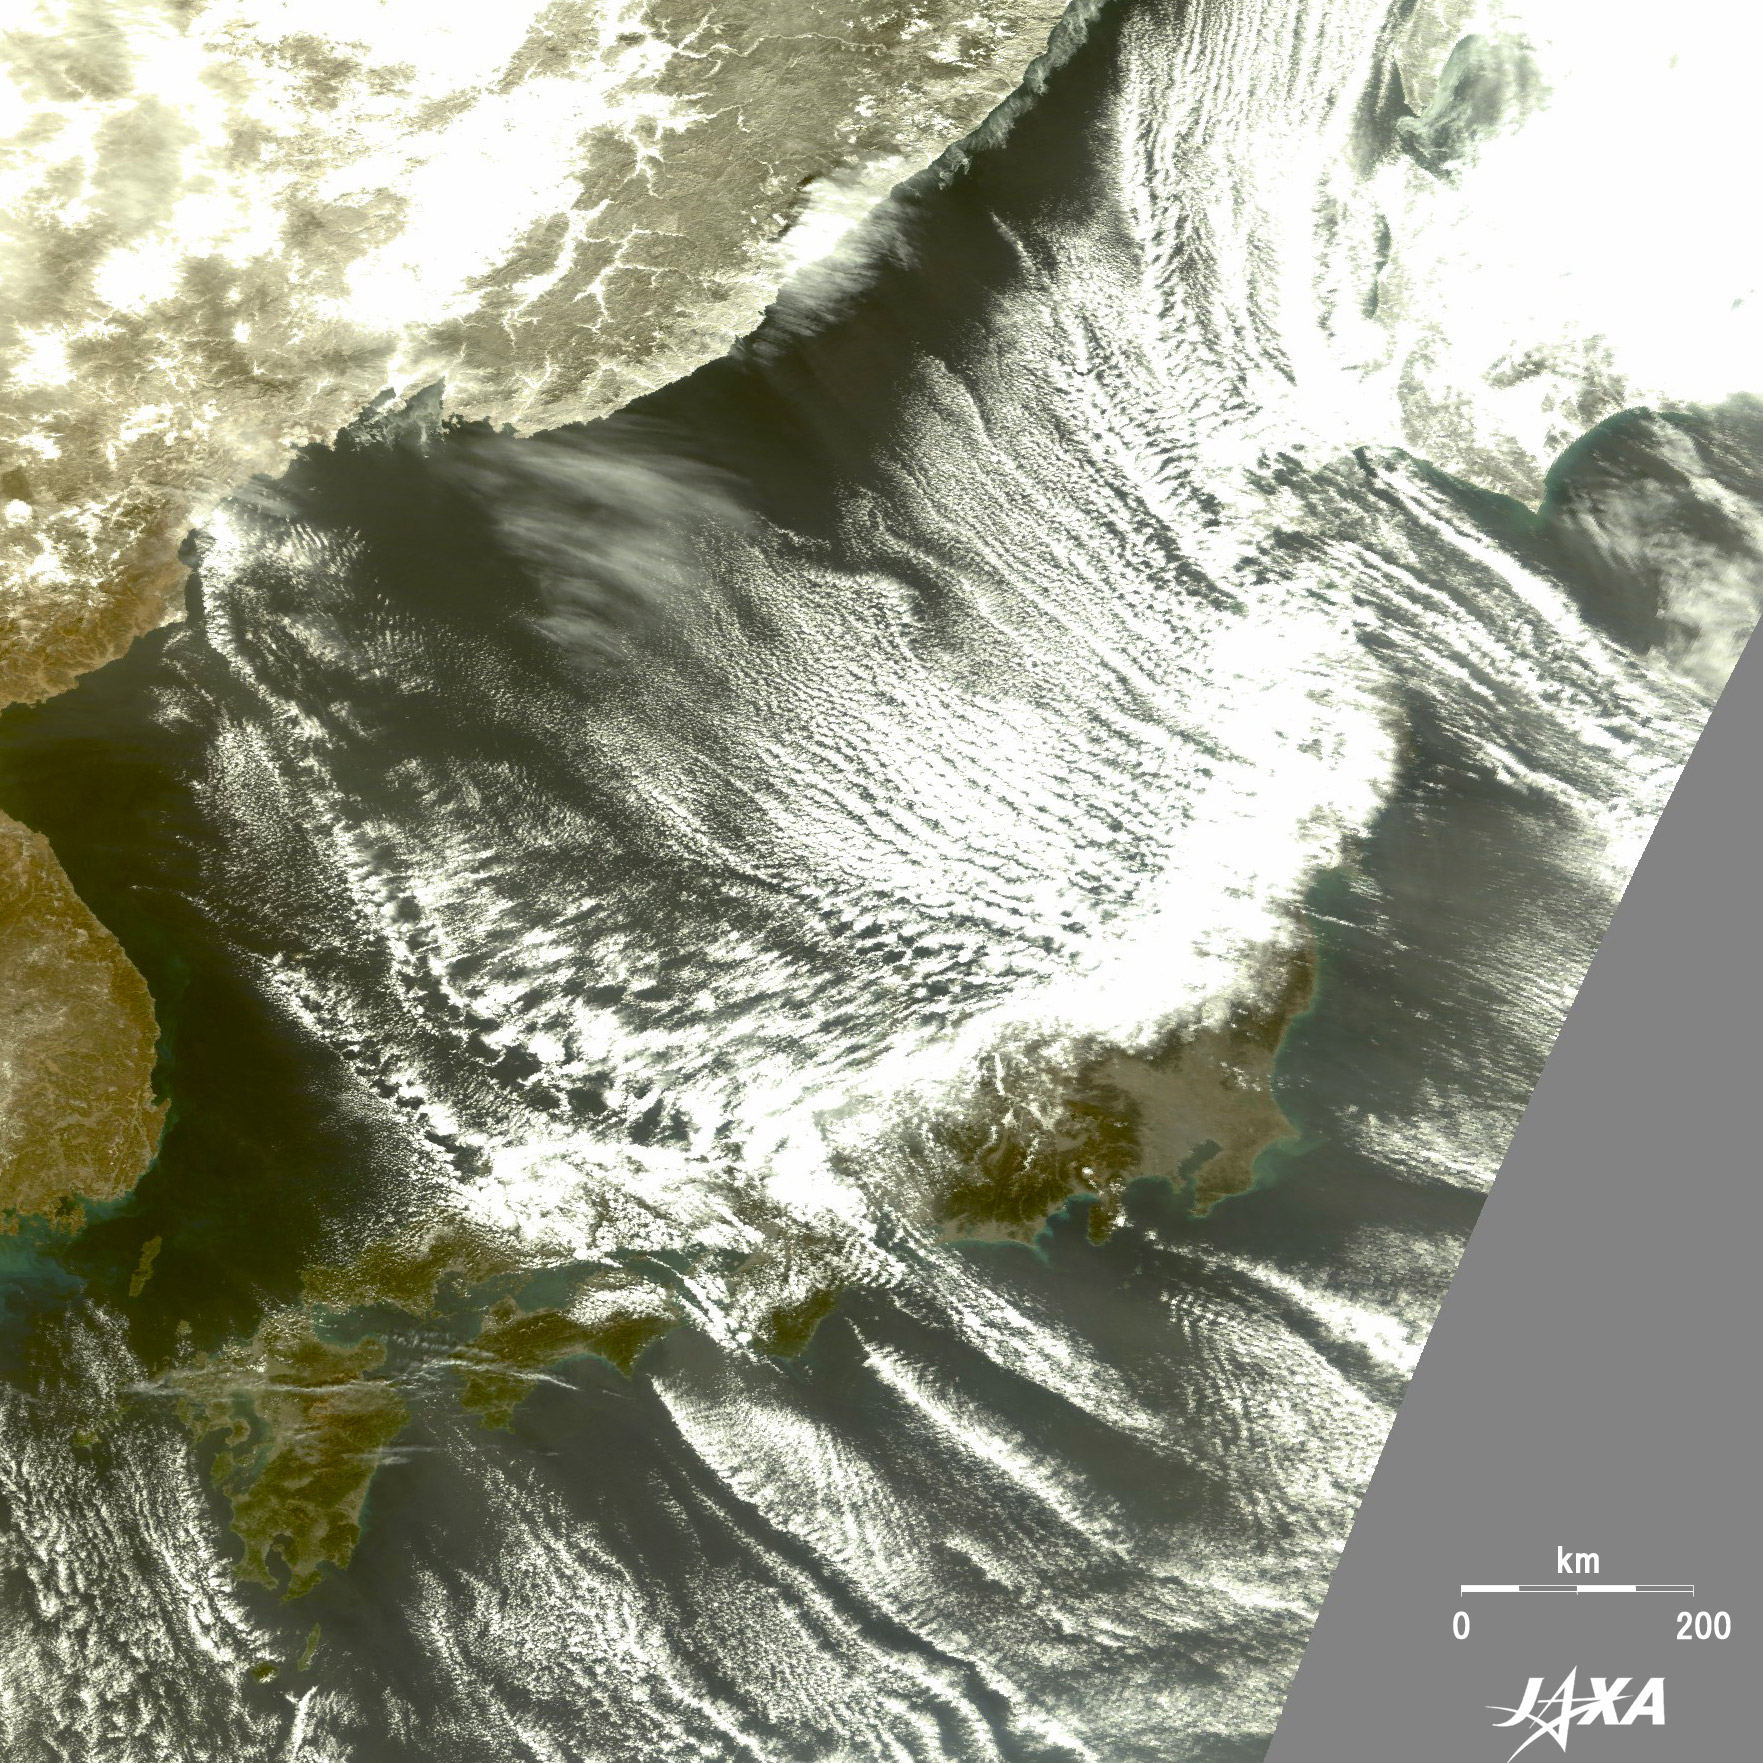 Fig. 3. Wide Area Image of the Japanese Islands
The image of the Japanese Islands in Figure 3 was taken by Terra, the Earth observing satellite of the United States, on February 21, 2009, one day before the one shown in Figure 1. This satellite observes 2,300 kilometers from east to west and can capture the entire Japanese Islands at once. The Earth Observation Center (EOC at Hatoyama in Saitama Prefecture) of JAXA (Japan Aerospace Exploration Agency) receives and processes the data daily and makes it available to the public. Figure 3 is one such image. Figure 3 reveals streaks of clouds that spread over the Japan Sea. This image shows a typical winter weather condition. It is not easy to distinguish white clouds from white snow in the image but the white pattern over the Japan Sea side can be presumed to be mostly clouds. As seen in this figure, snow clouds, created by the wind from the continent crossing over the Japan Sea, do not reach the Kanto Plain, which includes Tokyo. The shape and distribution of clouds in Figure 3 also indicates that there was snowfall on the Japan Sea side mainly in eastern and northern Japan. The observation of “Daichi” under clear weather revealed the surface condition of the next day. The figure of the mountains in Joetsu near the tunnels on the border, covered with snow, tells of the variety of climatic environments in Japan. Explanation of the Images: (Fig. 1 and 2)
AVNIR-2 has four observation bands. Figure1 and 2 composite images are produced by assigning red to Band 3 (610 to 690 nm), green to Band 2 (520 to 600 nm), and blue to Band 1 (420 to 500 nm). These are then transformed into hue, saturation, and intensity and the intensity is replaced by the Band 4 (760 to 890 nm) image. Finally, the hue, saturation, and intensity data are reversed into a color image. The resulting images give a moderate brightness of snow and ice (the brightness of snow and ice in conventional color composite using Bands 1, 2, and 3 is too strong and saturated by reflecting sun light) and have natural coloring as if seen by the naked eye. Thus, the following colors designate ground objects:
(Fig. 3)
MODIS has 36 observation bands (channels). The composite image in Figure 3 was produced by assigning red to visible channel 1 (620 to 670 nm), green to channel 4 (545 to 565 nm), and blue to channel 3 (459 to 479 nm) and has natural coloring as if seen by the naked eye. Thus, the following colors designate ground objects:
|


