| |
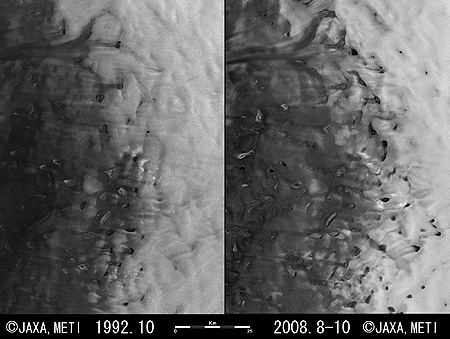 |
| Fig. 1 Changes of melt ponds on ice sheet in western Greenland in last 16 years |
Figure 1 covers an area 100 to 175km east from the coast of western Greenland and depicts the surface of the ice sheet as observed by synthetic-aperture radar. The left image was acquired by Japanese Earth Resources Satellite-1 "Fuyo-1" in October 1992, and the right one, by the Advanced Land Observing Satellite "Daichi" in August and in October of last year (2008).
In the left image, you can find that many melt ponds (ponds formed after the snow and ice on the surface of the ice sheet melted) already existed in 1992, about 16 years ago. Comparing the images on either side reveals that the ponds existing in 1992 are also existing in the same place in 2008 and that some ponds had expanded. The images also demonstrate that the number of ponds increased in 2008 and that the new melt ponds were formed in the inland area on the east side where no ponds existed in 1992, i.e. the distribution area of the melt ponds was expanded into the inland area.
The western half of the image looks dark, but the eastern half seems bright. This may be because the surfaces of the western ice sheets are smooth after snow and ice on the surface melt or were refrozen. On the eastern side, however, the snow accumulated on the surface of the ice sheet without melting. Additionally, many stripes can be seen in the east-west direction over the both images, and these might be traces of blizzards or traces of water flow on the ice-sheet surface.
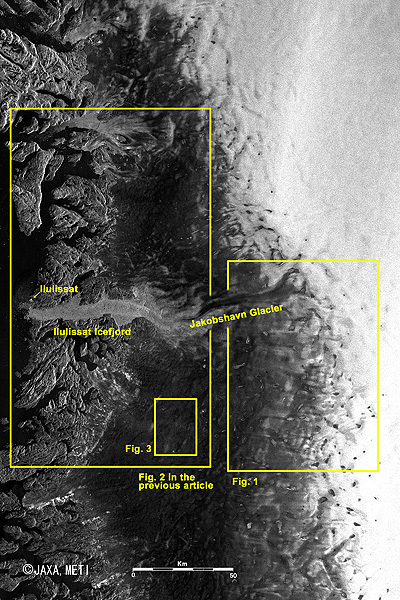 |
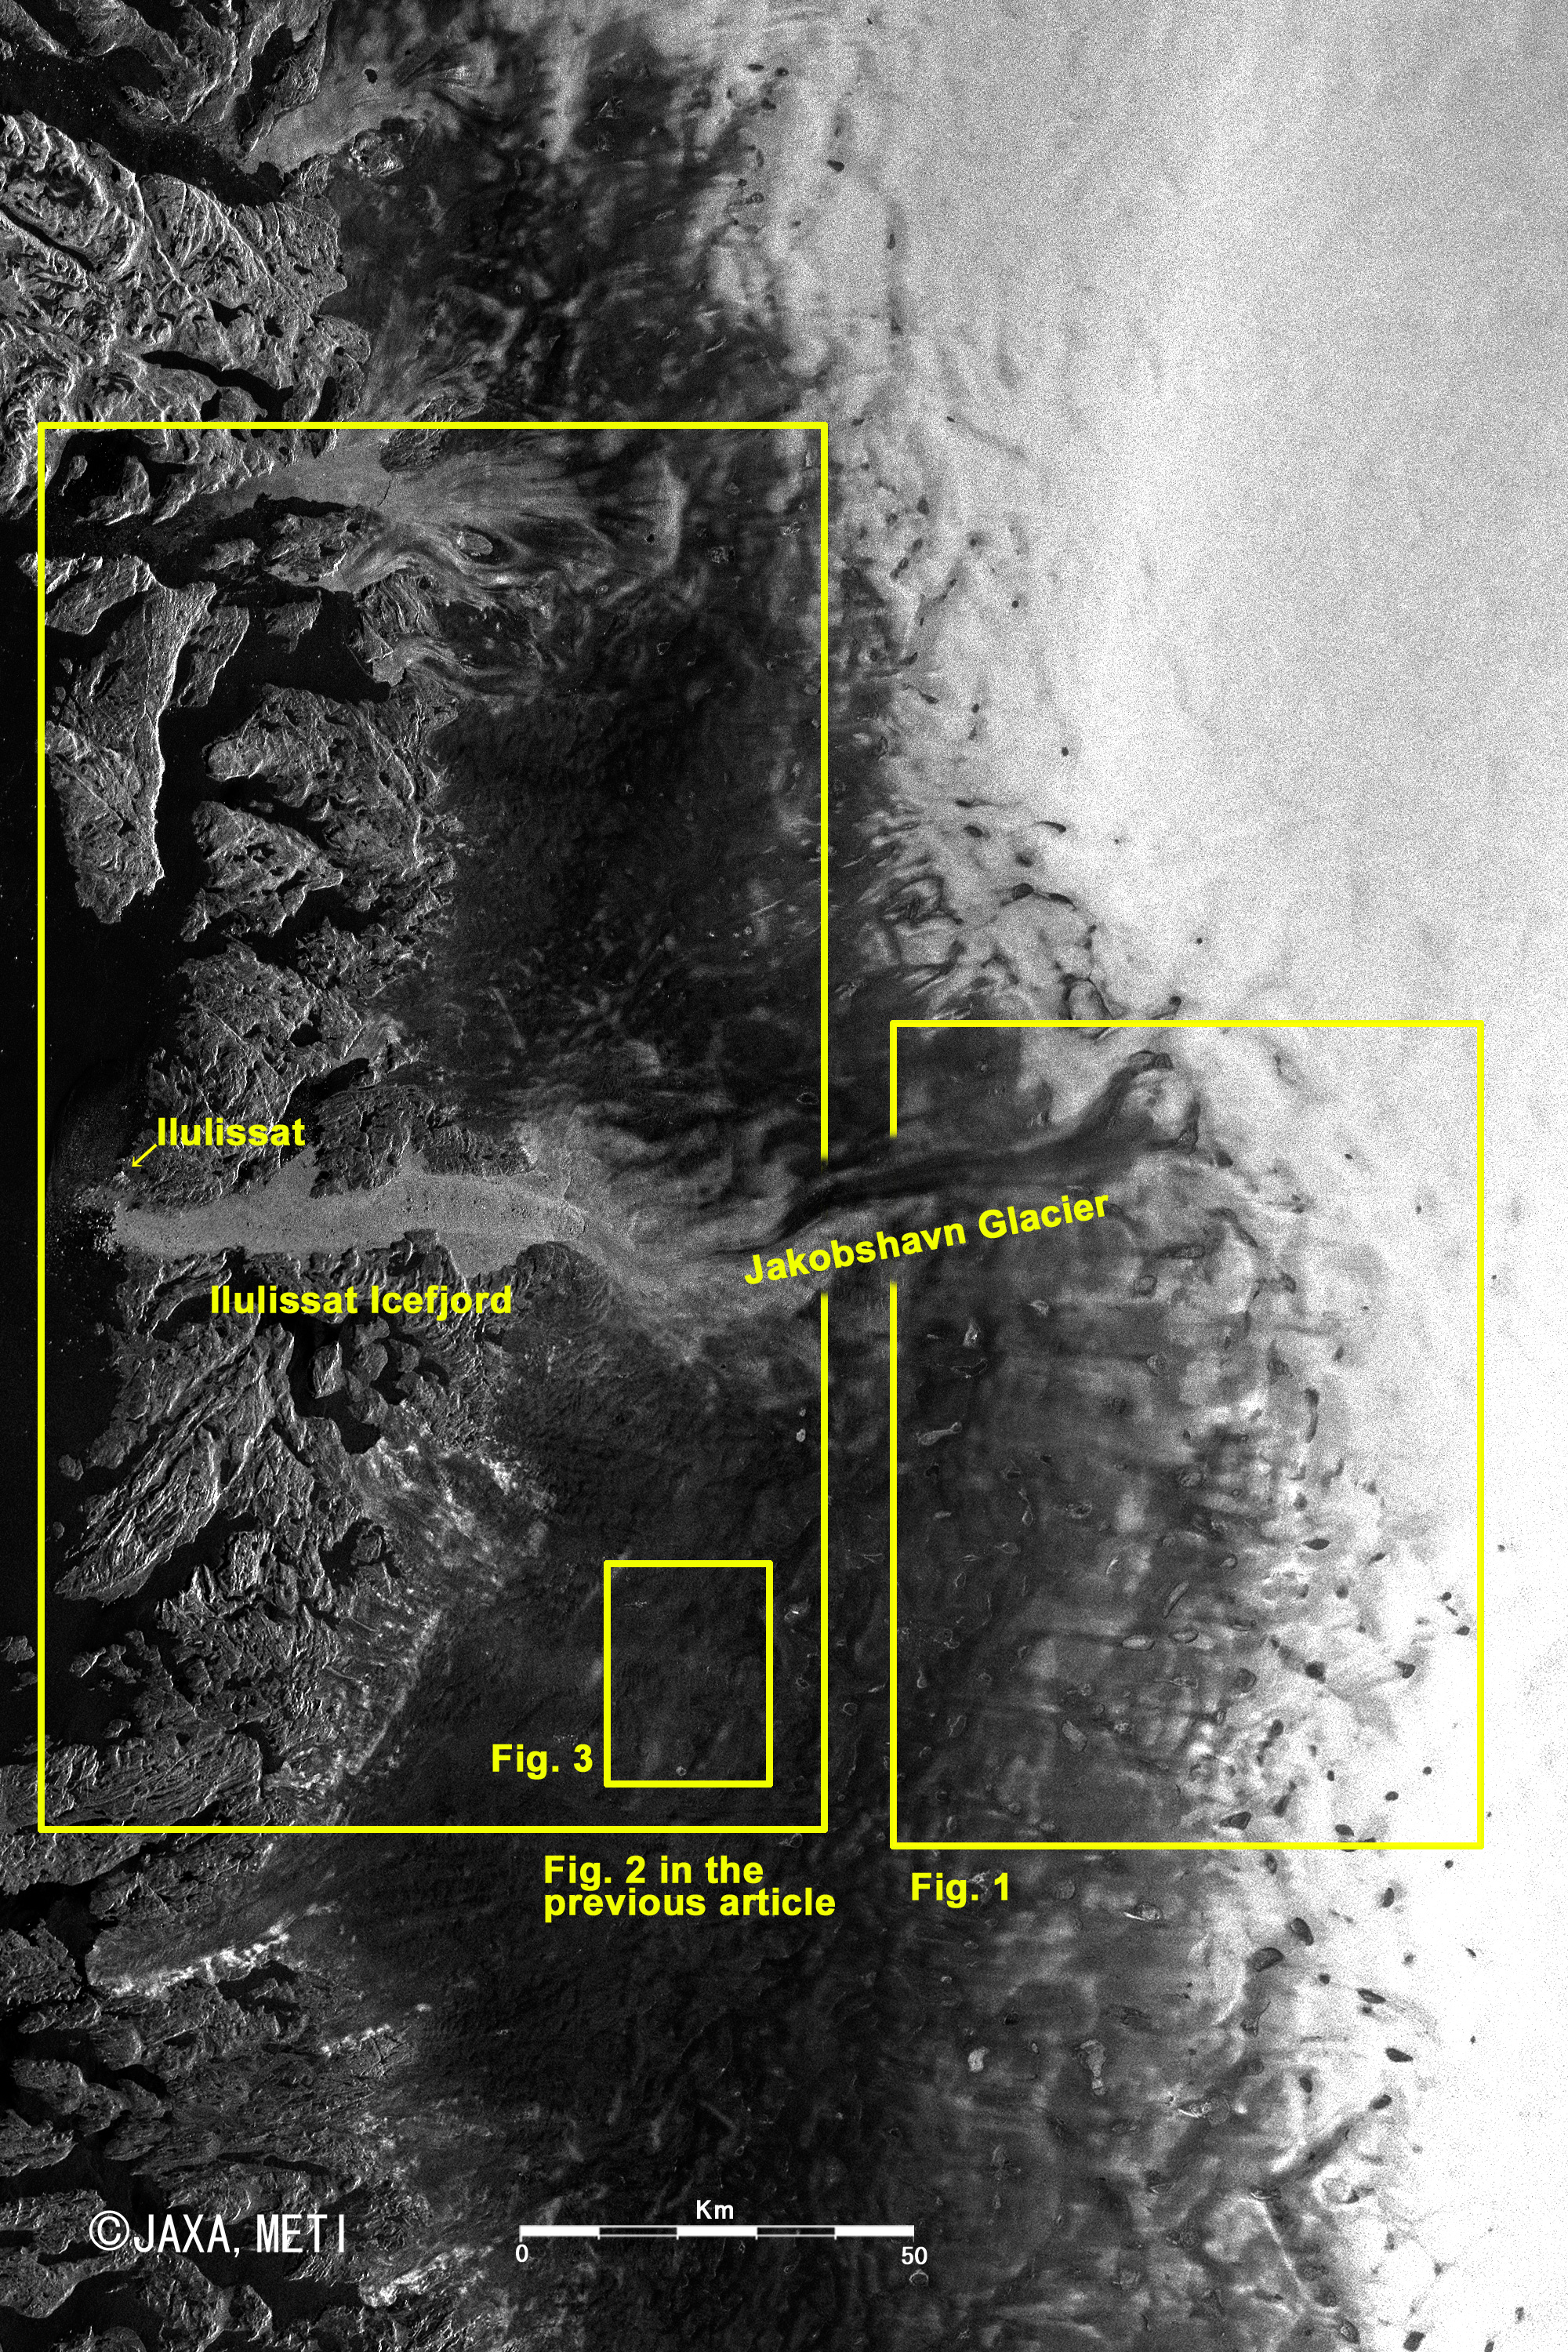
Fig. 2 Wide-Area Image of Western Greenland
Western Greenland (kmz, 3.41 MB, Low Resolution) as seen on Google Earth. |
Figure 2 presents a wide-area image of western Greenland as observed by the Phased Array type L-band Synthetic Aperture Radar (PALSAR) aboard Daichi in September 2008 with the ScanSAR mode. The figure covers an area of 190km in the east- west direction and 290km in the north-south direction. The Ilulissat Icefjord in the left center of the figure looks bright gray, and on the north side of the mouth of the icefjord, the city area of Ilulissat faces the Disko Bay and appears as a bright point. A black line with a tip like a trident extends to the east from the end of the Ilulissat Icefjord. This tip is the head of the Jakobshavn Glacier (Sermeq Kujalleq in Greenlandic). Exposed rocks and fjords form complicated patterns in the western zone, next to the sea. There are also a black ice-sheet zone where the surface is smooth, a white zone dotted with black melt ponds, and the white genuine ice sheet.
The big yellow frame in the left side containing Ilulissat Icefjord indicates the coverage of Fig. 2 of the previous article "Melting Ice Sheet in Western Greenland." The area of Fig. 1 is located to the east of the big yellow frame.
In the ScanSAR mode, the ground resolution of PALSAR decreases to 100m, but it can observe the Earth’s surface with a swath of 250 to 350km and is therefore suitable for monitoring the ice sheets on vast Greenland.
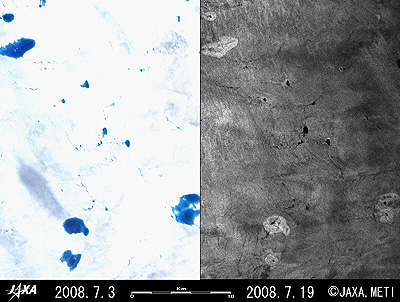 |
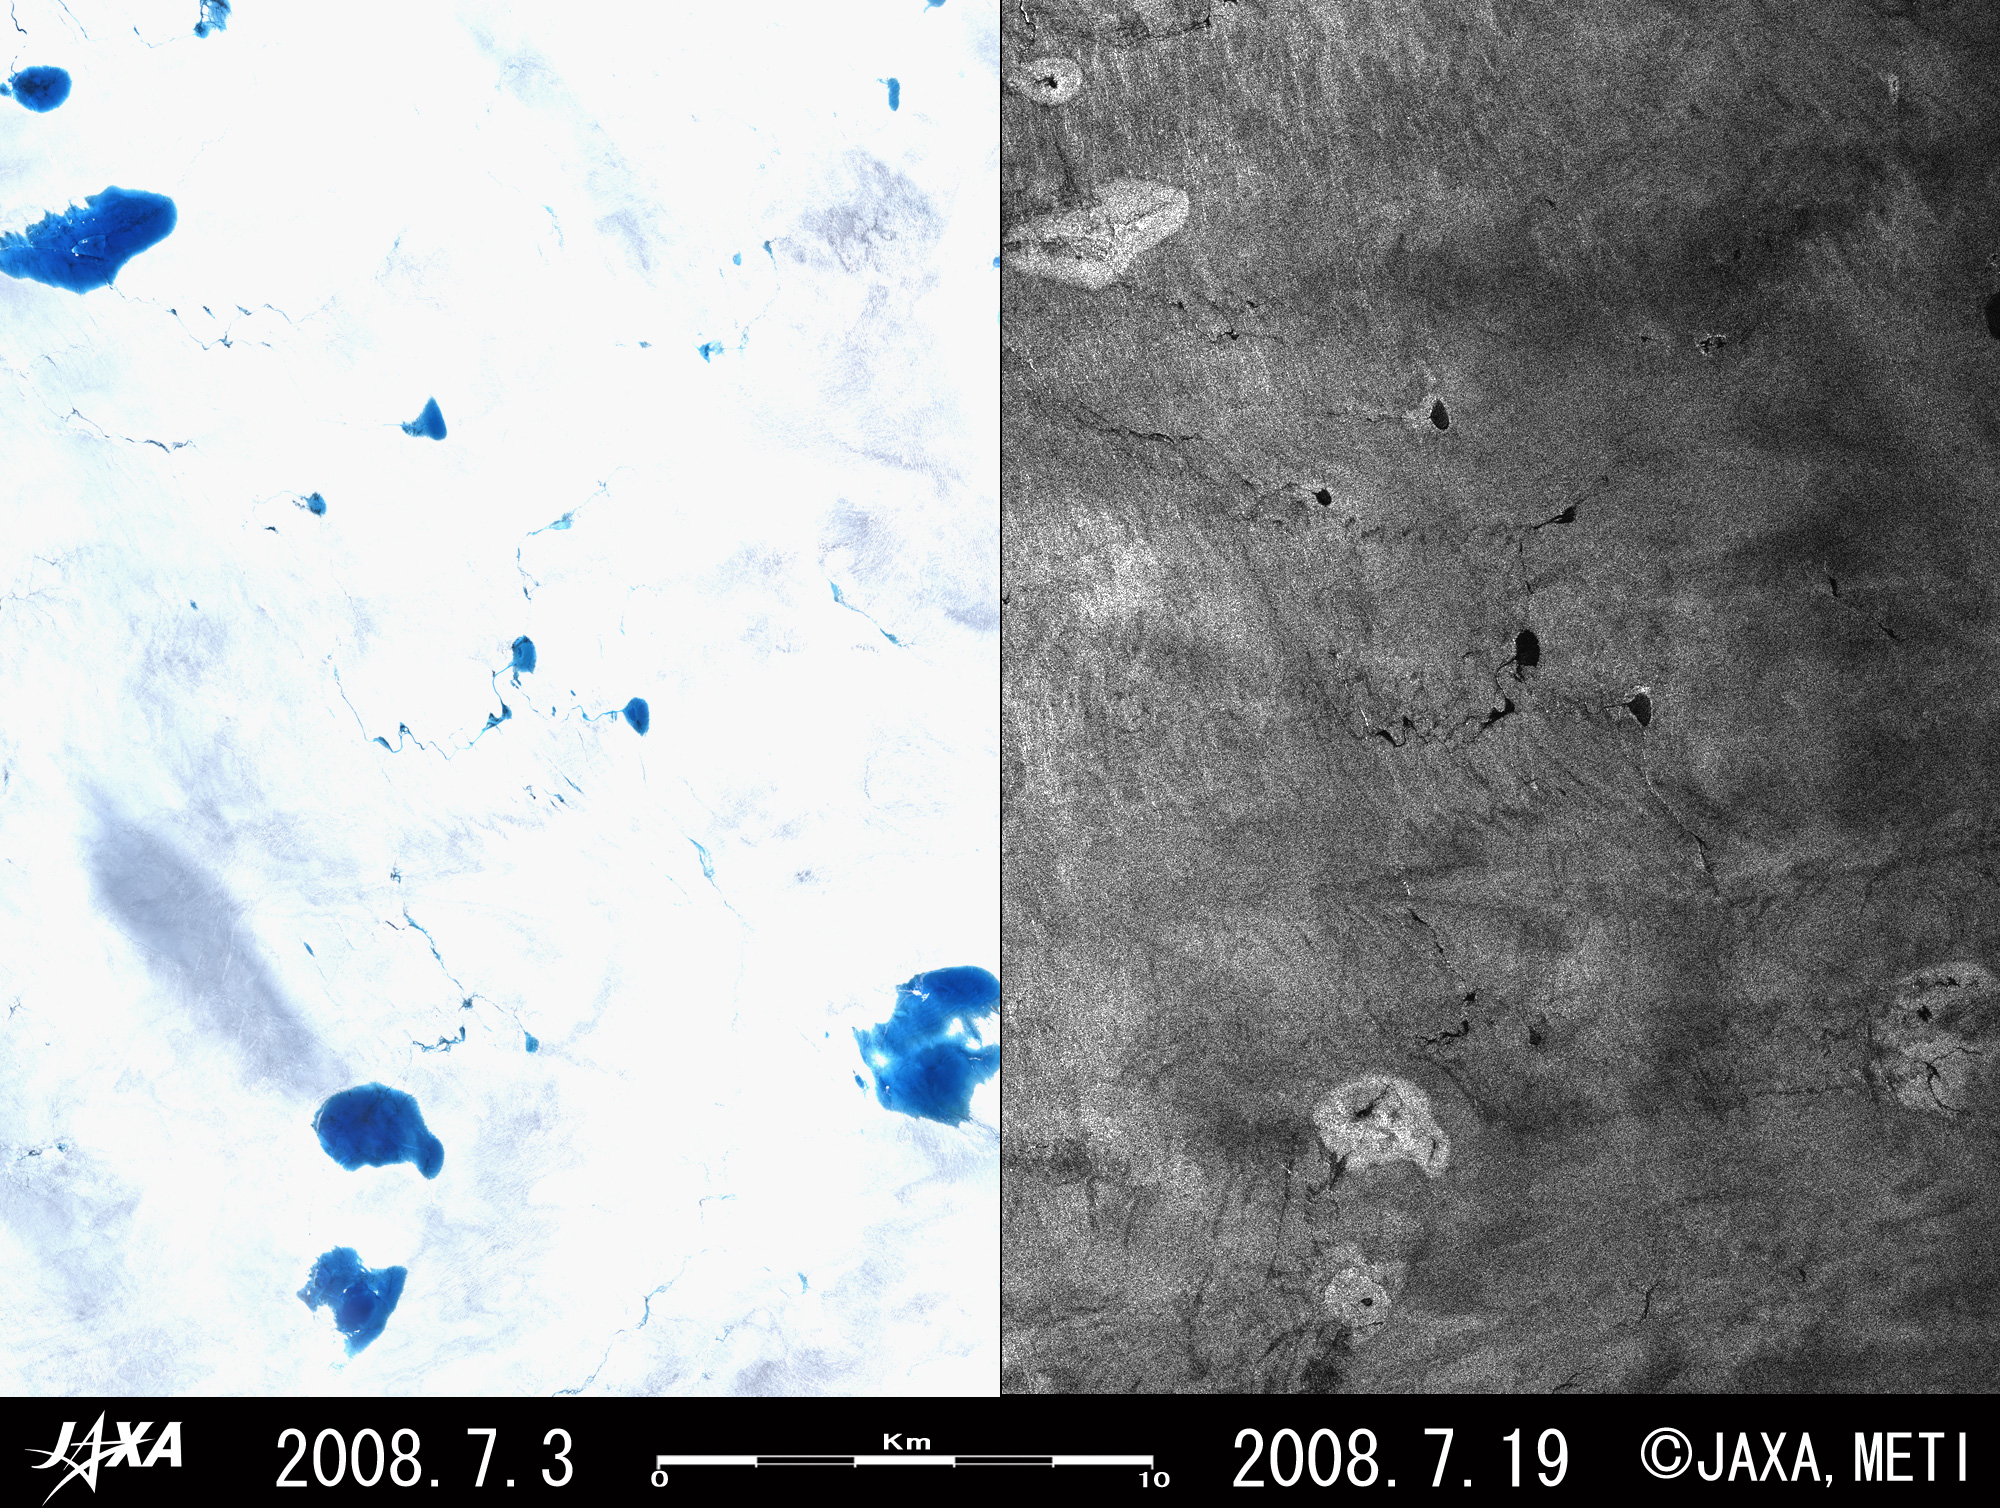
| Fig. 3 Different melt pond appearances |
Figure 3 covers the area about 100km southeast from Ilulissat, the same area as depicted in Fig. 4 of the previous article. The left side image was acquired by the optical sensor AVNIR-2 in the daytime of July 3, 2008, and the right side image was acquired by PALSAR in the nighttime about two weeks later.
The melt ponds that appear blue in the left image look as black as ink or brighter than the surroundings in the right image. The melt ponds look black because very little of PALSAR’s radar signal is returned to the satellite, indicating that the surface is smooth, unfrozen water. The fact that the melt ponds appear bright gray suggests that some of PALSAR’s radar signal returns to the satellite, suggesting that the frozen surface contains many air bubbles or that the water surface is ruffled but unfrozen.
Melt ponds are thus seen differently by optical sensors like AVNIR-2 and radar sensors like PALSAR. However, radar sensors, which can observe the Earth’s surface day and night regardless of clouds, are able to monitor the ice sheets in Greenland. This is difficult for optical sensors because most of Greenland is located within the Arctic Circle, and when winter approaches, the sunlight weakens and the area enters polar night.
Explanation of the Images:
Fig. 1 left
Synthetic-aperture radar can observe the Earth's surface day or night and in all weather. The acquired images are monochrome, and targets that strongly reflect the radar signal transmitted from the synthetic-aperture radar appear bright. The image of Fig. 1 left was produced by mosaicking six SAR images. The ground resolution was reduced to 75m in Fig. 1 left in order to cover a wider area.
Fig. 1 right, Fig. 2 and Fig. 3 righ
| Satellite: |
Advanced Land-Observing Satellite (ALOS) (Daichi) |
| Sensor: |
Phased Array type L-band Synthetic Aperture Radar (PALSAR) |
| Date: |
0105 (UTC), August 29, 2008 (Fig. 1 right)
0102 (UTC), October 26, 2008 (Fig. 1 right)
1428 (UTC), September 15, 2008 (Fig. 2)
0110 (UTC), July 19, 2008 (Fig. 3 right)
|
| Frequency: |
1,275MHz (L band) |
| Polarization: |
HH |
| Ground resolution: |
12.5m (Fine mode, Figs. 1 and 3)
100m (ScanSAR mode, Fig. 2)
|
| Map Projection: |
Universal Transversal Mercator (UTM) |
Figures 1 right, 2 and 3 right indicate the strength of the PALSAR-transmitted radar signal as it is scattered back by the Earth's surface. Therefore, smooth water surfaces and smooth surface glaciers and ice sheets appear black because they hardly return any radar signal, and rough surface ice sheets appear bright because they strongly reflect the signal.
PALSAR was developed by improving the functions and performances of the synthetic aperture radar (SAR) that flew aboard JERS-1. Figure 1 right was produced by mosaicking six PALSAR images. The ground resolutions were reduced to 75m in Fig. 1 right and 20m in Fig. 3 right in order to cover a wider area.
Fig. 3 left
AVNIR-2 has four observation bands. This figure was composed by assigning red to visible Band 3 (610 to 690nm), green to visible Band 2 (520 to 600nm), and blue to visible Band 1 (420 to 500nm). The resulting image has natural coloring as if seen by the naked eye. In this image, snow and ice are white or pale gray, exposed rocks are dark brown, and water surfaces are dark blue or light blue. Areas with no data are black. The ground resolution of Fig. 3 left was reduced to 20m in order to cover a wider area.
|
|