| |
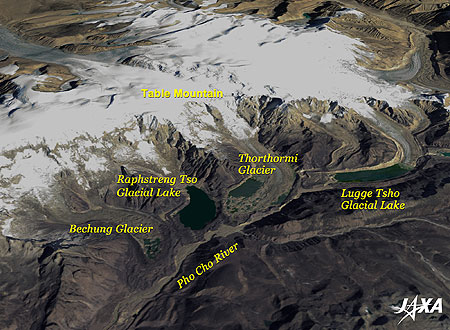 |
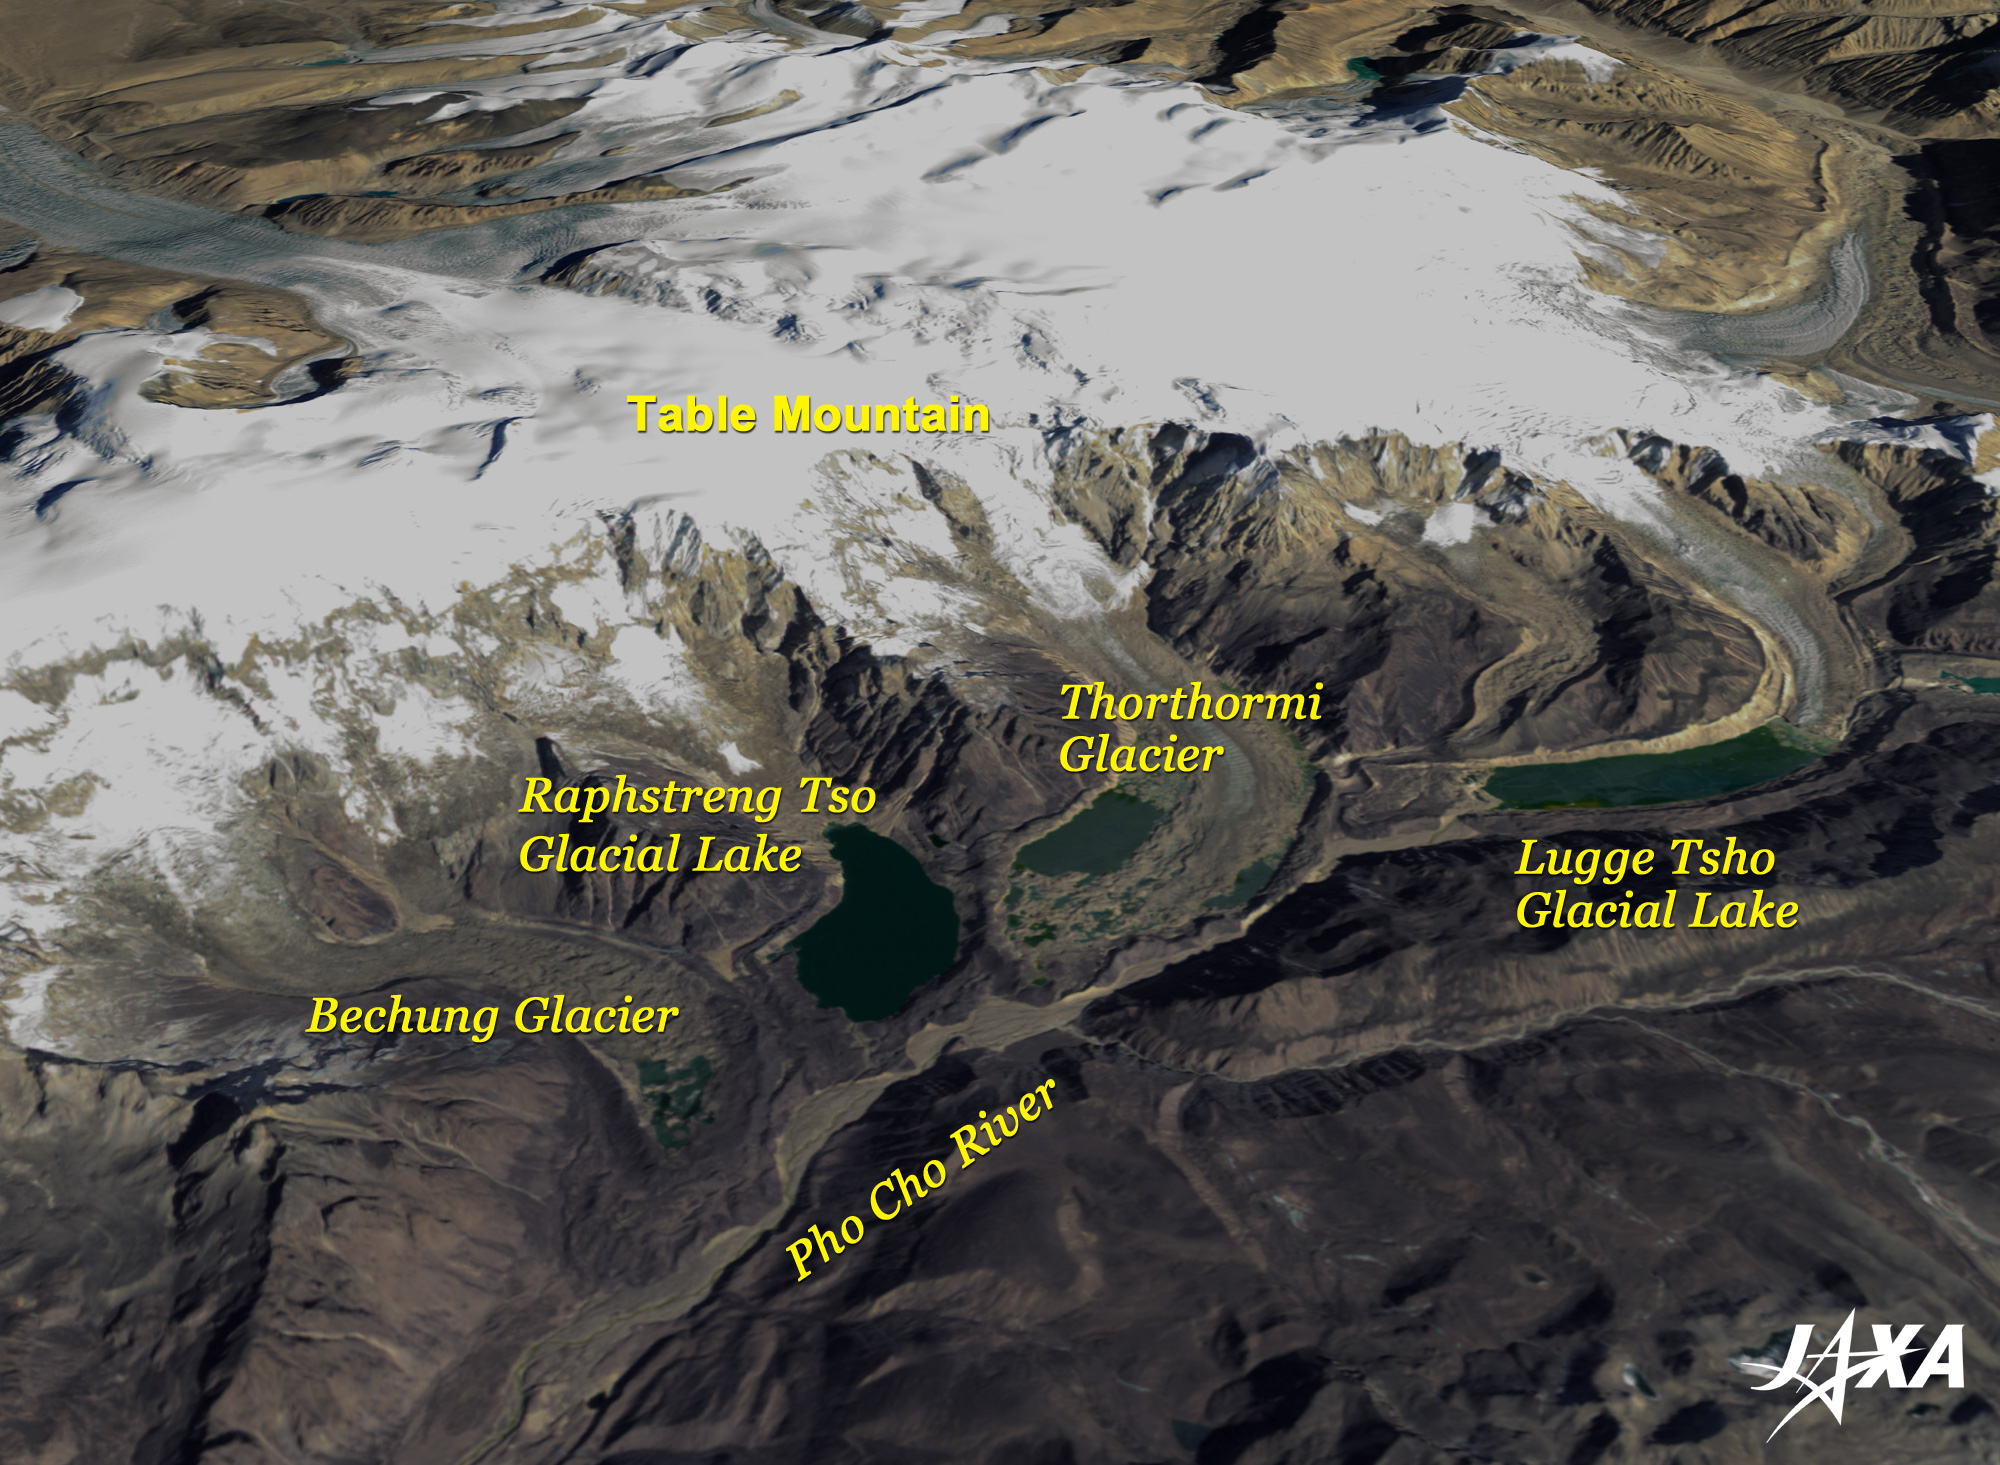
| Fig. 1. Glacial Lakes in Bhutan |
Figure 1 depicts the glacial lakes in Bhutan Himalayas, located east of the Himalayas that extend 2,400km from west to east, seen from the sky on the southern side. This bird's eye view was made from the image observed by the Advanced Land Observing Satellite "Daichi" in June 2007 by using the altitude data acquired by Daichi in December 2007 (partially complemented by other data).
Lugge Tsho Glacial Lake (4,500m above sea level) is on the far right side (most eastern side), and a gray line stretches from the southwestern end of the lake to the lower reaches. This is the trace of the muddy stream when an outburst flood occurred after the terminal moraine, which kept back the glacial lake, partially collapsed on October 7, 1994. The muddy stream reached the ancient city of Punaka (1,300m above sea level) about 90km downstream. It destroyed bridges, waterwheels and houses; wiped away yak livestock and comestible cereals; and created much damage including about 20 casualties. The old Chinese word "kiyu" means the fear of heaven falling, and that became true here in Bhutan.
The second glacier from the right is Thorthormi Glacier, and there is a glacial lake on the surface of the terminal of the glacier. The third is the Raphstreng Glacier, which also has a lake (Raphstreng Tso Glacial Lake), and you can also see some small glacial lakes on the terminal of the far left (west) glacier, Bechung Glacier.
Table Mountain, which is seen in the background of these glaciers and glacial lakes, has a 6,000m high table-shaped area extending 20km from east to west and 15km from north to south; it is covered with an ice field. The southern side drops sharply to the 4,000m high glaciers, but the gently- sloping ice fields extend northern side.
News reports said that in the first Asia-Pacific Water Summit held in Beppu, Japan, in December 2007, Bhutan's Prime Minister Kinzang Dorji stated that people in the Himalayas face the threat of floods caused by the collapse and rupture of glacial lakes due to global warming.
According to the Intergovernmental Panel on Climate Change (IPCC) report, most mountain glaciers and ice caps have been shrinking, with the retreat probably having started around 1850. The reports also said that the late 20th-century glacier wastage has probably been a response to post-1970 warming. The melting of glaciers is worrisome because it might cause floods due to the formation and overflowing of glacial lakes, resulting in decreased freshwater resources and a rising sea level.
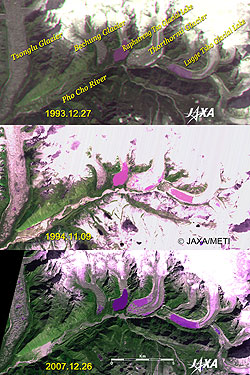 |
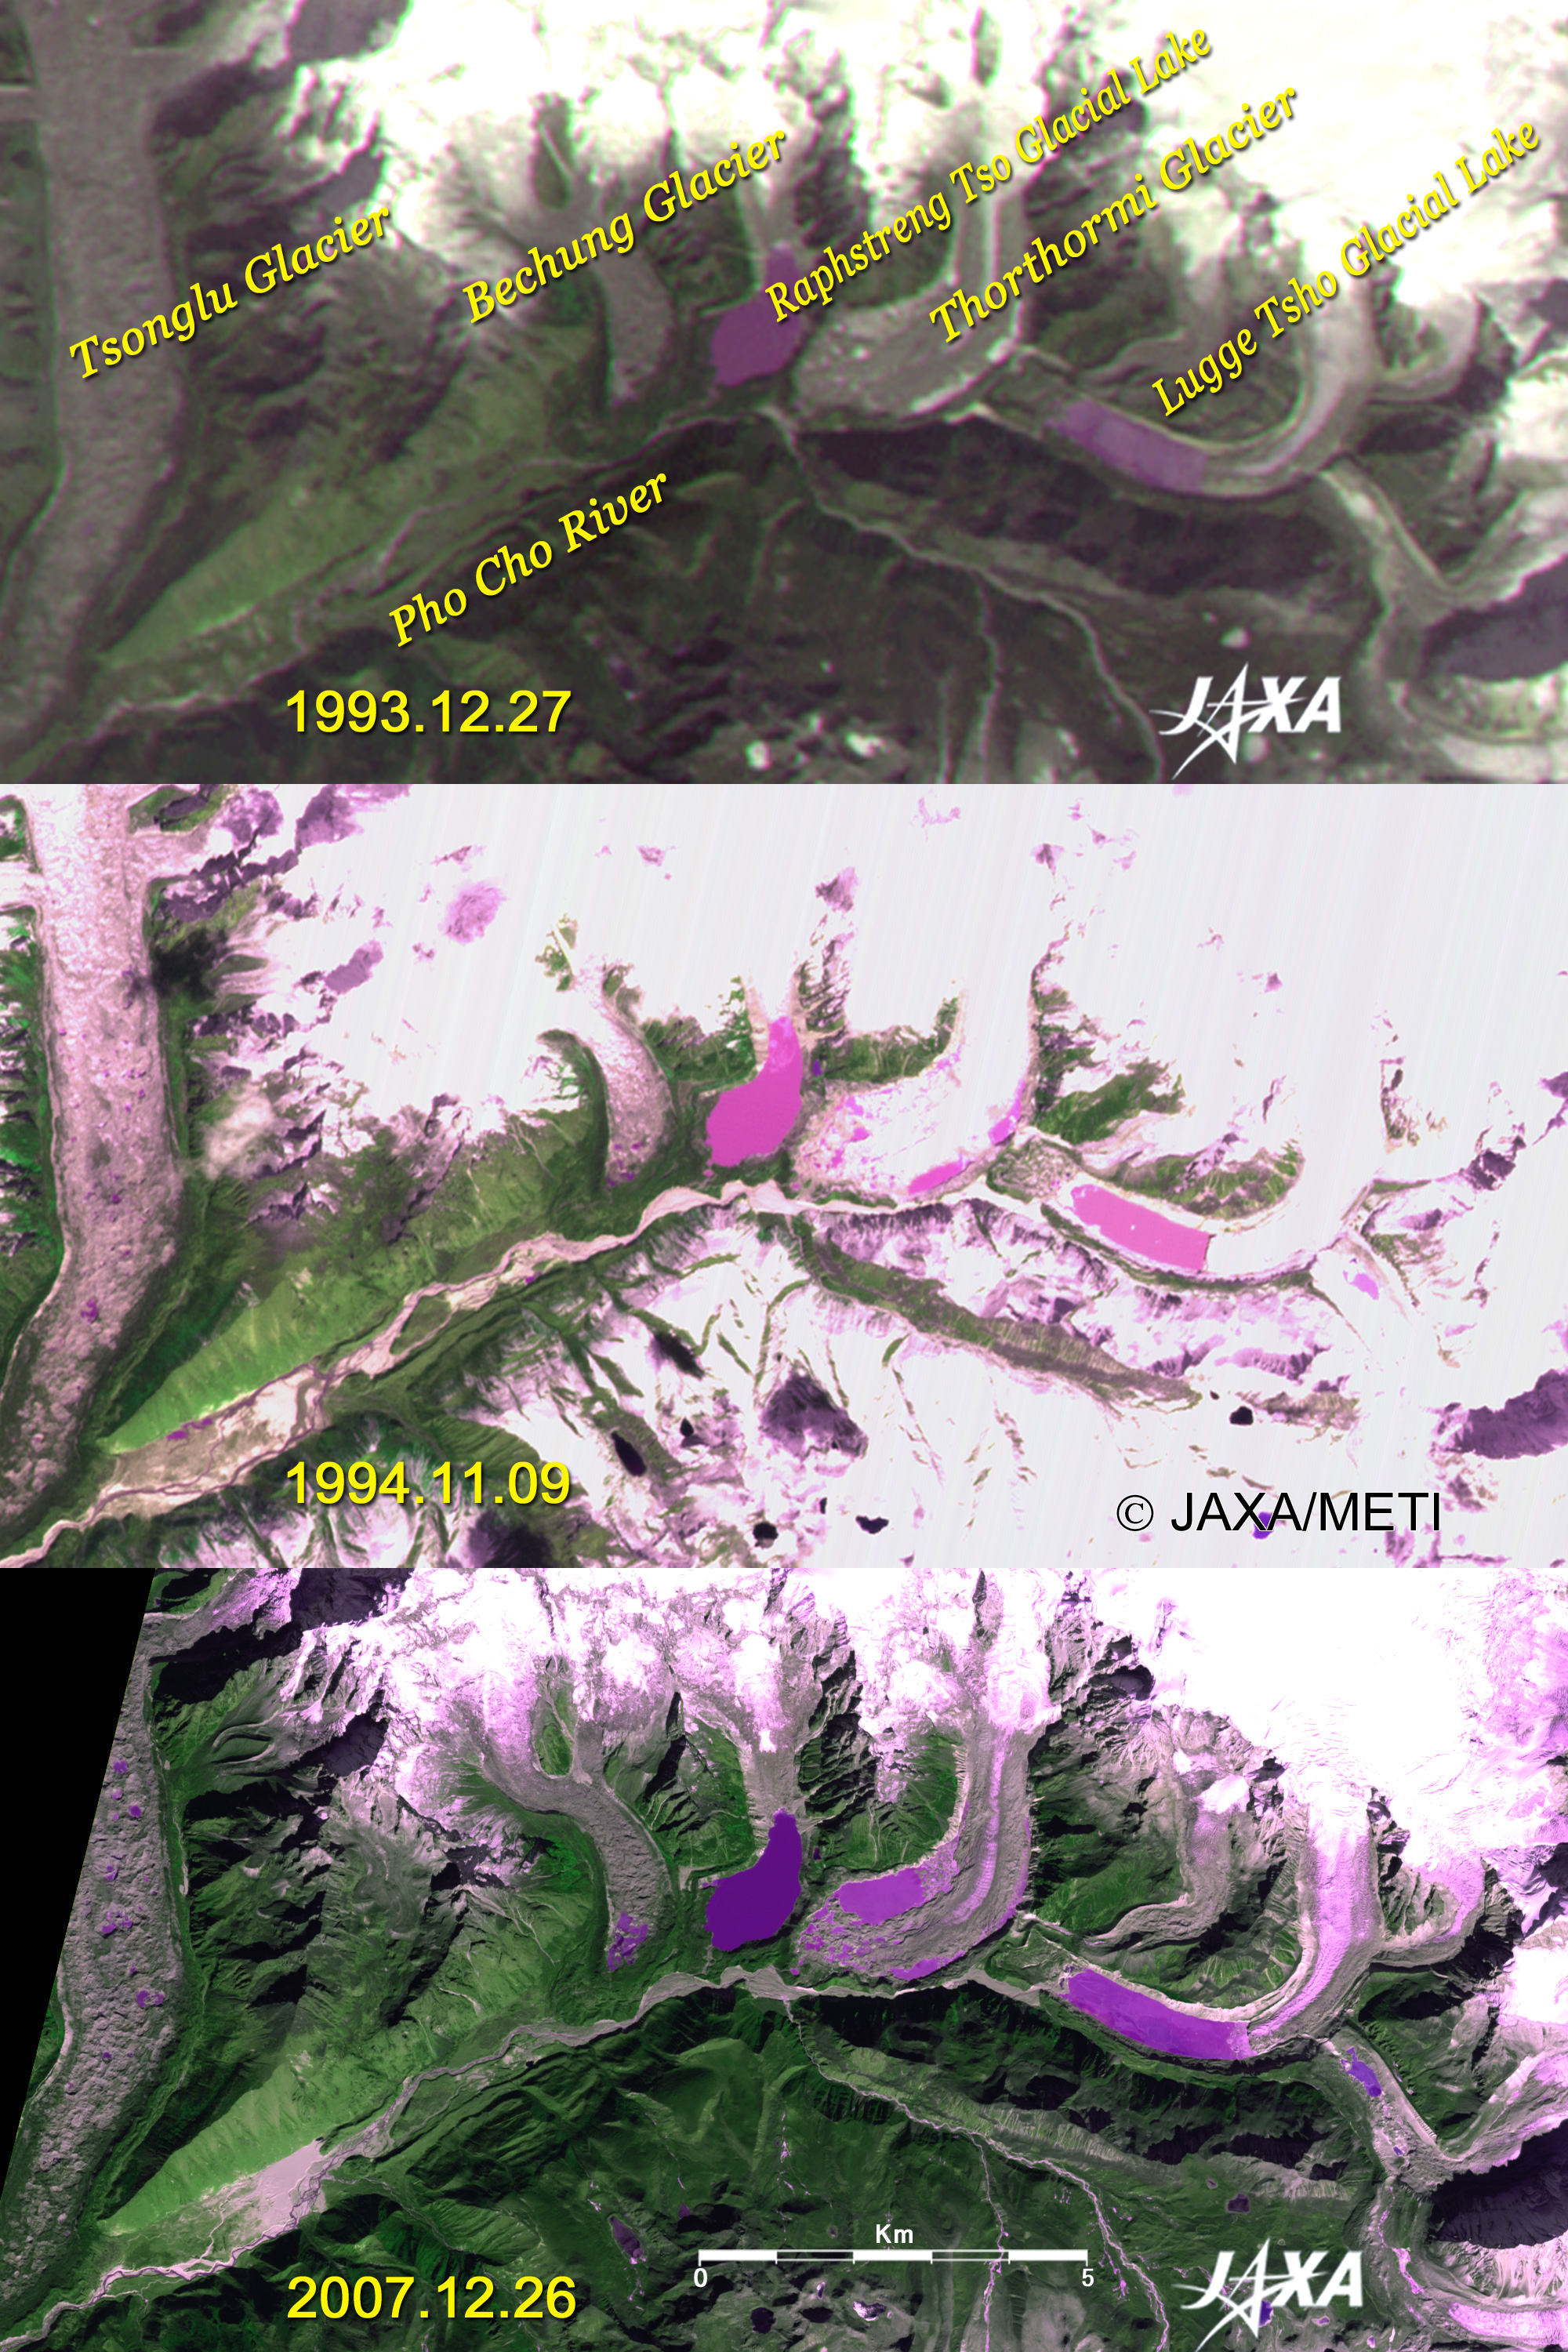
| Fig. 2. Changes of Glacial Lakes in Bhutan |
Figure 2 depicts the glacial lakes in Bhutan before Lugge Glacial Lake burst (December 27, 1993), after it burst (November 9, 1994) and at present (December 26, 2007).
The surface area of Lugge Glacial Lake decreased after the burst but has now become bigger than before the burst, raising concerns it may burst again. The area of Raphstreng Tso Glacial Lake has hardly changed. There were almost no glacial lakes on Bechung Glacier and Thorthormi Glacier in 1993, but small supra glacial lakes formed on the surfaces of their terminals the following year and continued to expand after that.
The table below lists the surface area of each glacial lake (measured from Fig. 2).
| Table 1. Changes of Surface Area of Glacial Lakes in Bhutan |
| |
Bechung |
Raphstreng |
Thorthormi |
Lugge |
| Area on Dec. 27, 1993 (ha) |
1 |
127 |
0 |
118 |
| Area on Nov. 9, 1994 (ha) |
4 |
130 |
41 |
96 |
| Area on Dec. 26, 2007 (ha) |
18 |
126 |
88 |
127 |
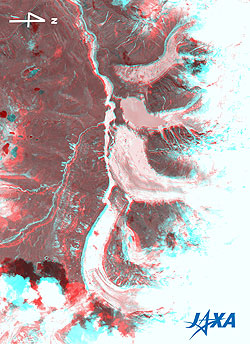 |
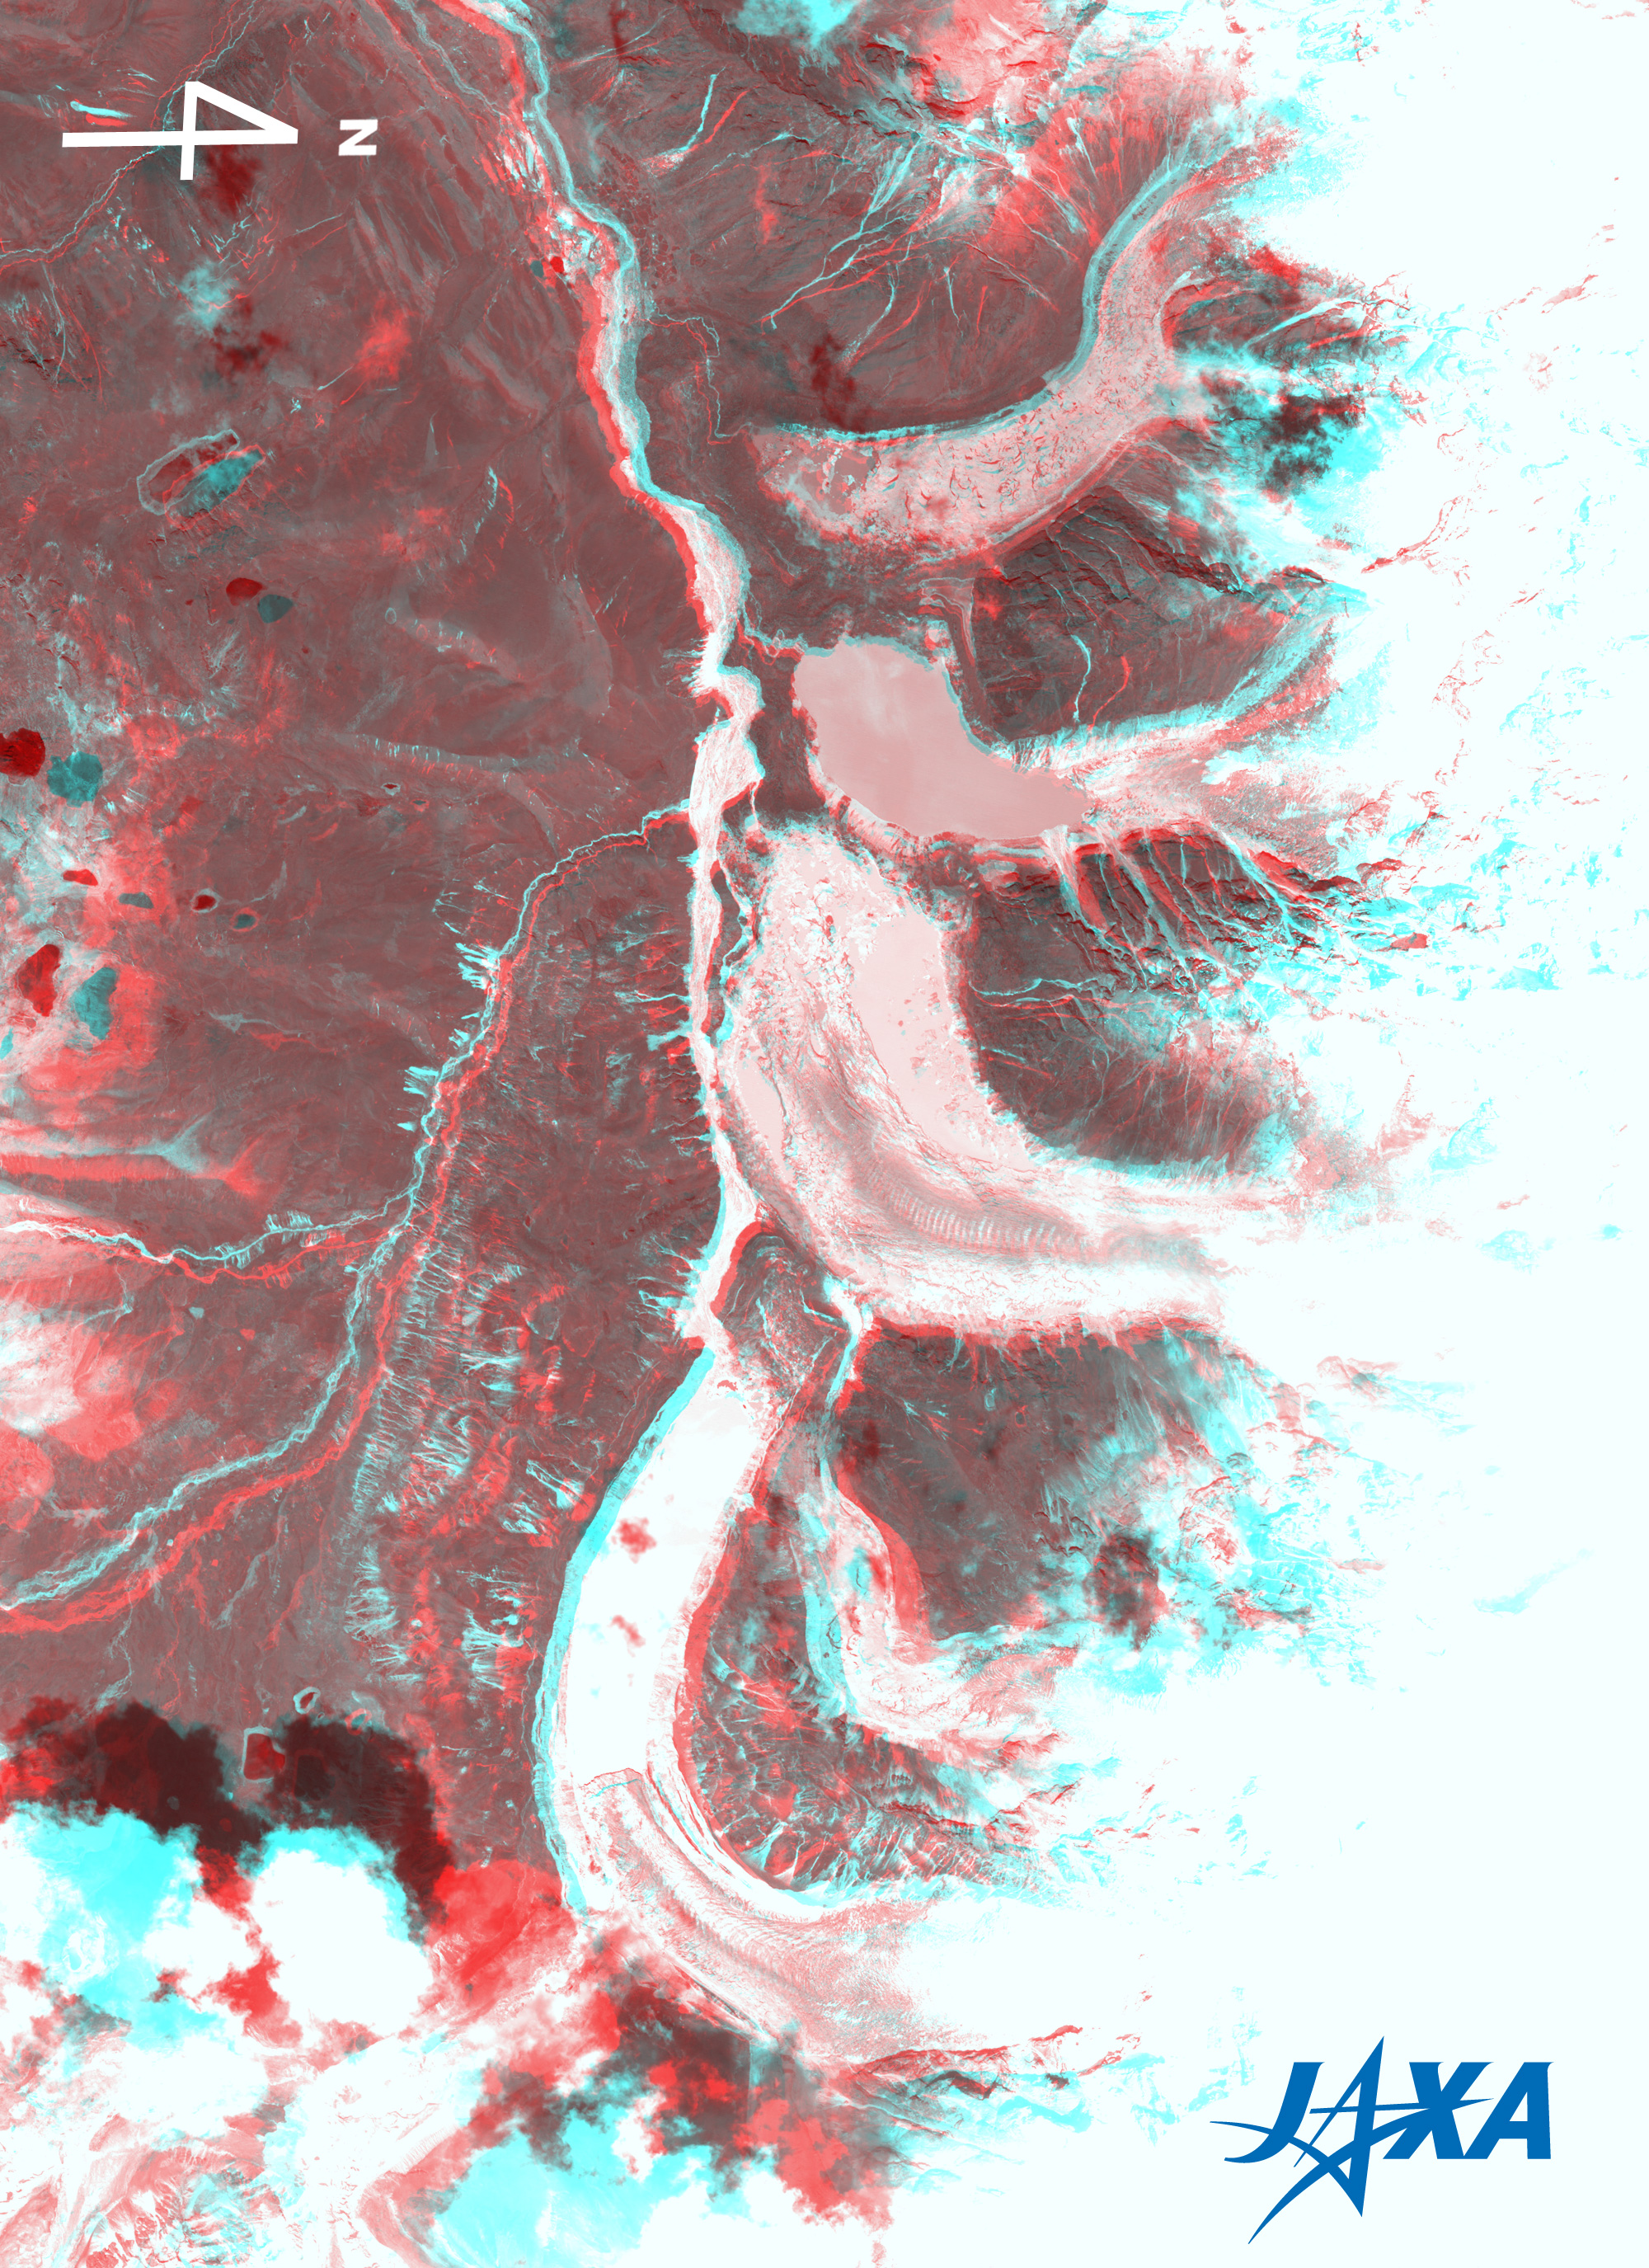
Fig. 3. Three-Dimensional View of Glacial Lakes in Bhutan
(Staring at the image for a long time may cause eye-strain.
A color print is available in pdf format. Pdf files for the left and right eyes are also available for stereoscopic viewing.) |
Figure 3 is a three-dimensional view around the glacial lakes in Bhutan based on the nadir and backward-looking images acquired by PRISM in June 2007. Note that the right side is north in this figure.
If you view this figure with red and blue glasses, you can see four distinct terminals of glaciers including glacial lakes forming a line by stair-stepping, the deep valleys branching, and the rivers flowing on the bottom of the gorges.
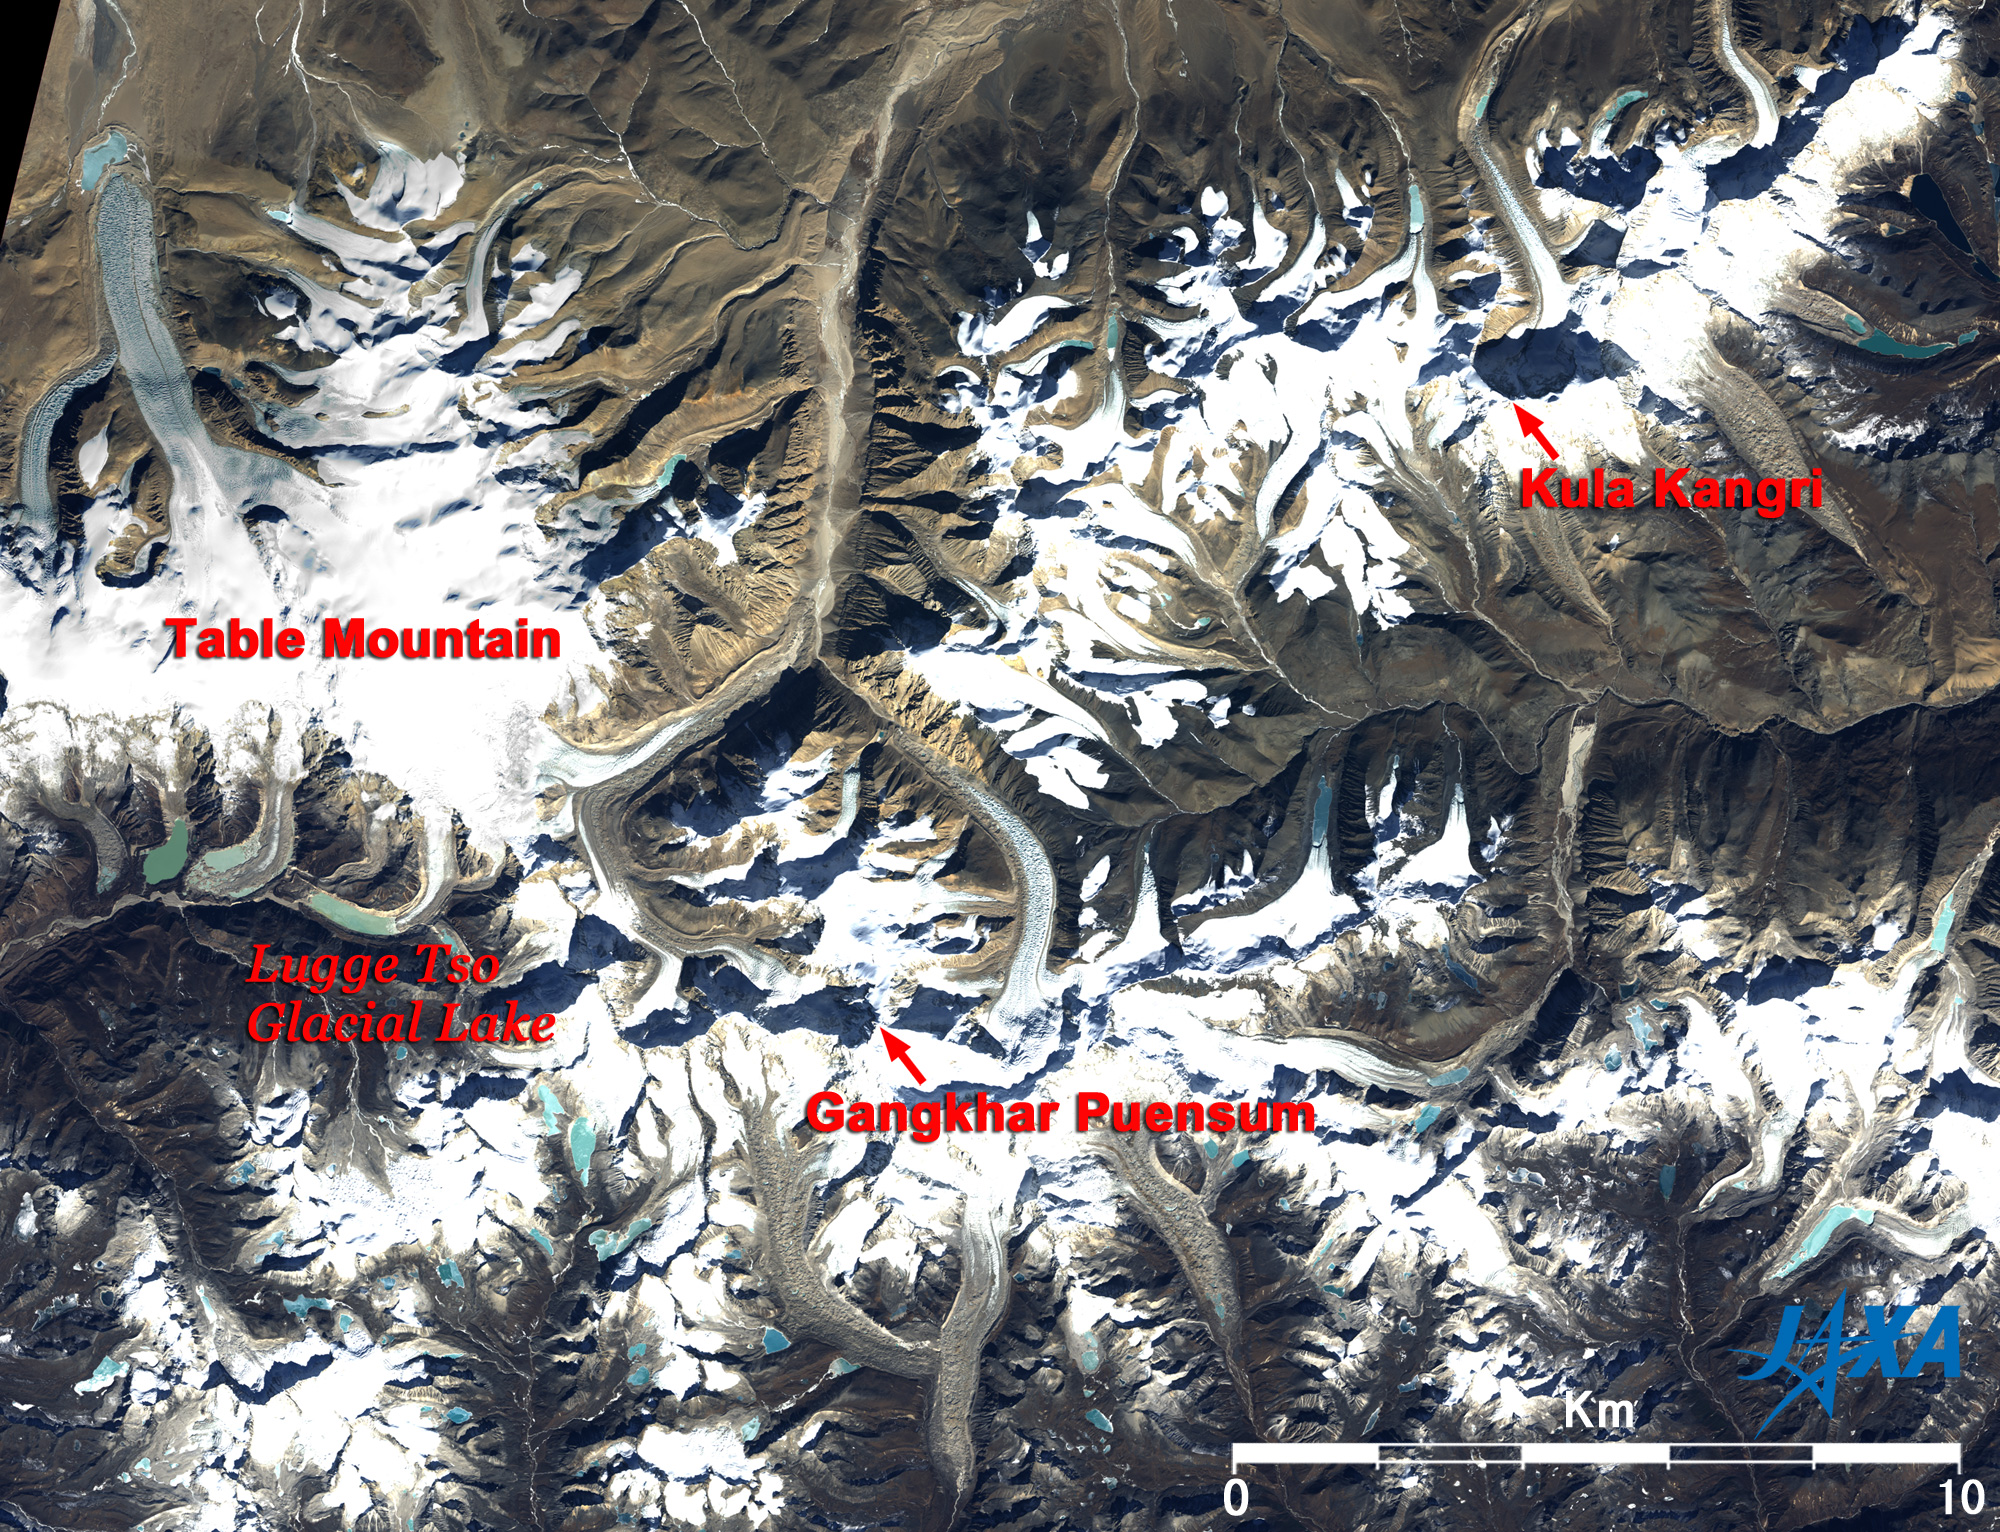
Figure 4 is a movie and a wide-area image of the eastern part of the Bhutan Himalayas. The movie is a continuous image as if you were flying over the glaciers. Lugge Glacial Lake is on the left of the image, and Table Mountain is north of it. At the bottom of the image is Mt. Gangkhar Puensum (7,570m above sea level), which is located on the border between Bhutan and China. It is the highest peak in Bhutan, and its untrodden tops make it the world’s highest unclimbed peak. In the upper right of the figure is Mt. Kula Kangri (7,538m) located on the Chinese side (northern side) of the border between China and Bhutan, and the steep wall of the northern flank can be seen as a large shadow. Many white and brown glaciers and many light blue and greenish brown glacial lakes can also be seen.
Explanation of the Images:
Figs. 1, 4 and Full Image - Click the images twice to enlarge them.
AVNIR-2 has four observation bands. The surface image in Fig. 1 and the full image were composed by assigning red to visible Band 3 (610 to 690nm), green to visible Band 2 (520 to 600nm), and blue to visible Band 1 (420 to 500nm). The resulting images have natural coloring as if seen by the naked eye. In these images, snow and clouds are white; glaciers are white or light brown; exposed rocks, soil and sand are brownish; and hay is dark brown. Areas with no data are black. Additionally in Figs. 1, 4 and the full image, a part or all of the intensity data was replaced with Band 4 (760 to 890nm) data in order to reduce saturation of the brightness near Table Mountain.
Upper image of Fig. 2
The figure was produced by assigning red to the visible channel (610 to 690nm), green to the near-infrared channel (720 to 800nm), and blue to the visible channel (510 to 590nm). As a result, the figure has a nearly natural coloring, with vegetation slightly emphasized. In this image, snow and ice are white or pale purple, forests are dark green, and grassland is light green.
Central image of Fig. 2
The figure was produced by assigning red to the visible channel (630 to 690nm), green to the near-infrared channel (760 to 860nm), and blue to the visible channel (520 to 600nm). As a result, the figure has the same coloring as the above MOS-1 image.
Lower image of Fig. 2
AVNIR-2 has four observation bands. The lower image of Fig. 2 was composed by assigning red to visible Band 3 (610 to 690nm), green to near-infrared Band 4 (760 to 890nm), and blue to visible Band 2 (520 to 600nm). As a result, the figure has the same coloring as the above MOS-1 and JERS-1 images.
Fig. 3
PRISM is an optical sensor for observing ground surfaces with visible and near-infrared signals in the 520 to 770 nanometer (one-billionth of a meter) band. The acquired image is monochrome. PRISM has three independent optical systems (telescopes) to acquire images for nadir, forward, and backward views at the same time so that terrain data including altitude data can be obtained. Figure 3 was composed using the backward-looking image (red) and the nadir image (green and blue). In Fig. 3, the satellite is traveling to the left so the backward view from the satellite is seen with the left eye and the nadir with the right eye. Note that the right side is north in Fig. 3, even though the upper side is north in Fig. 2.
|
|