Seen from Space 2004
Gulf Stream as Seen from Global Imager
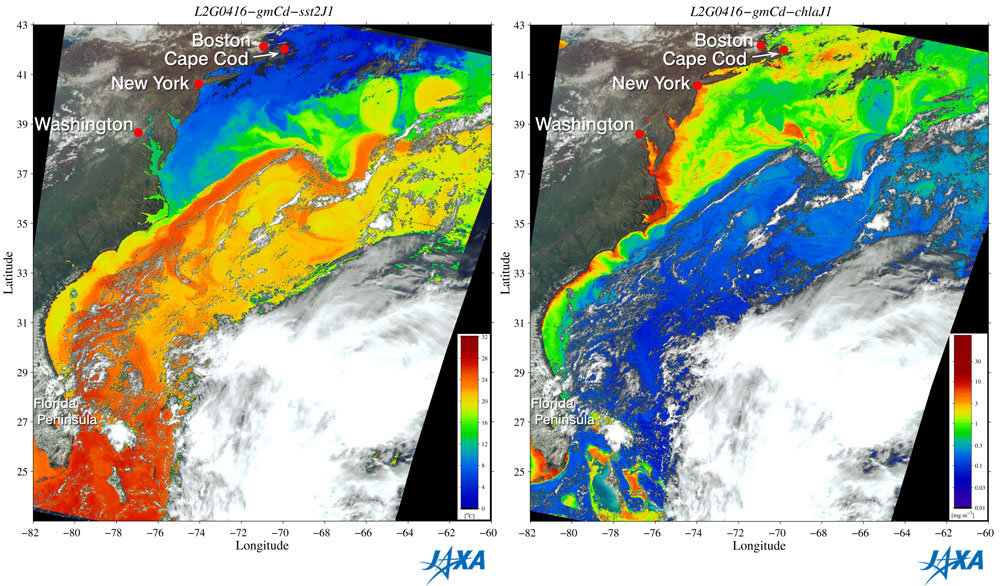
High sea-surface temperature (SST) regions exceeding 20oC, represented by the orange color in the figure on the left, flow northward along the east coast of North America. This is the Gulf Stream, which flows northward along the continental shelf around the 200 m isobath, and has a meandering path similar to the Kuroshio Current. In this image, you can clearly see the Gulf Stream and its U-shaped path off the coast of Cape Cod. From the Gulf of Mexico, the Gulf Stream passes counterclockwise around the Florida peninsula, and flows northeast along the eastern coast of North America. Like the Kuroshio Current in the Pacific Ocean, it is one of the world's largest warm currents. It passes through the coastal regions of the USA and Canada from the Gulf of Mexico, and flows to the coastal regions of the Scandinavian Peninsula in northern Europe, where it is called the North Atlantic Current. The Gulf Stream plays a very important role in transferring the solar heat from the low-latitude Gulf of Mexico to Europe, producing relatively warm climate conditions in England and Ireland in spite of their high latitude. The Chlorophyll-a (*1) (Chl-a) image on the right captures the phenomenon of phytoplankton bloom, clearly showing the active ocean phytoplankton photosynthesis increasing explosively due to the increased solar radiation in the spring. The high-SST regions around the Gulf Stream have low chl-a concentrations, represented by the blue color. The low SST (*2) in the coastal regions and the northern part of the Gulf of Mexico (north of 35oN) have high chl-a concentrations, represented by the green to orange colors. Particularly high chl-a concentrations occur in the coastal regions north of 35oN, around the frontal regions (*3) of the Gulf Stream, and inside the meandering zone. Many shiome (rip currents) and eddies begin in this frontal region, which abounds with phytoplankton. Because of this, the Gulf Stream region, especially off the shore of Cape Cod, is one of the world's leading cod fishing grounds and is often compared with the offshore Sanriku around Japan, which combines the Kuroshio and Oyashio currents. Ocean currents greatly influence climate change as well as phytoplankton distribution and variability to form one of the most important physical environments in the ocean. The Global Imager (GLI) helps us understand the relationships between the phytoplankton distribution and sea-surface temperature because it can simultaneously observe SST and chl-a concentration using one sensor. (*1) Chlorophyll-a exists in plants and plays an important role in photosynthesis. Chlorophyll includes types a, b, c, d, and e. Of these, chlorophyll-a is a good indicator of the distribution of ocean phytoplankton because it exists in all varieties of phytoplankton, as well as in all algae and land plants. (*2) Low sea-surface temperature in these regions is due to the influence of the Labrador Current, which flows southward along the coast of the Labrador Peninsula in Canada. The Labrador Current is a cold current that flows southward along the Labrador Peninsula coast in the northwestern Atlantic Ocean, and is known for its low temperature and extremely low salinity. (*3) An ocean frontal region is where two different kinds of seawater combine. In the SST image, this frontal region indicates a boundary layer, with the Gulf Stream (high temperature and high salinity) shown in orange and the coastal water (low temperature and low salinity) shown in blue to green, influenced by the Labrador Current.
Related sites: |
|||||||||||||