0. Introduction
SGLI Near-realtime monitor is a web page that displays a list of GCOM-C/SGLI Near-realtime observation data for the area around Japan, projected on a map.
In addition to display the images on the web, you can download the data shown in "2. About Data".
1. Web page
The following are instructions for operating SGLI Near-realtime monitor.
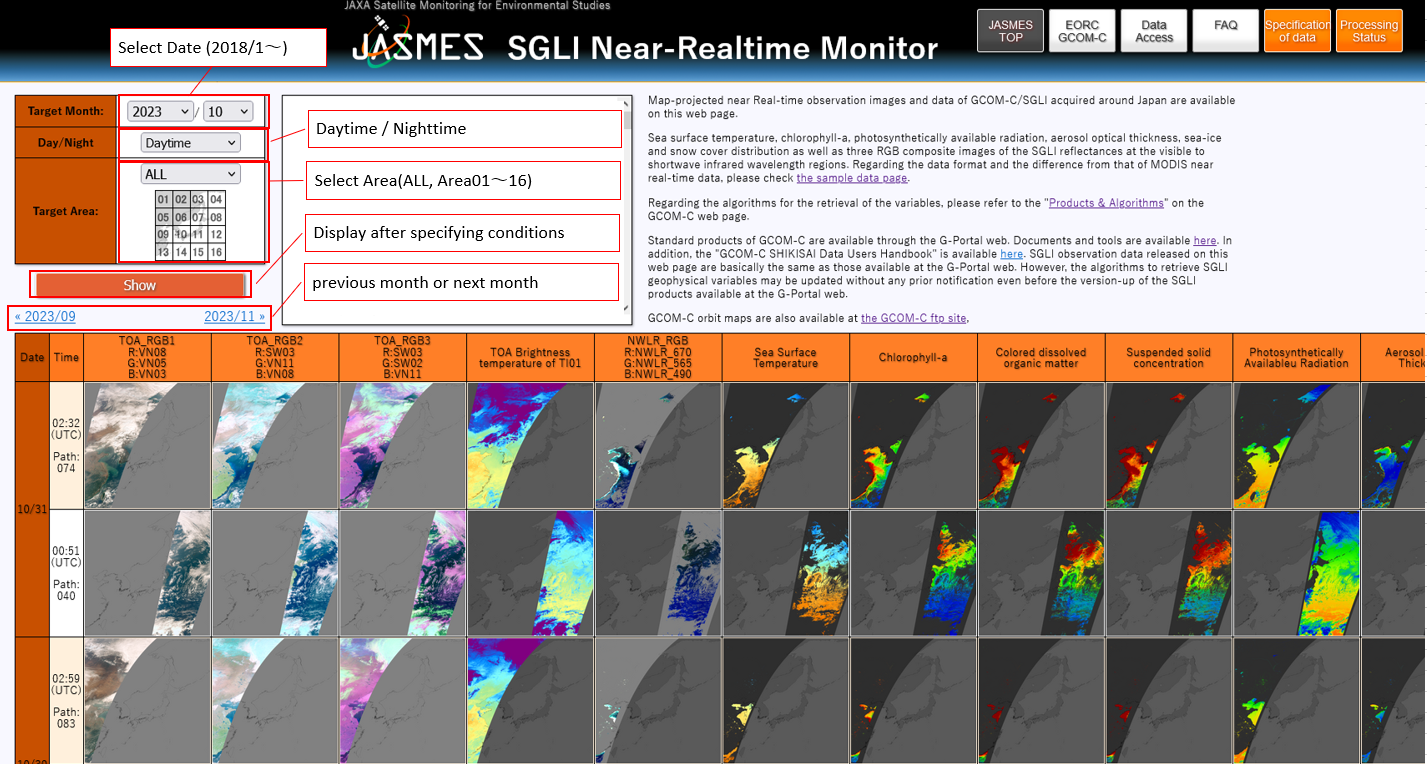
If necessary, specify the date, Daytime/Nighttime, and area on the menu at the upper left of web page to display.
2. About Data
GCOM-C/SGLI Near-realtime data (JASMES format) is netCDF4 format data, which is resampled GCOM-C/SGLI product (HDF5 format) on the JASMES grid.
For details, please refer to the following.
Specification of SGLI NRT data
2-1. Data updates
| 2026/08/13 |
We have updated ocean color algorithm as follows: (1) Bias in aerosol reflectance LUT is adjusted by vicarious calibration with MOBY+BOUSSOLE observations. (2) Scan angle dependent calibration bias is corrected by vicarious calibration with NOAA20/VIIRS ocean color data statistically. (3) Residual error of the lunar calibration is corrected in addition to the static vicarious calibration. (4) Additional tests were applied for the near cloud flag in QA_flag by using Quadratic Discriminant Analysis (QDA). |
| 2023/03/03 |
Updated CDOM, TSM and CHLA algorithms vresion from 2000 to 3005. NWLR, PAR, TAUA, FAI, CDOM, TSM and CHLA products has been reprocessed. |
| 2022/09/07 |
Updated NWLR, PAR, TAUA and FAI algorithms vresion from 2006 to 2007. Correction of abnormal values aroud cloud. We plan to reprocess the past data after revision of CDOM. |
| 2021/12/24 |
Updated NWLR, PAR, TAUA and FAI algorithms vresion from 2002 to 2006. Updated alternative calibration factor (change in output is slight) The land and sea masks from Hokkaido to Tohoku have been tentatively modified. (Sea of Okhotsk is a water area) |
2-2. Area and resolution
The target area is divided into 16 sections:the Japan area and the area surrounding Japan. Each area and its resolution are as follows.
Surrounding Japan(24N-50N, 123E-150E)・16sections(20N-60N, 115E-155E)
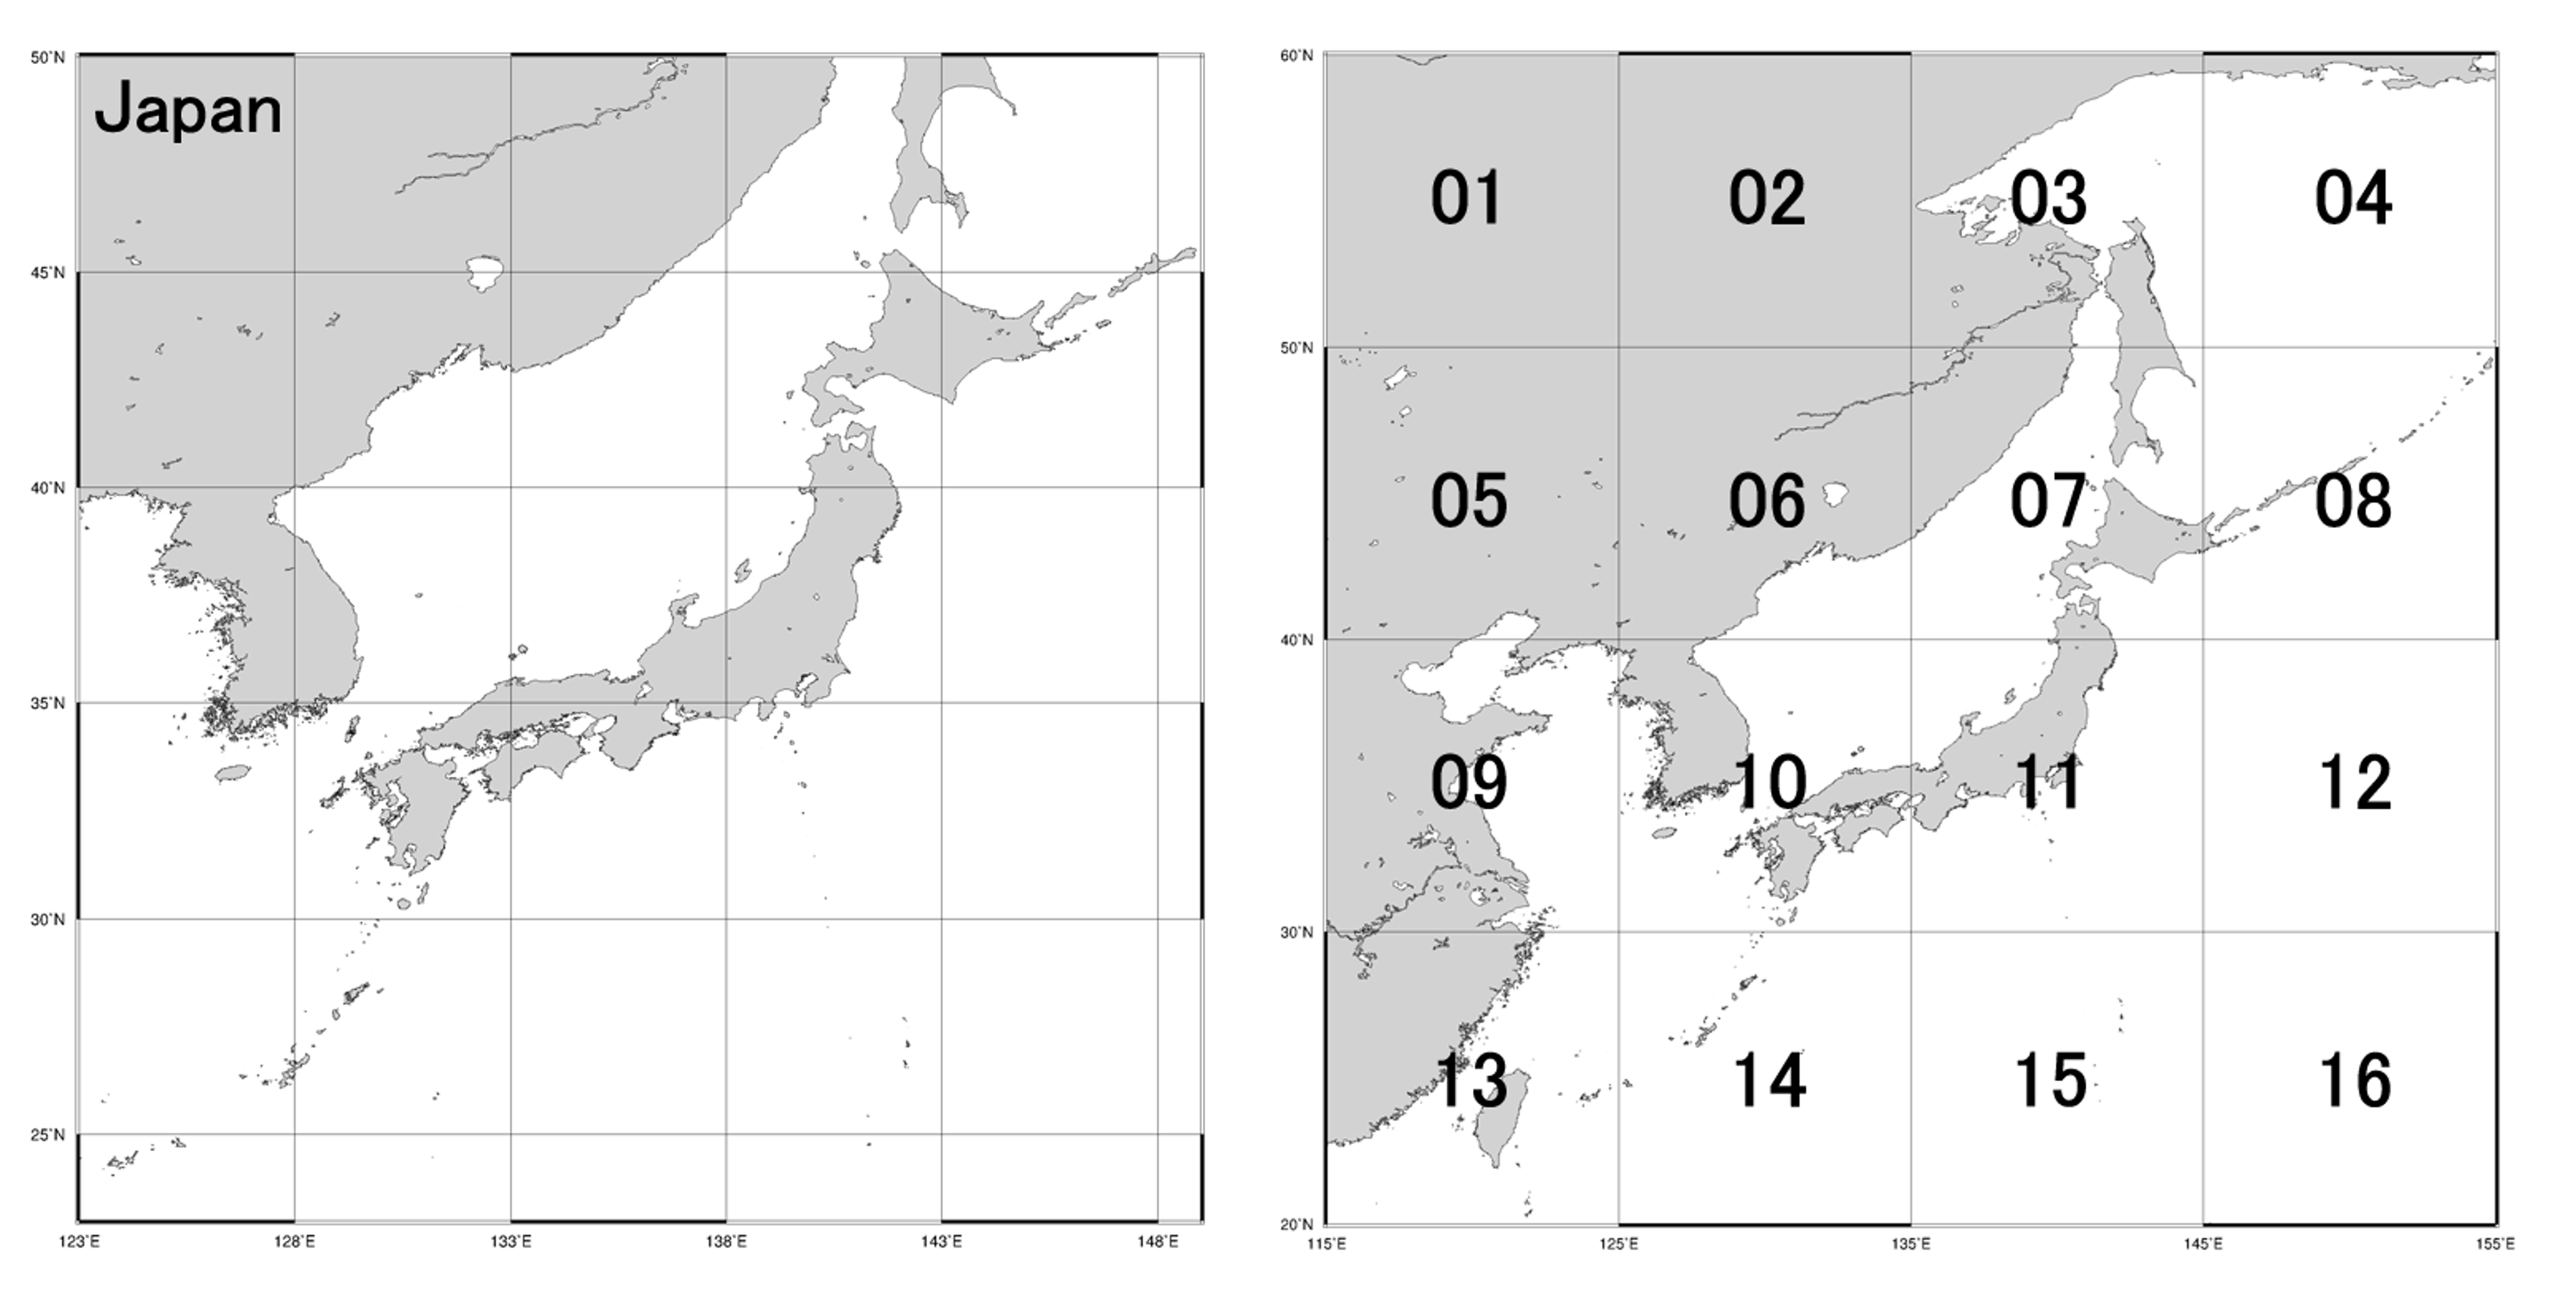
| Area | Pixel size | Latitude | Longitude |
|---|---|---|---|
| Japan(ALL) | 0.0025deg | 24-50deg.N | 123-150deg.E |
| Area 01 | 0.0025deg | 50-60deg.N | 115-125deg.E |
| Area 02 | 0.0025deg | 50-60deg.N | 125-135deg.E |
| Area 03 | 0.0025deg | 50-60deg.N | 135-145deg.E |
| Area 04 | 0.0025deg | 50-60deg.N | 145-155deg.E |
| Area 05 | 0.0025deg | 40-50deg.N | 115-125deg.E |
| Area 06 | 0.0025deg | 40-50deg.N | 125-135deg.E |
| Area 07 | 0.0025deg | 40-50deg.N | 135-145deg.E |
| Area 08 | 0.0025deg | 40-50deg.N | 145-155deg.E |
| Area 09 | 0.0025deg | 30-40deg.N | 115-125deg.E |
| Area 10 | 0.0025deg | 30-40deg.N | 125-135deg.E |
| Area 11 | 0.0025deg | 30-40deg.N | 135-145deg.E |
| Area 12 | 0.0025deg | 30-40deg.N | 145-155deg.E |
| Area 13 | 0.0025deg | 20-30deg.N | 115-125deg.E |
| Area 14 | 0.0025deg | 20-30deg.N | 125-135deg.E |
| Area 15 | 0.0025deg | 20-30deg.N | 135-145deg.E |
| Area 16 | 0.0025deg | 20-30deg.N | 145-155deg.E |
2-3. Product
Please see below for details.
Specification of SGLI NRT data
2-4. Use of Data
JASMES User Registration is required to use observation data.
Please also refer to "Terms of Use of Research Data (JAXA)".
JASMES User Registration
Terms of Use of Research Data (JAXA)
For the status of data preparation and publication of JASMES SGLI Near-realtime monitor, please refer to the following. JASMES SGLI Near-realtime Data Processing Status
3. FAQ
Regarding the use of JASMES-related Web pages/data, including SGLI Near-realtime monitor, the following is list of frequently asked questions and answers. Please check the following FAQ before asking questions.
if your question is not resolved, please contact the listed in the "Contact" section.
JASMES FAQ
4. How to use data
4-1. View Data
・View JASMES SGLI Near-realtime data in SeaDAS
See below for instructions on how to use SeaDAS to read and display netCDF data.
View JASMES SGLI Near-realtime data in SeaDAS
4-2. Sample script
・Sample script for SGLI Near-realtime data
Please refer to the following FAQ on how to read and process netCDF data using the sample scripts.
About Sample Script (JASMES FAQ)
4-3. Convert to GeoTiFF
・How to convert JASMES GCOM-C/SGLI data to GeoTiFF
This is tutoial for converting GCOM-C/SGLI data in netCDF format to GeoTiFF.
The script in the tutorial will use Python3(netCDF4, NumPy, GDAL library).
In addition, software (SeaDAS、ncdump, etc.) to check the contents of netCDF is required.
4-4. Operational information
For satellite operation information such as Onboard calibration, pleae see here.
4-5. Satellite event information
For satellite missing event information, pleae see here.
4-6. TIR event list
Stripes may apper in the SGLI products shown below due to temporary performance changes of the TIR sensor.
- Land Surface Temperature
- Sea Surface Temperature
- Sea and Ice Physical Properties
Please see here for the period when the stripes are most visible.
5. Contact
If you have any comment or questions about JASMES services, please contact us at the address below.
<Contact>
Earth Observation Research Center / JAXA
GCOM Secretariat(formerly ADEOS/OCEAN Secretariat)
2-1-1 Sengen, Tsukuba, Ibaraki 305-8505 Japan
FAX: +81-29-868-2961
E-mail: 