
Overview
This website provides images and videos of three-dimensional rainfall observed by the Dual-frequency Precipitation Radar (DPR), which measures rainfall in three dimensions from space. The DPR was developed by the Japan Aerospace Exploration Agency (JAXA) in cooperation with the National Institute of Information and Communications Technology (NICT) and is installed on the core observatory of the Global Precipitation Measurement (GPM) mission, a joint mission of JAXA and the National Aeronautics and Space Administration (NASA).
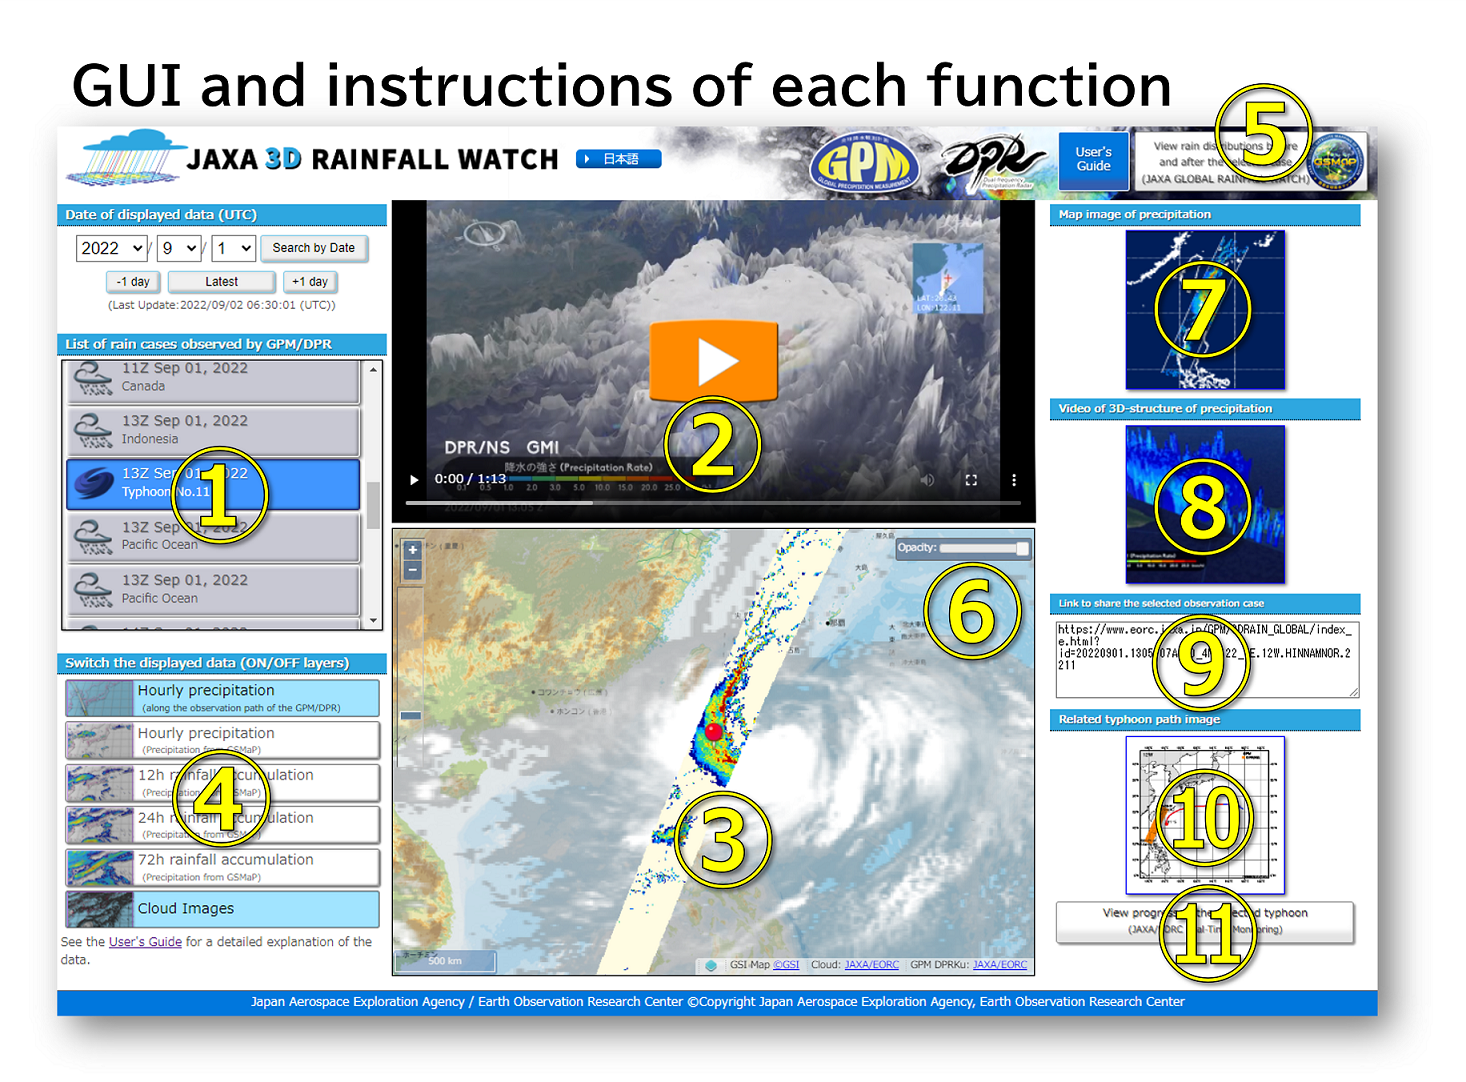
- (1) Date of displayed data (UTC)
Select a date and click "Search by Date" to show the list of observations by GPM/DPR. The list includes the date, time, and approximate center location of rainfall cases observed by the GPM/DPR on the specified date. When you click on one of the cases, the observation image and video of the case will be displayed in the right window. -
(2) Video in the upper center of the screen
After selecting the date and case, a video of 3D-structure of precipitation by the GPM/DPR will be displayed. -
(3) Map at the bottom center of the screen
After selecting the date and case, the map showing the observed rain and clouds will be displayed. You can zoom in and out the map, also switch the displayed data using panel (4). -
(4) Switch the displayed data (ON/OFF layers)
You can choose the layers to display or hide the data on the map in window (3). For details on the displayed data, please refer to "About Displayed Data" below. -
(5) View the rain distribution before and after the currently selected case (JAXA GLOBAL RAINFALL WATCH)
Click here to check the variations in rain clouds before and after the selected case and its change over time. A separate window will open with a link to the "JAXA GLOBAL RAINFALL WATCH" for the relevant time, allowing you to see the hourly movement of rain clouds. -
(6) Opacity
You can control the opacity of the data displayed on the map in window (3). -
(7) Map image of precipitation
Click to enlarge and download the distribution map with hourly precipitation along the observation path of the GPM/DPR. -
(8) Video of 3D-structure of precipitation
Click to enlarge the video shown in window (2). You can download the video from here. -
(9) Link to share the case
Copy this URL when you share the selected observation case with others. -
(10) Related typhoon path image
If the selected case is a typhoon, a map of the typhoon track will be displayed. Click to enlarge the image. -
(11) View the progress of the selected typhoon (JAXA/EORC Tropical Cyclone Database)
If the selected case is a typhoon, click here. You can find a site that compiles observation information on the corresponding typhoon in a separate window.
Displayed data
The following is an explanation of each displayed data.
Hourly precipitation (Observation path of the GPM/DPR)
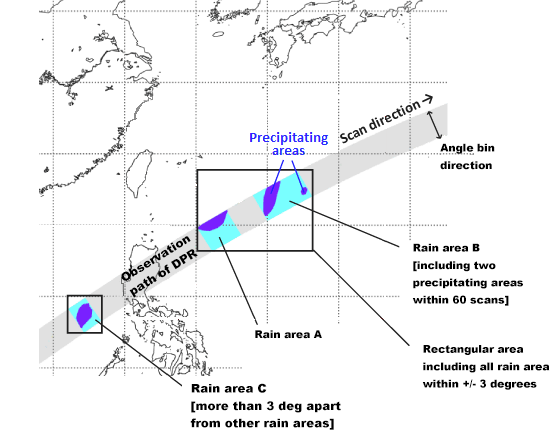
Precipitation data observed by Dual-frequency Precipitation Radar (DPR), which measures rainfall in three dimensions from space. Although its observation swath is not as wide as that of other satellite sensors, it has the great advantage of being able to capture three-dimensional precipitation. For a detailed explanation of DPR, please click here.
Precipitating areas are defined by using DPR dataset. Total values of averaged rainfall intensity of total range bins are calculated for each scan, and precipitating areas are extracted when the 5-scan running mean of the total values gets more than 2.7 mm/h (rain areas in the figure). If there are any other precipitating areas within 60 scans, they are treated as the same rain area (rain area B including two precipitating areas).
Hourly/12h/24h/72h precipitation (Precipitation from GSMaP)
Precipitation data from the Global Satellite Mapping of Precipitation (GSMaP), which is available on "JAXA GLOBAL RAINFALL WATCH". GSMaP can provide hourly global rainfall map by using multiple satellite sensors that observe precipitation events. For a detailed explanation of GSMaP, please click here. Click "View rainfall distribution before and after the selected case" in the upper right corner of the screen to link to "JAXA GLOBAL RAINFALL WATCH" website for the relevant time period.
Cloud Images
Globally-merged, full-resolution (~4km) IR Data produced by the National Oceanic and Atmospheric Administration (NOAA) Climate Prediction Center is used. IR (infrared) information from JMA's geostationary meteorological satellite Himawari, NOAA's geostationary meteorological satellite GOES, and EUMETSAT's geostationary meteorological satellite Meteosat is used, and is provided via the NASA/GSFC Precipitation Processing System (PPS).
Terms of Use
- If you wish to use any of the images or videos on this website, please refer to the "Terms of Use of Research Data". Also, please clearly state that you have downloaded the data from this website, for example, "Cited from JAXA 3D RAINFALL WATCH".
- If you want to share a particular observation case, please copy the URL from "Link to share the selected observation case". You can share it by e-mail, etc.
Some caveats for data users
- Although JAXA/EORC has taken every care to manage the current site, JAXA assumes no responsibility regarding the safety of the contents of the Site or the reliability of information provided on the Site. JAXA is not responsible to you for any damage that may be caused by the use of the Site and/or the information on the Site.
- Please contact the GSMaP realtime office in advance if you want to distribute images or data from this site to the public, such as in a pamphlet or internet. Also, please check Terms of Use for details from here.
Links
-
JAXA/EORC GPM Website
http://www.eorc.jaxa.jp/GPM/index_e.htm -
JAXA GLOBAL RAINFALL WATCH
https://sharaku.eorc.jaxa.jp/GSMaP/index.htm -
JAXA/EORC TRMM Website
http://www.eorc.jaxa.jp/TRMM/index_e.htm