Dataset
High-Resolution Land-Use and Land-Cover Map of Japan [2018 ∼ 2020]
(Released in November 2021 / Version 21.11)
Download product
User registration is required to download the data. Please click here about download and user registration details.
"High-Resolution Land-Use and Land-Cover Map of Japan ver. 21.11" was updated on April 1, 2022 due to containing void pixels in the tiles of N20E136, N35E138, and N36E140. If you downloaded the file before this, please re-download it. We do not change the version number with this update (still ver.21.11).
1. Summary
The Japan Aerospace Exploration Agency (JAXA) Earth Observation Research Center (EORC) creates High-Resolution Land Cover classification Maps (HRLULC) at the regional and national levels by using Earth observation data by satellites. These are basic information for regional and national land conservation such as ecosystem evaluation (growth and habitat of animals and plants, various ecosystem services), resource management (agriculture, forestry and fisheries, landscapes, etc.), disaster countermeasures (floods, sediment disasters, etc.), and so on.
In March 2021, we released version 21.03 (hereinafter v21.03) of HRLULC of Japan, which reflects the latest situation in Japan (as of 2019 to 2020). In v21.03, we used data from the Sentinel-2 satellite in Europe, the Landsat-8 satellite in the United States (both are optical sensors), and the ALOS-2 satellite in Japan (synthetic aperture radar PALSAR-2). There are 12 new categories including solar panels and bamboo forests, which are expanding rapidly in recent years.
This time in November 2021, we release v21.11 as a minor version upgrade of this v21.03. The satellite data used were the same as v21.03, but the quality of the training data has been improved, the classification algorithm has also been improved. Almost the entire area except for some remote islands has been reprocessed. Specifically, the algorithm for v21.03 were combination of kernel density estimation and convolutional neural network (CNN) whereas v21.11 used only CNN. This is an algorithm specialized for pattern recognition in a multispectral / time-series feature space, unlike a normal image CNN, and is named SACLASS2 following the name of the pre-classifier.
In the future, it will be possible to utilize the Global Change Observation Mission (GCOM-C) currently in operation and the advanced radar satellite (ALOS-4) scheduled to be launched in 2023. With that in mind, we will work on further improvements.
Compared to the previous versions, v21.03 and v21.11 are mainly updated in the following points (the parentheses show the version of the first implementation of each update).
- Sentinel-2 data were added to input (v21.03)
- ALOS-2 / PALSAR-2 multipolar (6m; HH / HV / VH / VV) and high resolution (3m; HH) data were added to the input (v21.03)
- The Sentinel-2 data is divided into 4 periods and integrated as the median image of each period to express seasonality (v21.03).
- Various vegetation indicators (NDVI, GRVI, NDWI, GSI) were added to the feature space as well as the reflectance of each band of Sentinel-2 (v21.03)
- ALOS PRISM Digital Surface Model (AW3D) DSM elevation information and latitude / longitude information were added to the feature space (v21.03)
- All training data and validation data were visually inspected and sorted (v21.03)
- All training data and validation data were visually re-examined and re-sorted (v21.11)
- Update of classification algorithm (SACLASS2) (v21.11)
As a result, the overall accuracy increased to 88.85% for this version (v21.11), compared to 81.6% for v18.03 and 84.69% for v21.03. In particular, the noise was reduced overall compared to v21.03, and the detection of solar panels, bamboo grove, and coastline was improved. Therefore, JAXA / EORC recommends the users to use v21.11 instead of v21.03. However, since some people are already using v21.03, we will continue to provide v21.03 data also.
2. Data used for creating the map
- Data 1. Sentinel-2 Level-1C (L1C) obtained from Google Earth Engine API.
- Data 2. ALOS-2 / PALSAR-2 (HBQ, UBS)
- Data 3. Training data (from SACLAJ database. Ground survey and interpretation on the Internet) Approximately 25,000 points
- Data 4. ALOS PRISM Digital Surface Model (AW3D)
- Data 5. Raster map of slope obtained from the Data 4
- Data 6. Vegetation Survey Map (1/25,000) by Biodiversity Center of the Ministry of the Environment, (used for interpretation of the training data for bamboo forests)
- Data 7. Photovoltaic power plant information from Electrical Japan (used for interpretation of training data for solar cell panels)
- Data 8. Coastline on the basic maps of Geospatial Information Authority of Japan
- Data 9. Road network vector data from OpenStreetMap (used to create raster maps of distances from roads) © OpenStreetMap contributors
3. Classification algorithm
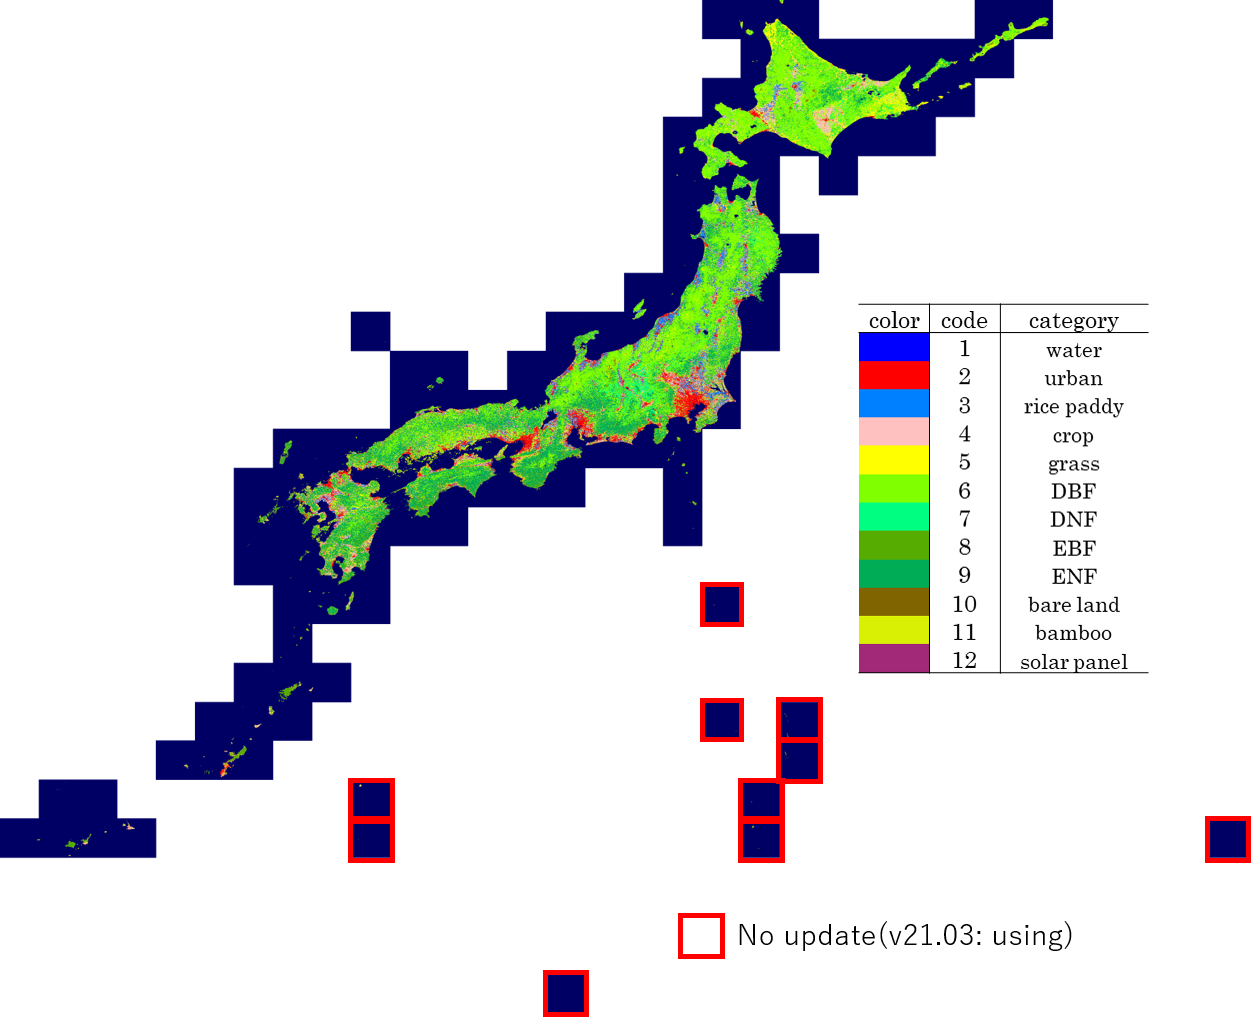
The processing flow of v21.11 has been greatly simplified compared to v21.03. In some remote island areas, there was no confirmation of improvement due to insufficient data, so we did not update it in v21.11, but instead used v21.03 as it is (the tiles of the no-change are described later in Fig. 1).
3.1 Preprocessing
- Cloud masking, three-month median composite, calculation of vegetation indices (Sentinel-2 L1C)
- Constructing the feature space: Time series of Sentinel-2 L1C band reflectance, NDVI, GRVI, NDWI, GSI; Time series of ALOS-2/PALSAR-2 HBQ, UBS; ancillary data: AW3D DSM, latitude & longitude)
3.2 Classification
SACLASS2 with the data listed above. A convolutional neural network (CNN) algorithm specializing in pattern recognition in multispectral and time series feature spaces.
3.3 Postprocessing
- Applying a filter based on altitude and slope.
- Applying Gaussian blur filter.
- Applying a filter based on a raster map of the distance from the road.
- For remote island areas that were not subject to reprocessing, v21.03 was diverted and combined.
- Correction of abnormal values by visual inspection.
4. Data format
| Period of coverage | From year 2018 to 2020. It represents the average situation, not the specific point in time. |
|---|---|
| Coordinate system | Geographic latitude and longitude coordinates (WGS84) |
| Tile unit | 1 degree x 1 degree, (12,000 pixels x 12,000 lines) |
| Mesh size | (1 / 12,000) degree × (1 / 12,000) degree (corresponding to approximate 10 m × 10 m) (Low-resolution data after resampling are also provided.) |
| File naming convention | For example, LC_N45E142.tif indicates 45 to 46 degrees north latitude and 142 to 143 degrees east longitude. |
| Format | GeoTIFF format |
| Period of coverage | From year 2018 to 2020. It represents the average situation, not the specific point in time. |
| Coordinate system | Geographic latitude and longitude coordinates (WGS84) |
| Tile unit | 1 degree x 1 degree, (12,000 pixels x 12,000 lines) |
| Mesh size | (1 / 12,000) degree × (1 / 12,000) degree (corresponding to approximate 10 m × 10 m) (Low-resolution data after resampling are also provided.) |
| File naming convention | For example, LC_N45E142.tif indicates 45 to 46 degrees north latitude and 142 to 143 degrees east longitude. |
| Format | GeoTIFF format |
The value of each pixel is the ID number of the category for classification as follows:
- #1: Water bodies
- #2: Built-up
- #3: Paddy field
- #4: Cropland
- #5: Grassland
- #6: DBF (deciduous broad-leaf forest)
- #7: DNF (deciduous needle-leaf forest)
- #8: EBF (evergreen broad-leaf forest)
- #9: ENF (evergreen needle-leaf forest)
- #10: Bare
- #11: Bamboo forest
- #12: Solar panel
5. Accuracy verification
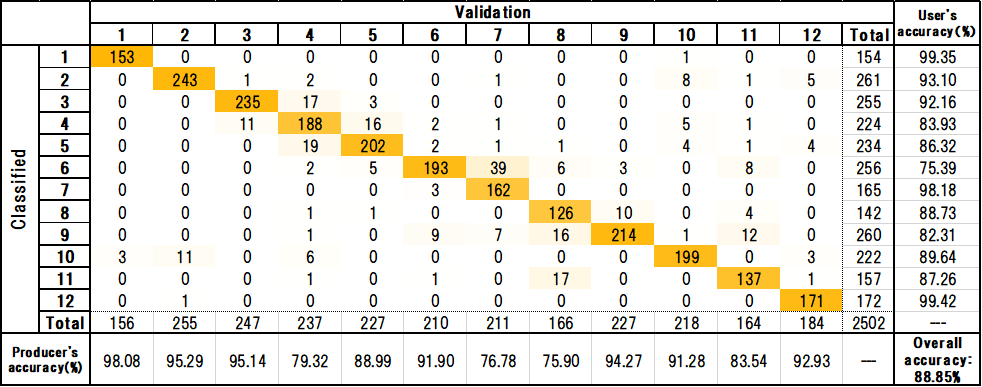
Note 1: This evaluation excludes some remote islands of Japan (The relevant parts are shown in Fig.1).
As reference information, the accuracy verification result of the previous version (v21.03 and v18.03) are shown in the confusion matrix below (see Table 2; Note 2 in v21.03, Table 3; Note 3 in v18.03).
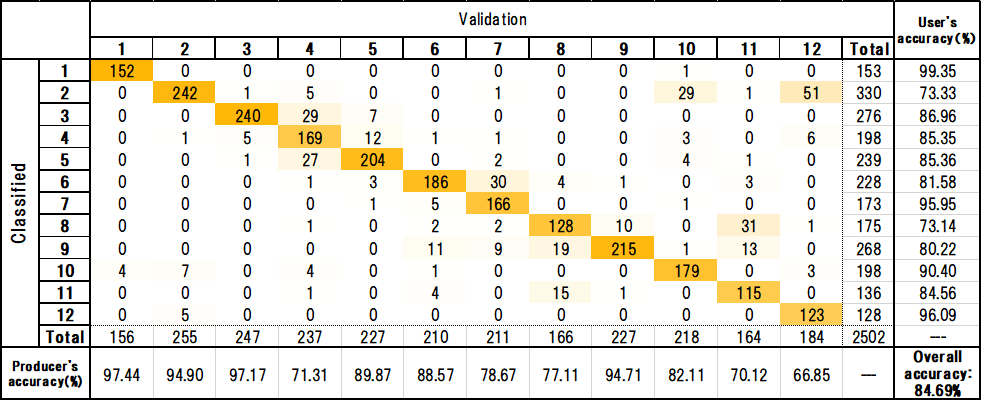
Note 2: This evaluation excludes some remote islands of Japan (The relevant parts are shown in Fig.1).
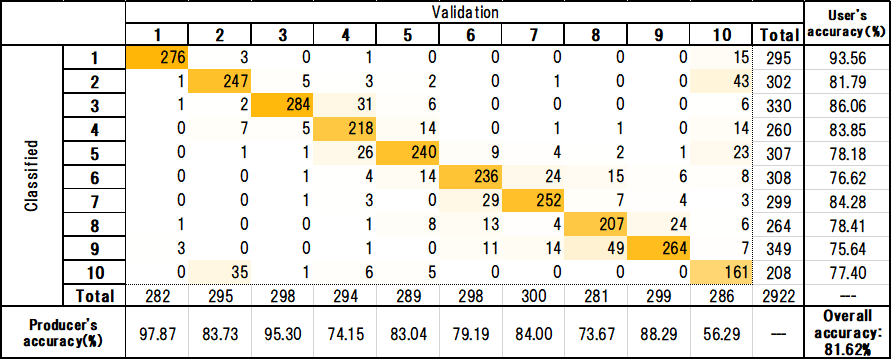
Note 3: Accuracy verification results as of the release of v18.03 are quoted.
The following figures are summary and examples of v21.11 in comparison to the previous versions.
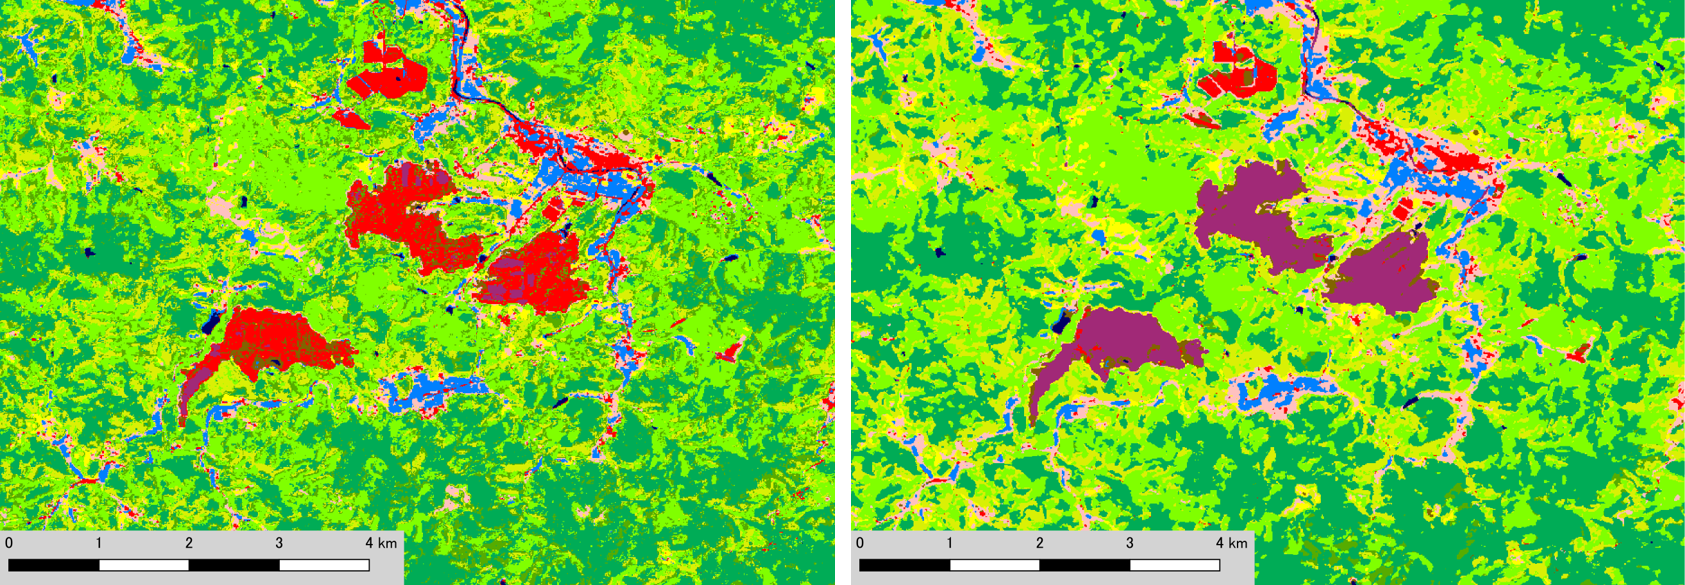
left: v21.03 (Sentinel-2/PALSAR-2/2018 - 2020 observed data)
Right: v21.11 (Sentinel-2/ PALSAR-2/2018 - 2020 observed data)
In the latest v21.11, the classification accuracy of the solar panel has been greatly improved.
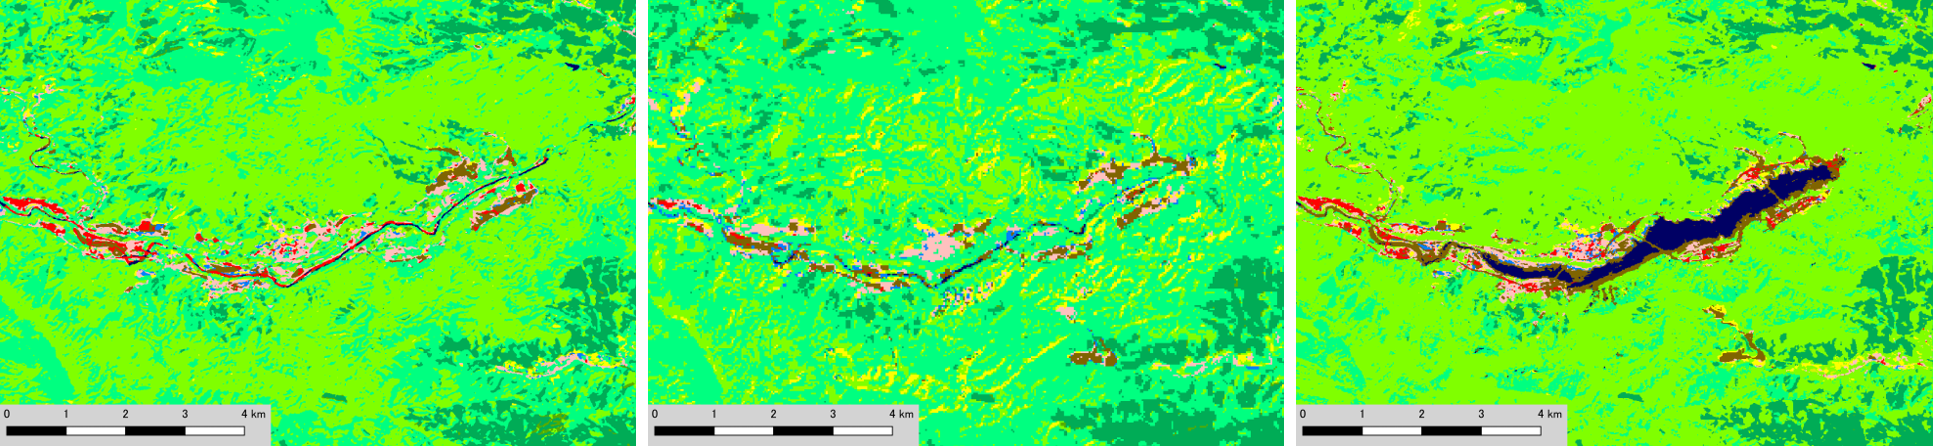
Left: v16.09 (AVNIR-2/2006 - 2011 observed data)
Center: v18.03 (Landsat-8/2014 - 2016 observed data)
Right: v21.11 (Sentinel-2/PALSAR-2/2018 - 2020 observed data)
It is able to interpret the water has filled in dam and started operation from v21.03 image.
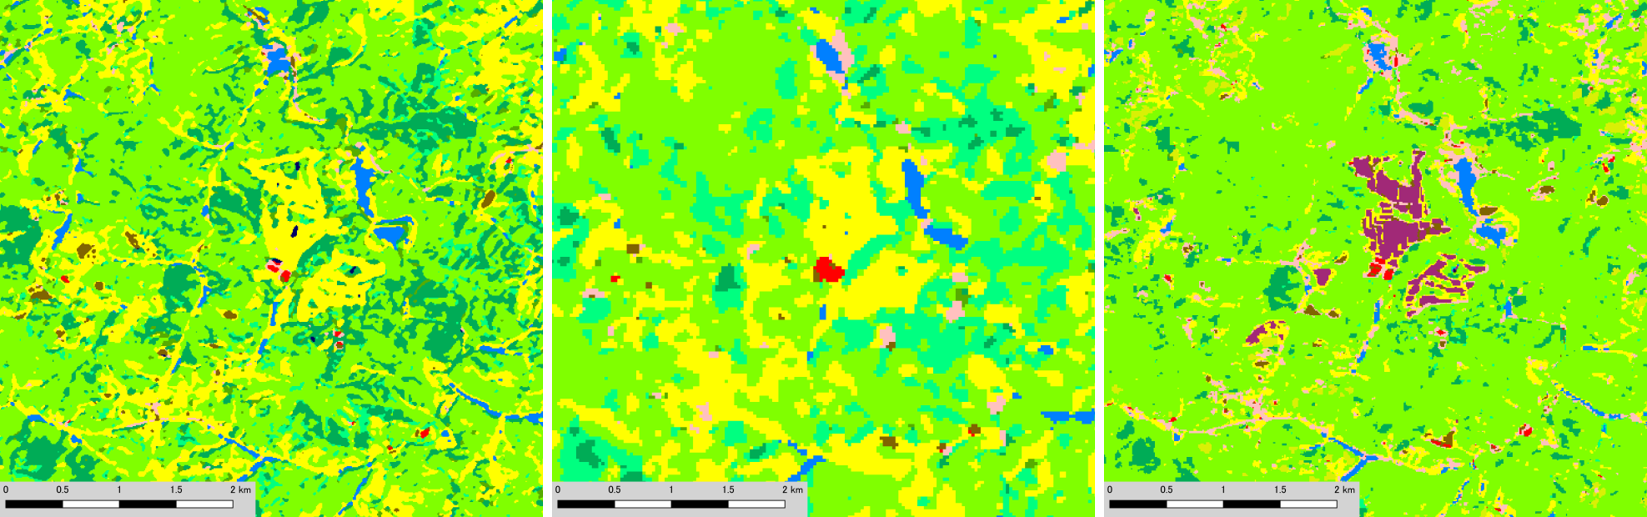
Left: v16.09 (AVNIR-2/2006 - 2011 observed data)
Center: v18.03 (Landsat-8/2014 - 2016 observed data)
Right: v21.11 (Sentinel-2/PALSAR-2/2018 - 2020 observed data)
It is able to interpret that grassland (Golf course) changed to mega solar power plant.
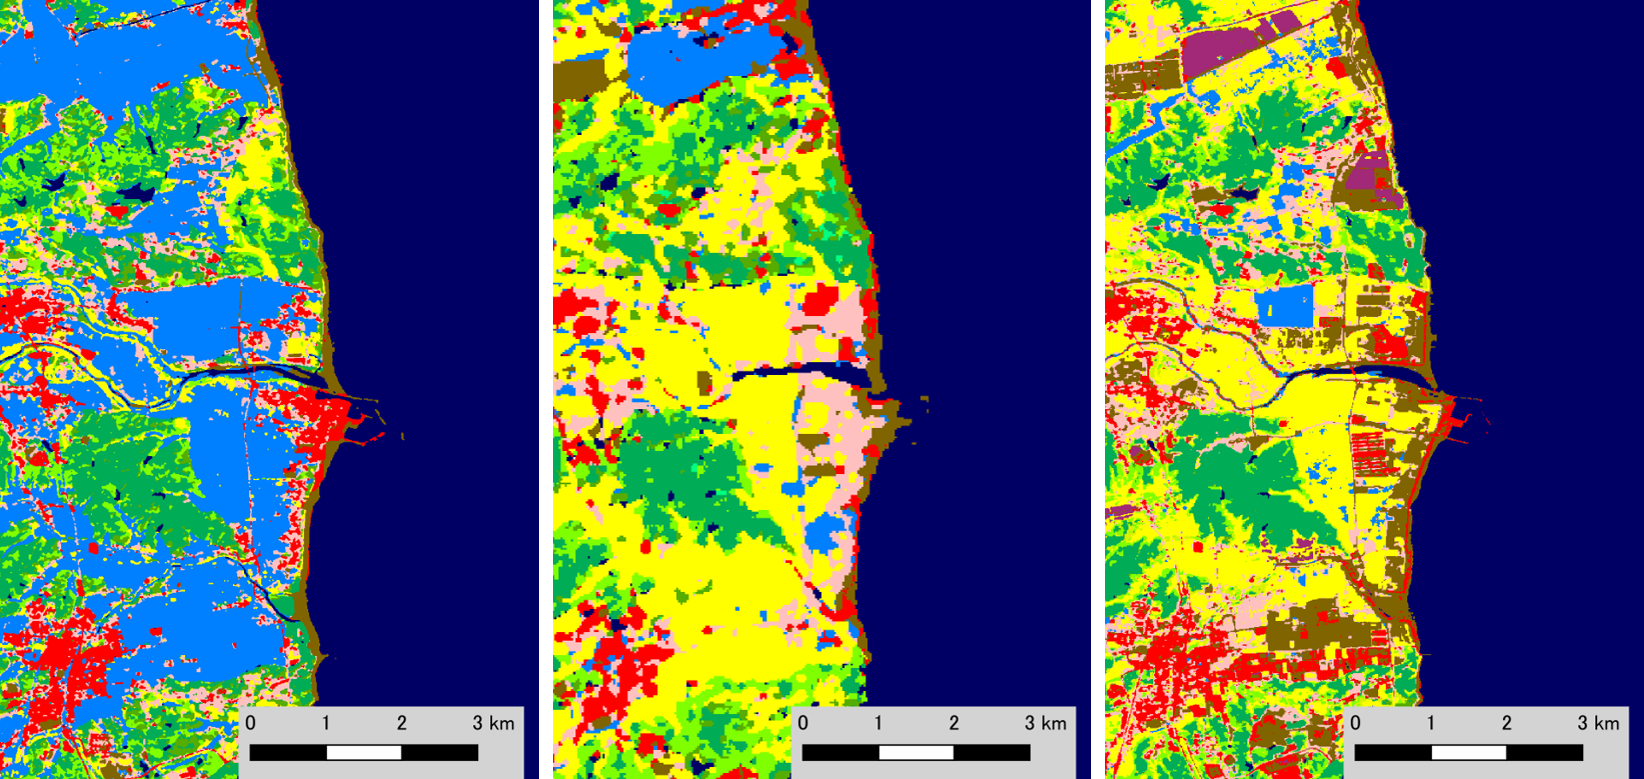
Left: v16.09 (AVNIR-2/2006 - 2011observed data)
Center: v18.03 (Landsat-8/2014 - 2016observed data)
Right: v21.11 (Sentinel-2/PALSAR-2/2018 - 2020 observed data)
It is able to interpret that the paddy fields before the earthquake became grasslands after the earthquake, and then changed solar panels and cities over time because of city planning was promoted.
Some remote island areas have not been updated since v21.03. See Figure 1 for the areas covered. For more information, please check about v21.03 page.
6. References
- "Development of "SACLAJ" a multi-temporal ground truth dataset of land cover", K. Kobayashi, K. Nasahara, T. Tadono, F. Ohgushi, M. Dotsu, R. Dan, proceedings of 61th autumn conference of the Japan Remote Sensing Society of Japan, pp.89-90. (Oral presentation).
- Teillet, P.M. et al. (1982), On the slope-aspect correction of multispectral scanner data, Can. J. Remote Sensing 8, 84-106.
- Sota HIRAYAMA, Takeo TADONO, Masato OHKI, Yousei MIZUKAMI, Kenlo NISHIDA NASAHARA, Koichi IMAMURA, Naoyoshi HIRADE, Fumi OHGUSHI, Masanori DOTSU and Tsutomu YAMANOKUCHI (2022): Generation of High-Resolution Land Use and Land Cover Maps in JAPAN Version 21.11. Journal of The Remote Sensing Society of Japan Vol. 42 No. 3 pp. 199-216