Dataset
We do not recommend the use of the following data (old version) to our users, as improved versions (the newest version) have been released separately. However, we will continue to provide these data on this page, as we believe that some users may need these data for retrospective or revalidation of researches that have already been conducted.The newest version is here.
High-Resolution Land-Use and Land-Cover Map of Japan [2018 ∼ 2020]
(Released in March 2021 / Version 21.03)
Download product
User registration is required to download the data. Please click here about download and user registration details.
1. Summary
Japan Aerospace Exploration Agency (JAXA) Earth Observation Research Center (EORC) has created the high resolution land cover classification maps for regional and national scale using Earth Observation Satellite data. These are intended to be used as basic information for various applications for the conservation of regions and lands such as ecosystem evaluation (distribution and habitat of animals and plants, various ecosystem services), resource management (agriculture, forestry and fisheries, landscape, etc.), and disaster countermeasures (flood, sediment disaster, etc.)
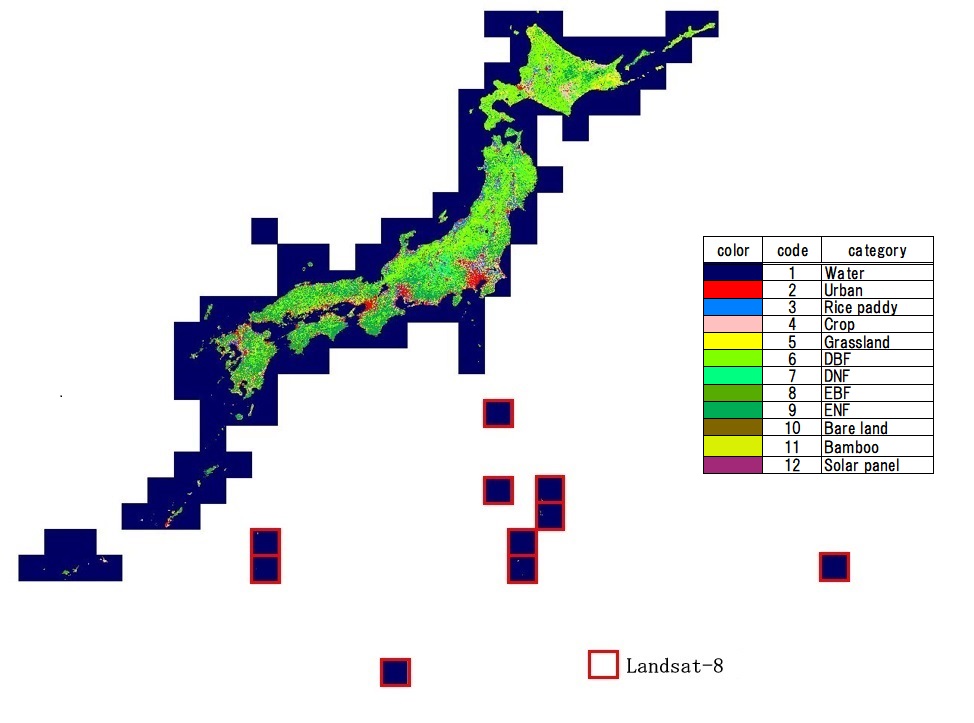
High resolution land cover map version 21.03 (v21.03) which reflects the latest situation (2018–2020) over entire Japan (excluding some remote islands) area has been released. It has been planned to improve classification accuracy by using optical sensor of Sentinel-2(EU) and Landsat-8(US) and SAR sensor of ALOS-2/PALSAR-2(Japan) in combination.
The classification category inherits the items of ALOS/AVNIR-2 high resolution land use land cover map (10 categories), and has added two new categories: solar panels and bamboo grove, which are expanding in recent years, resulting in 12 categories in total. Based on this product, it will be planned to utilize other satellites such as GCOM-C under operation and ALOS-4 which are scheduled to be launch on JFY2023, respectively.
In version 21.03 (v21.03) released this time, the following major changes and improvements have been implemented from the previous version 18.03 (v18.03).
- Add Sentinel-2 data as input
- Add PALSAR-2 stripmap high resolution and full-polarized data as input
- Prepare brightness median image of each four seasons of the year from Sentinel-2/LandSat-8 observation data
- Add various indices (NDVI/GRVI/NDWI/GSI) to the feature space
- Apply pansharpen to Landsat-8 image for improving spatial resolution
- Integration of CNN classified image using Sentine-2
- Perform visual re-filtering of training data and reference data
As a result, overall accuracy by confusion matrix is 84.8%.
2. Data used for creating the map
- Data 1: Sentinel-2 Level-1C (L1C) (*1)
- Data 2: ALOS-2 / PALSAR-2 (HBQ, UBS)
- Data 3: Landsat-8 OLI (Collection-1) (*1)
- Data 4: Information on training data from SACLAJ database (Ground survey and interpretation of satellite data on the Internet), 30,000 points.
- Data 5: ALOS PRISM Digital Surface Model (AW3D DSM)
- Data 6: Raster map of surface slope calculated by Data 5
- Data 7: Vegetation information of Bamboo (*2)
- Data 8: Information on solar power plant (*3)
- Data 9: Shoreline location from basemap information (*4)
- Data 10: Suomi NPP nightlight satellite image (500m pixel spacing) (*5)
- Data 11: The map of distances from roads (Roadmap © OpenStreetMap Contributors) (*6)
- Data 12: Information on the presence or absence of paddy rice cultivation for each municipality in Hokkaido (*7)
Acknowledgements
- *1 Google Earth Engine API
- *2 Biodiversity Center of Japan, Ministry of the Environment Japan (Vegetation Survey map(1/25,000), List by prefecture)
- *3 Electrical Japan (Database of solar power plant)
- *4 Geospatial Information Authority of Japan (Shoreline information, basemap)
- *5 Suomi NPP VIIRS Daily Mosaic Image and Data processing by NOAA's National Geophysical Data Center
- *6 OpenStreetMap © OpenStreetMap contributors
- *7 Hokkaido Government Opendata
3. Classification algorithm
3.1 Preprocessing
- Mask cloud
- Topographic correction of optical sensor data (C-Correction)
- Add Feature space image (NDVI/GRVI/NDWI/GSI)
- Pansharpening of Landsat-8 data
3.2 Classification
- Bayesian classifier with Kernel Density Estimation (SACLASS) using Data 1 (Hashimoto et al., 2014)
- SACLASS classification using Data 3 which applied on the area of lack of Data 1
- SACLASS classification using Data 2 (HBQ)
- SACLASS classification using Data 2 (UBS)
- CNN classification using Data 1
3.3 Integration
- Integration of classified results estimated section 3.2
3.4 Postprocessing
- Correction of topographic shadow at observation time using DSM
- Apply prior probability estimation map using Data 4 and 5,6,10,11,12
4. Data format
- Coordinate system: Latitude and longitude coordinate system with WGS84.
- Tile unit: 1 degree x 1 degree, (11,132 pixels x 11,132 lines)
- Mesh size: (1 / 11,132) degree × (1 / 11,132) degree (corresponding to approxi. 10 m × 10 m)
- File naming convention: For example, LC_N45E142.tif indicates 45 to 46 degrees north latitude and 142 to 143 degrees east longitude.
- Format: GeoTIFF format
- Period of coverage: From year 2018 to 2020. It represents the average situation, not the specific point in time.
The value of each pixel is the ID number of the category for classification as follows:
- #0: Unclassified
- #1: Water bodies
- #2: Built-up
- #3: Paddy field
- #4: Cropland
- #5: Grassland
- #6: DBF (deciduous broad-leaf forest)
- #7: DNF (deciduous needle-leaf forest)
- #8: EBF (evergreen broad-leaf forest)
- #9: ENF (evergreen needle-leaf forest)
- #10: Bare
- #11: Bamboo forest
- #12: Solar panel
- #255: No data
5. Accuracy verification
| Validation | User's accuracy (%) |
||||||||||||||
|---|---|---|---|---|---|---|---|---|---|---|---|---|---|---|---|
| 1 | 2 | 3 | 4 | 5 | 6 | 7 | 8 | 9 | 10 | 11 | 12 | TOTAL | |||
| Classified | 1 | 250 | 0 | 0 | 2 | 0 | 0 | 6 | 0 | 0 | 5 | 0 | 0 | 263 | 95.1 |
| 2 | 0 | 243 | 1 | 5 | 0 | 0 | 1 | 0 | 0 | 29 | 1 | 52 | 332 | 73.2 | |
| 3 | 0 | 0 | 240 | 29 | 7 | 0 | 0 | 0 | 0 | 0 | 0 | 0 | 276 | 87.0 | |
| 4 | 0 | 1 | 5 | 168 | 12 | 1 | 1 | 0 | 0 | 4 | 0 | 6 | 198 | 84.8 | |
| 5 | 0 | 0 | 1 | 28 | 218 | 0 | 2 | 2 | 0 | 6 | 1 | 0 | 258 | 84.5 | |
| 6 | 0 | 0 | 0 | 1 | 3 | 185 | 29 | 4 | 1 | 0 | 3 | 0 | 226 | 81.9 | |
| 7 | 0 | 0 | 0 | 0 | 1 | 6 | 162 | 0 | 0 | 1 | 0 | 0 | 170 | 95.3 | |
| 8 | 0 | 0 | 0 | 1 | 0 | 2 | 2 | 158 | 12 | 0 | 31 | 1 | 207 | 76.3 | |
| 9 | 0 | 0 | 0 | 0 | 0 | 11 | 8 | 22 | 216 | 0 | 13 | 0 | 270 | 80.0 | |
| 10 | 4 | 9 | 0 | 4 | 0 | 1 | 0 | 0 | 0 | 193 | 0 | 3 | 214 | 90.2 | |
| 11 | 0 | 0 | 0 | 1 | 0 | 4 | 0 | 15 | 1 | 0 | 115 | 0 | 136 | 84.6 | |
| 12 | 0 | 5 | 0 | 0 | 0 | 0 | 0 | 0 | 0 | 0 | 0 | 122 | 127 | 96.1 | |
| TOTAL | 254 | 258 | 247 | 239 | 241 | 210 | 211 | 201 | 230 | 238 | 164 | 184 | 2,677 | --- | |
| Producer's accuracy (%) |
98.4 | 94.2 | 97.2 | 70.3 | 90.5 | 88.1 | 76.8 | 78.6 | 93.9 | 81.1 | 70.1 | 66.3 | --- | Overall accuracy: 84.8% |
|
As reference information, the accuracy verification result of the previous version (v18.03) is shown in the confusion matrix below (see Table 2; Note 1).
| Validation | User's accuracy (%) |
||||||||||||
|---|---|---|---|---|---|---|---|---|---|---|---|---|---|
| 1 | 2 | 3 | 4 | 5 | 6 | 7 | 8 | 9 | 10 | TOTAL | |||
| Classified | 1 | 276 | 1 | 1 | 0 | 0 | 0 | 0 | 1 | 3 | 0 | 282 | 97.9 |
| 2 | 3 | 247 | 2 | 7 | 1 | 0 | 0 | 0 | 0 | 35 | 295 | 83.7 | |
| 3 | 0 | 5 | 284 | 5 | 1 | 1 | 1 | 0 | 0 | 1 | 298 | 95.3 | |
| 4 | 1 | 3 | 31 | 218 | 26 | 4 | 3 | 1 | 1 | 6 | 294 | 74.1 | |
| 5 | 0 | 2 | 6 | 14 | 240 | 14 | 0 | 8 | 0 | 5 | 289 | 83.0 | |
| 6 | 0 | 0 | 0 | 0 | 9 | 236 | 29 | 13 | 11 | 0 | 298 | 79.2 | |
| 7 | 0 | 0 | 0 | 1 | 4 | 24 | 252 | 4 | 14 | 0 | 299 | 78.6 | |
| 8 | 0 | 1 | 0 | 1 | 2 | 15 | 7 | 207 | 49 | 0 | 282 | 73.4 | |
| 9 | 0 | 0 | 0 | 0 | 1 | 6 | 4 | 24 | 264 | 0 | 299 | 88.3 | |
| 10 | 15 | 43 | 6 | 14 | 23 | 8 | 3 | 6 | 7 | 161 | 286 | 56.3 | |
| TOTAL | 295 | 302 | 330 | 260 | 307 | 308 | 299 | 264 | 349 | 208 | 2,922 | --- | |
| Producer's accuracy (%) |
93.6 | 81.8 | 86.1 | 83.8 | 78.2 | 76.6 | 84.3 | 78.4 | 75.6 | 77.4 | --- | Overall accuracy: 81.6% |
|
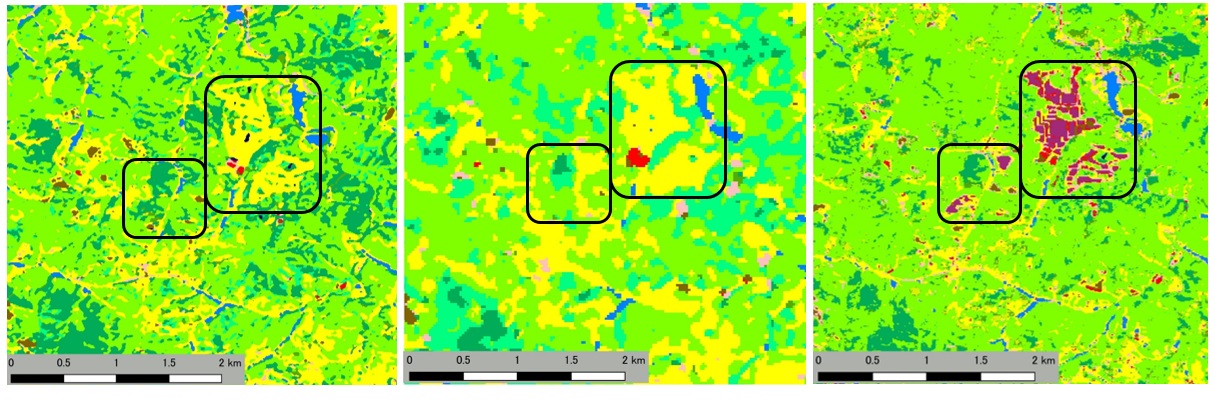
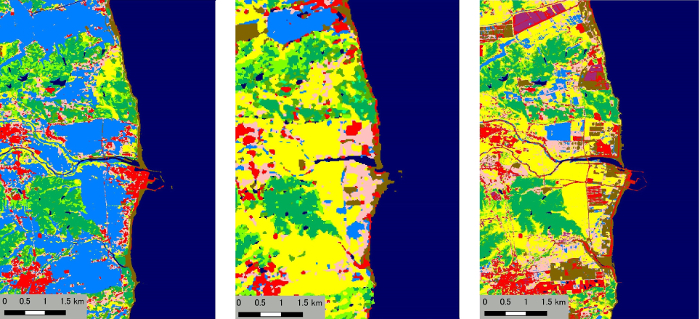
Figures 1 - 4 are shown examples of HRLULC map v21.03


It can interpret the water has filled in the dam and started operation from v21.03 image.

It can interpret that the grassland in the golf course changed to the mega solar powerplant.

It can interpret that the paddy fields before the earthquake in 2011 became grasslands after it, and then changed to solar panels and cities over time.
6. References
- "A New Method to Derive Precise Land-use and Land-cover Maps Using Multi-temporal Optical Data", S. Hashimoto, T. Tadono, M. Onosato, M. Hori and K. Shiomi (2014), Journal of The Remote Sensing Sociery of Japan, 34 (2), pp.102-112.
- "Development of "SACLAJ" a multi-temporal ground truth dataset of land cover", K. Kobayashi, K. Nasahara, T. Tadono, F. Ohgushi, M. Dotsu, R. Dan, (2016), Proceedings of 61th autumn conference of the Japan Remote Sensing Society of Japan, pp.89-90.
- "Reduction of Misclassification Caused by Mountain Shadow in a High Resolution Land use and Land Cover Map Using Multi-temporal Optical Images", J. Katagi, K. Nasahara, K. Kobayashi, M. Dotsu and T. Tadono (2018), Journal of the Remote Sensing Society of Japan, 38(1), pp.30-34.
- "On the slope-aspect correction of multispectral scanner data", P.M. Teillet et al. (1982), Can. J. Remote Sensing 8, pp.84-106.
- "Land-cover classification multi-temporal optical satellite images using deep learning toward the Advanced Land Observing Satellite-3 (ALOS-3) ", S. Hirayama, T. Tadono, Y. Mizukami(2020), proceedings of 69th autumn conference of the Japan Remote Sensing Society of Japan, pp.85-86.
Download product
Please read Top-page of High-Resolution Land-Use and Land-Cover Map Product section 3; Download and register your information from following URL to download the dataset.