Dataset
Generation of Global Forest / Non-forest map Using ALOS/PALSAR
The Japan Aerospace Exploration Agency (JAXA) has generated the world's first 10-meter resolution images and maps of the global forest and non-forest area distribution (in 2007 and 2009) using the Phased Array type L-band Synthetic Aperture Radar (PALSAR) aboard the Advanced Land Observing Satellite "DAICHI" (ALOS,) and will publish them on our website. We would also like to inform you that we will introduce the image maps at a side event for the 10th Conference of the Parties (COP 10) to the Convention on Biological Diversity and also at the Ministerial Summit for the Group on Earth Observation (GEO) to be held in Beijing in 2010. We will analyze and process past data to understand global-scale forest carbon volume change to compile useful data for control measures to tackle deforestation and forest deterioration. For data distribution, we will conclude an agreement with cooperative organizations.
The decrease and degradation of forestry, which occupies about one third of the global surface, gravely impacts the acceleration of global warming and the reduction of biological diversity; therefore understanding the current status of forests and its change over time on a global scale is an urgent challenge. In particular, the increase of carbon dioxide emissions due to deforestation and forest degradation accounts for over 20 percent of the total increase following that caused by fissile fuel (oil, natural gas, coal) combustion, thus forestry degradation and reduction are extremely serious for global environment conservation.
An earth observation satellite, which can observe the earth periodically in a short time span, is suitable for understanding environment changes. We have been performing observations since the American satellite Landsat series in 1970. However an optical sensor has some difficulty at image capturing under cloudy weather condition. On the other hand, observations by a radar are less affected by weather conditions. Figure 1 (image) is compiled by processing images acquired by the PALSAR during the dry season between June and September 2009 with 10-meter resolution (geometric correction*1 and radiometric correction*2)and also by processing almost 86,000 scenes all over the Earth through mosaic process (connection handling.) It is then made into a color image by putting red and green on two kinds of PALSAR data (horizontal polarization and vertical polarization) and blue on their ratios. Greenish colors show forestry, and dark green to yellow are non-forest areas.
Figure 2 is the Global Forest/Non-forest Map (2009,) using two colors to indicate forests in green and non-forest areas in yellow, where forest is defined as the biomass higher than 100 ton/hectar. The accuracy of the forest/non-forest demarcation by this image is confirmed to be 84% compared to the ground base data set*3.
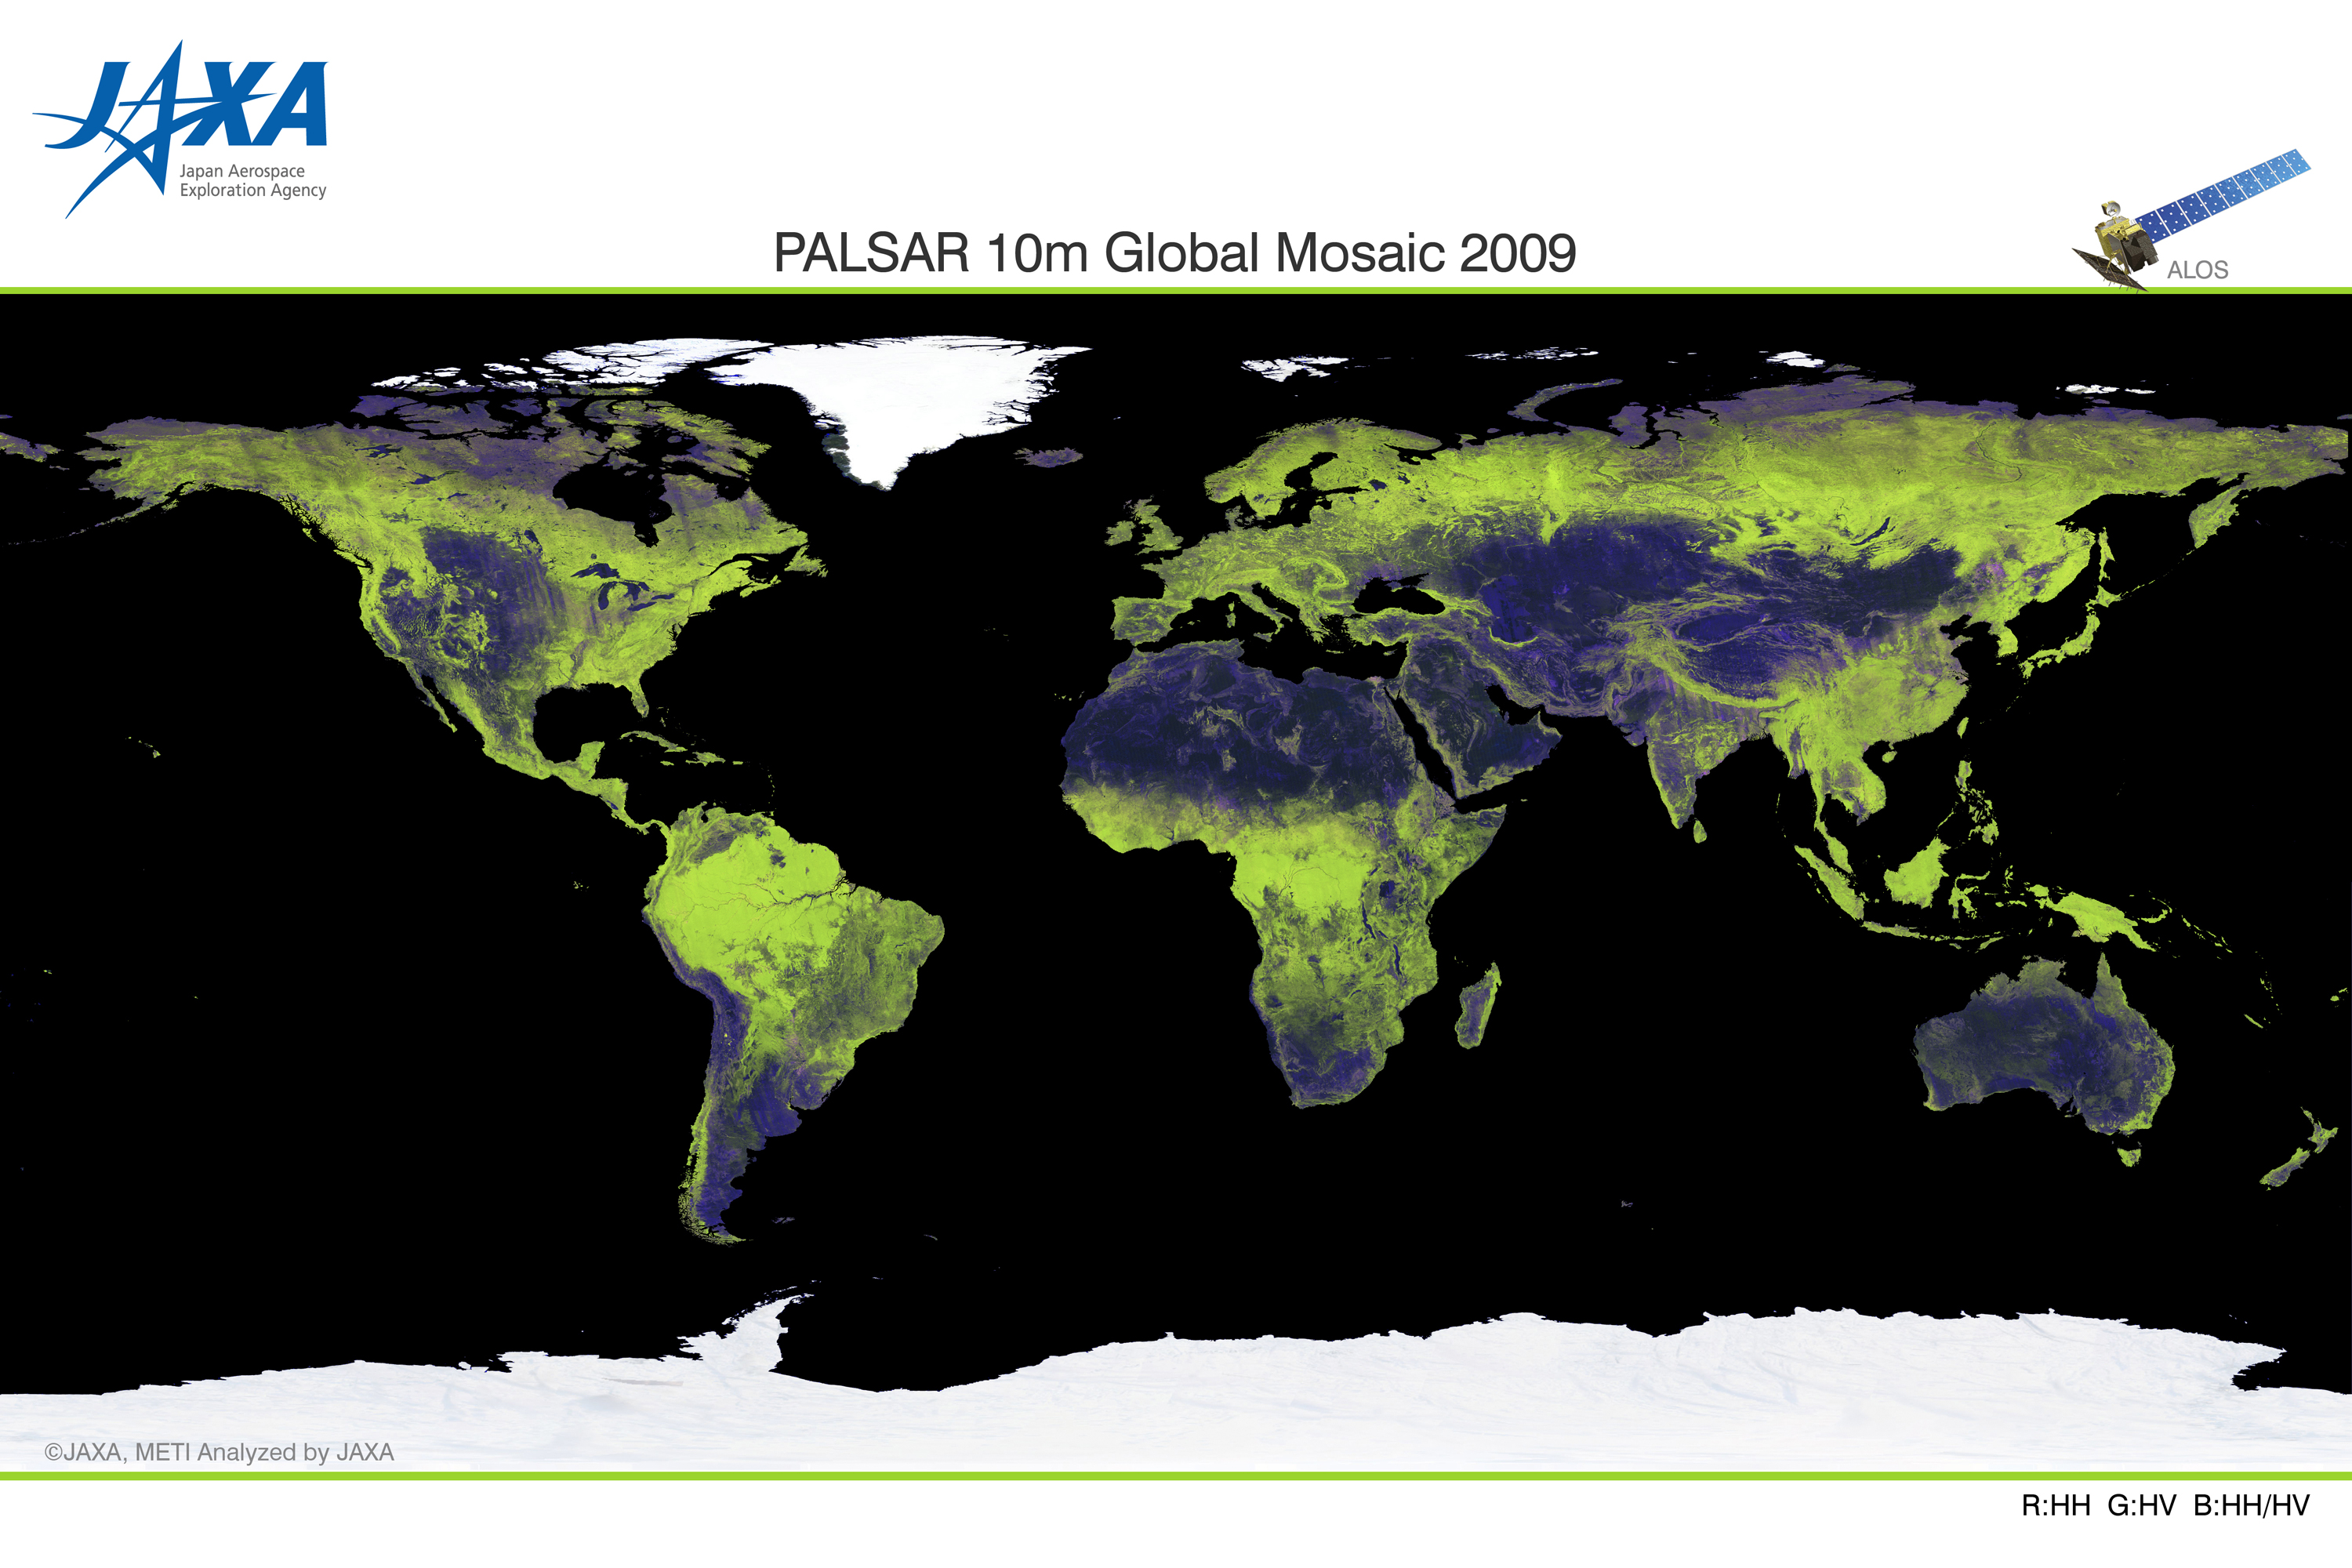
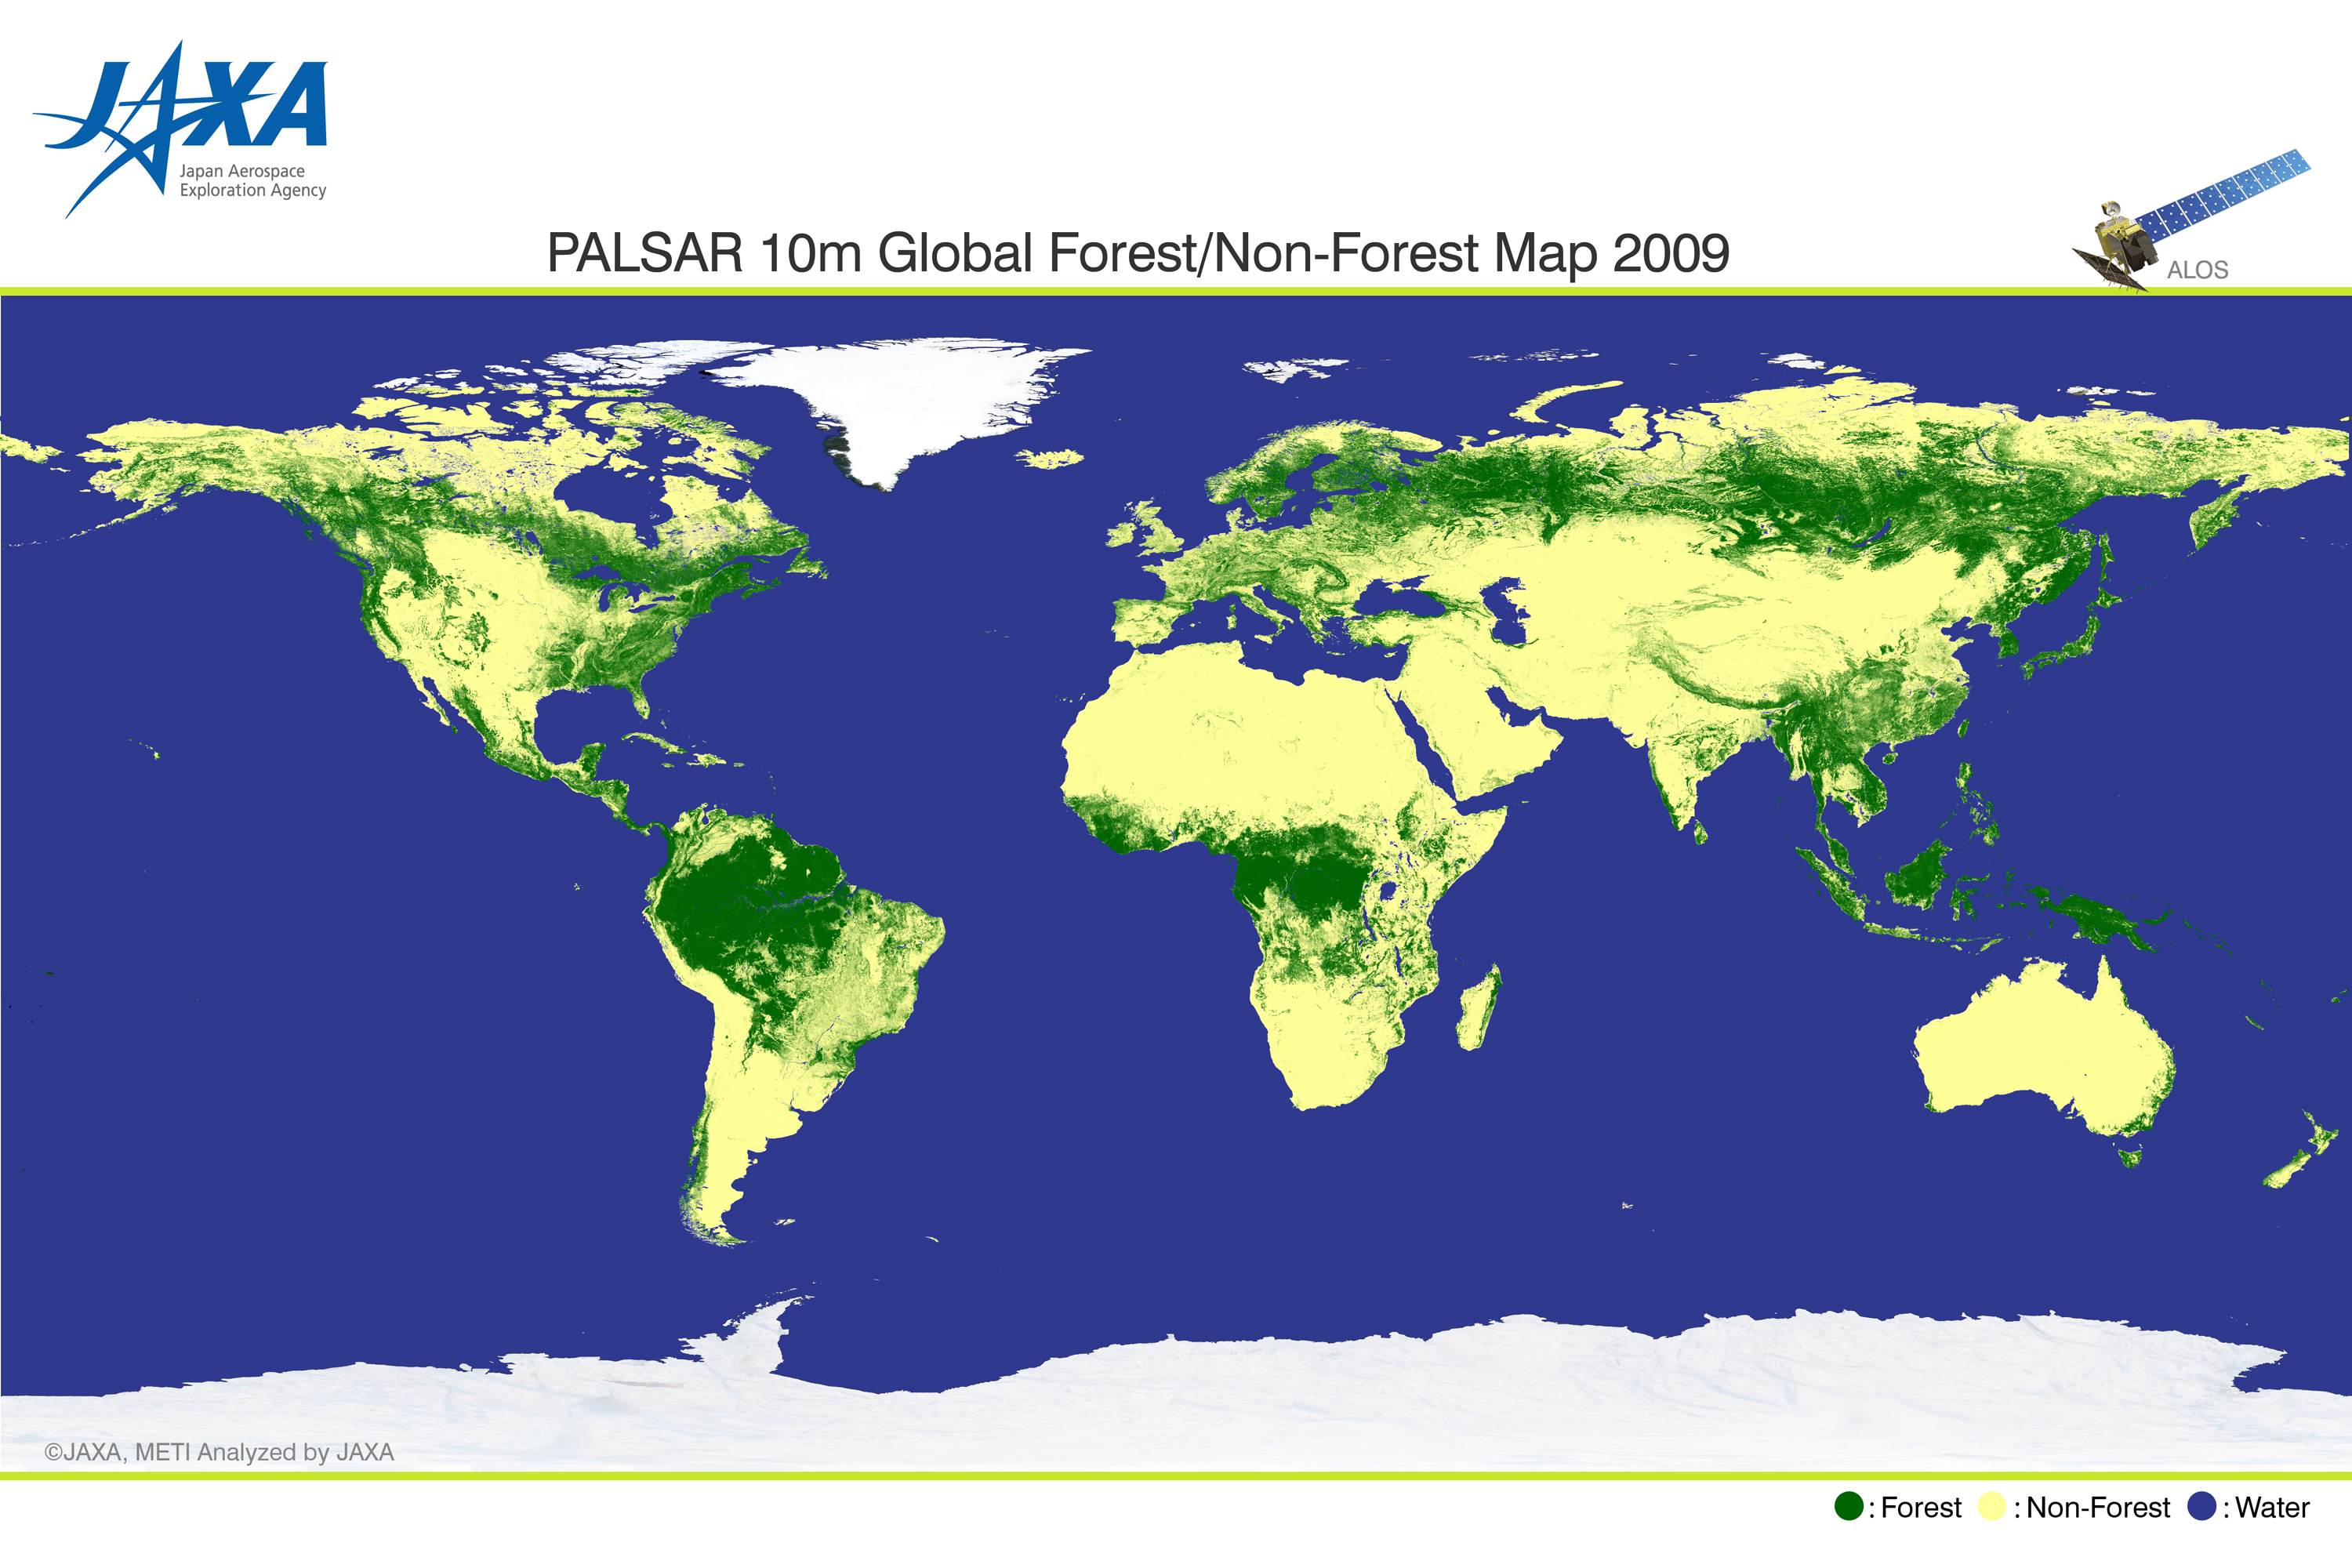
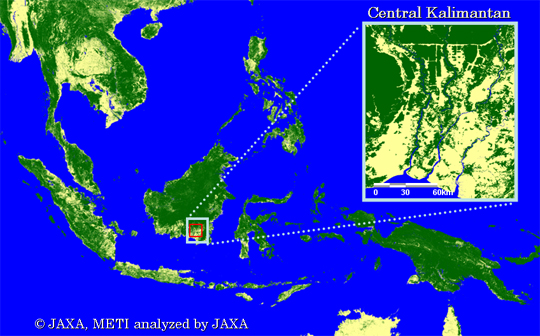
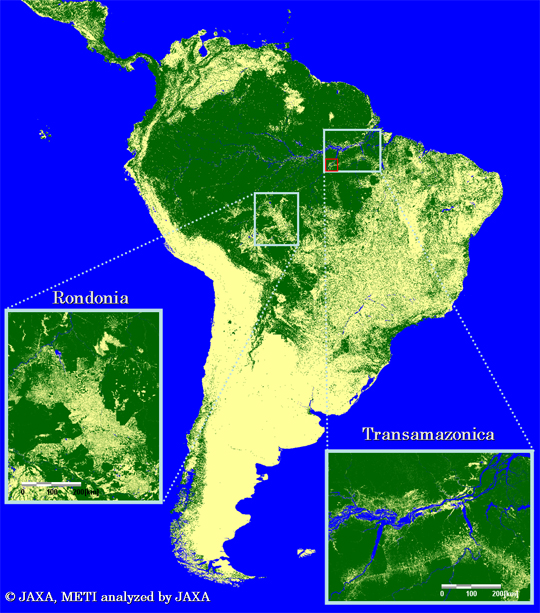
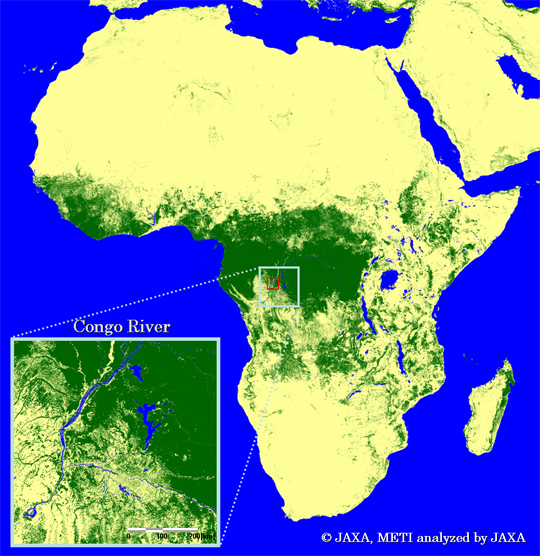
Figure-3 is partially enlarged images to show the Amazon, Africa and South-East Asia. Concerning South-East Asia, Central Kalimantan is enlarged to the maximum resolution of 10 meters. You can clearly see forest/non-forest conditions of the Palangkaraya region. (A 10m-meter resolution PALSAR image for red rectangle area of Figure 3 can be downloaded by clicking here.)
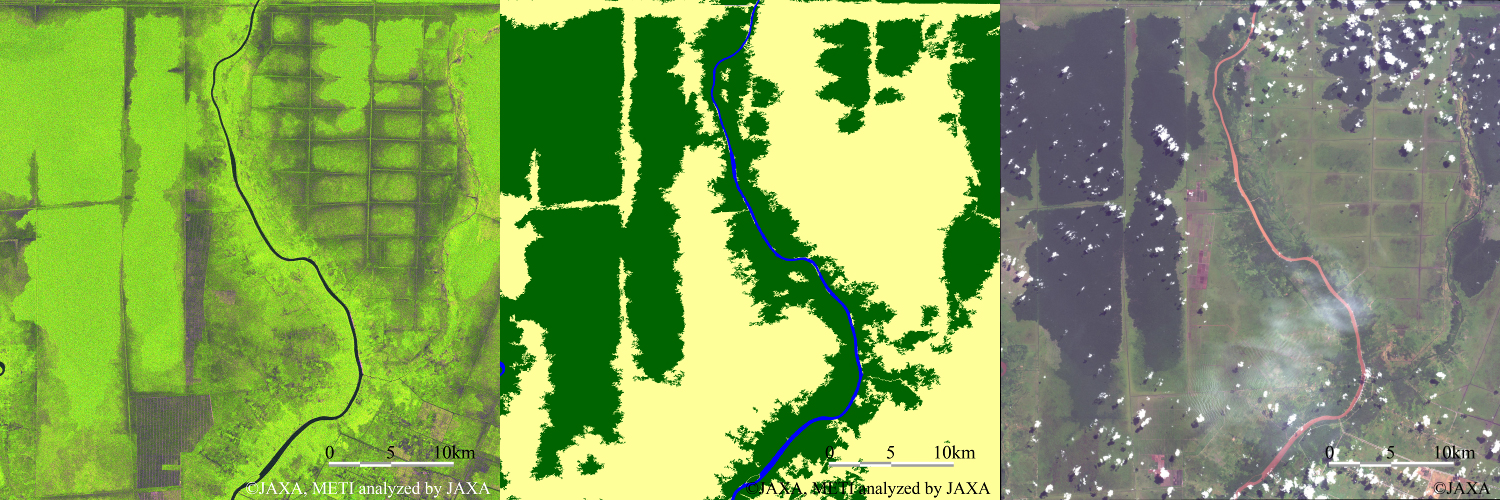
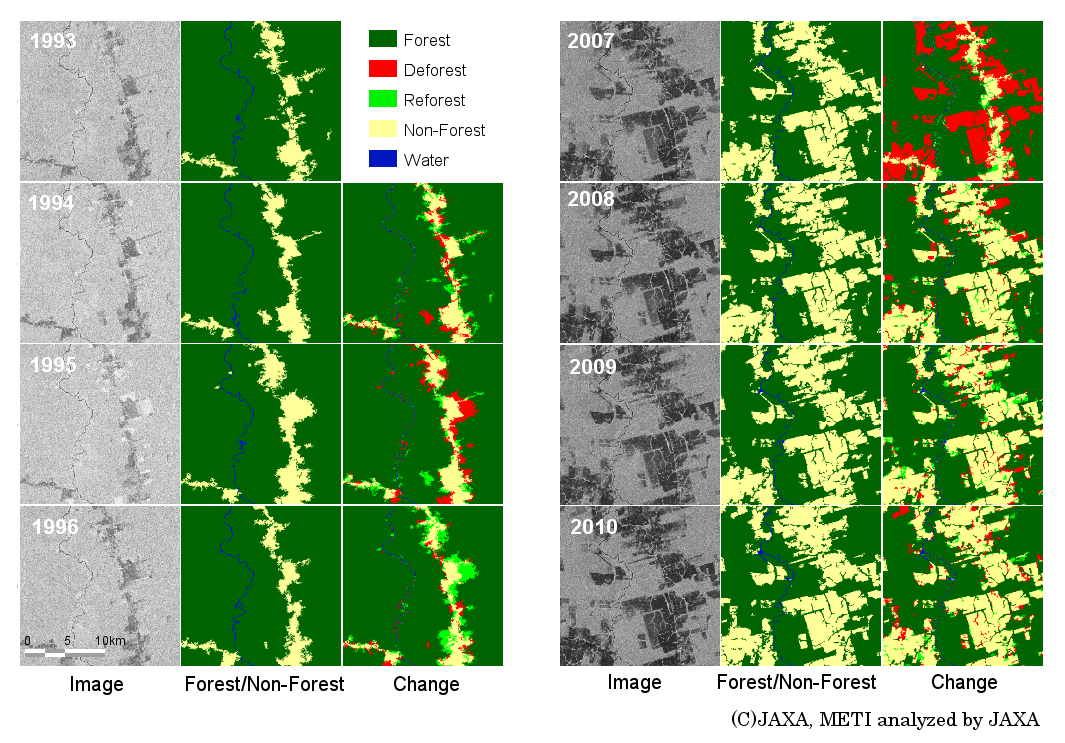
Figure 4 shows forestry change in the State of Para, the Amazon, between 1993 and 2010. Deforestation (blackened areas in images) was not very common in the 1990s, but was much more frequent after 2006, as you can see in the images. The images of the 1990s were taken by the radar aboard the Japanese Earth Resource Satellite "FUYO-1" (JERS-1.) By comparing acquired images in time order, you can understand the progress of deforestation and forest deterioration on a global scale.
JAXA will continue our forest observations using the DAICHI/PALSAR while analyzing and processing JERS-1 data to understand the global-scale change of forestry as well as that of forest carbon dioxide volume. Also we plan to conduct joint research with local organizations of various countries to make our information more accurate. As part of our activities, we will distribute data by concluding an agreement with cooperative organizations, and we will also publish low-resolution data on the JAXA website.
Note)*1 geometric correction: to correct image distortions which are seen in radar images.
*2 radiometric correction: also called "gradation correction" to correct the light and shade of an image due to the inclination of the land.
*3 Ground truth data set: data that is compiled based on local data of each one-degree square area in latitude and longitude gathered from the Degree Confluence Project (http://confluence.org/)
JAXA Public Affairs Dep.
Tel. +81-3-6266-6400 Fax. +81-3-6266-6910