Seen from Space 2019
Greenland Large melting in early summer
Satellite observations by Global Change Observation Mission - Climate "SHIKISAI" (GCOM-C) and Global Change Observation Mission - Water "SHIZUKU" (GCOM-W) missions over Greenland had confirmed a rampant increase of melting ice sheet area in June 2019, which was the largest melting in recent years. This article briefs JAXA/EORC analysis of early melting ice in Greenland during early summer in 2019 with an example of characteristic area.
An unusual photo at the fjord surrounding Qaanaaq, northwestern Greenland taken by a researcher from the Danish Meteorological Institute has drawn concerning attention in June 2019. In the picture, sled dogs waded through water on top of a melting sea ice, which seemed though they are running on water. Melting events in the polar regions or a high-latitude region usually occur in summer where such puddles are then formed over the sea ice, called "melt ponds". Particularly in this region, melting is not expected until July, but large areas of melt ponds formed sooner than previewed. Such large melt ponds in the fjord around Qaanaaq had been captured from space and depicted in the images below.
*1 SGLI VN8(673.5 nm), VN5(530 nm), VN3(443 nm) are color coded to red, green and blue, respectively.
*2 MSI Band 4(665 nm), Band 3(560 nm), Band 2(490 nm) are color coded to red, green and blue, respectively.
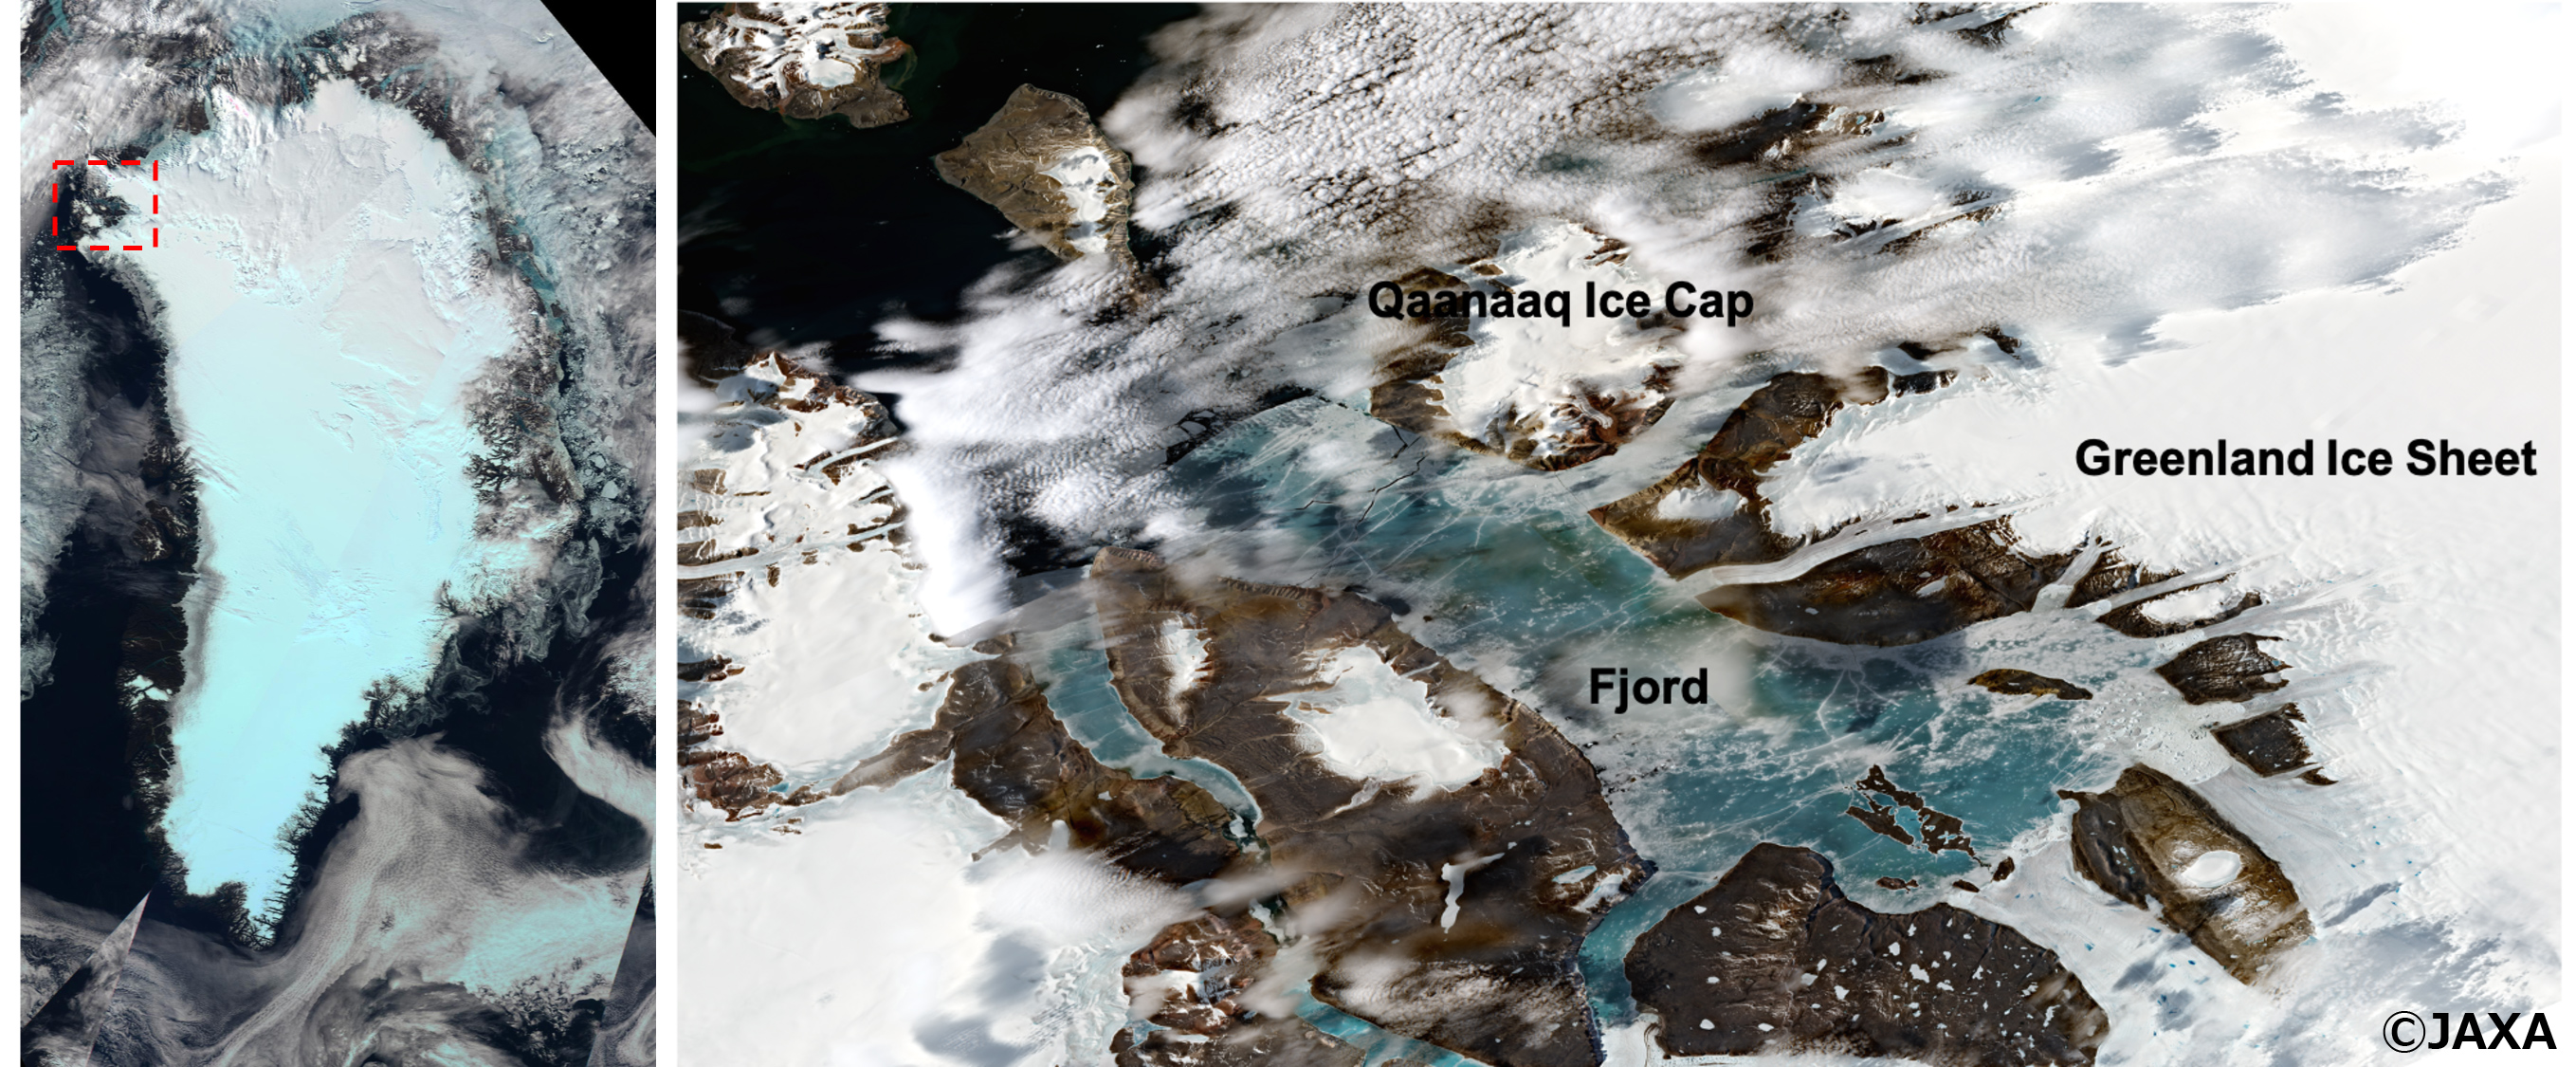
Figure 1. Right image showed the true color image of the fjord around Qaanaaq captured in June 17, 2019 by Sentinel-2 (European Space Agency (ESA)). Clouds, ice sheet and snow were shown white, and the sea ice in the fjord were shown white or slightly dark blue. Dark parts in the sea ice were the area where surface become liquid phase. If the surface is surrounded with snow, it appears in bright white color. However, most parts of the sea ice were showed dark, so surface melting occurred in the fjord resulting in melt ponds.
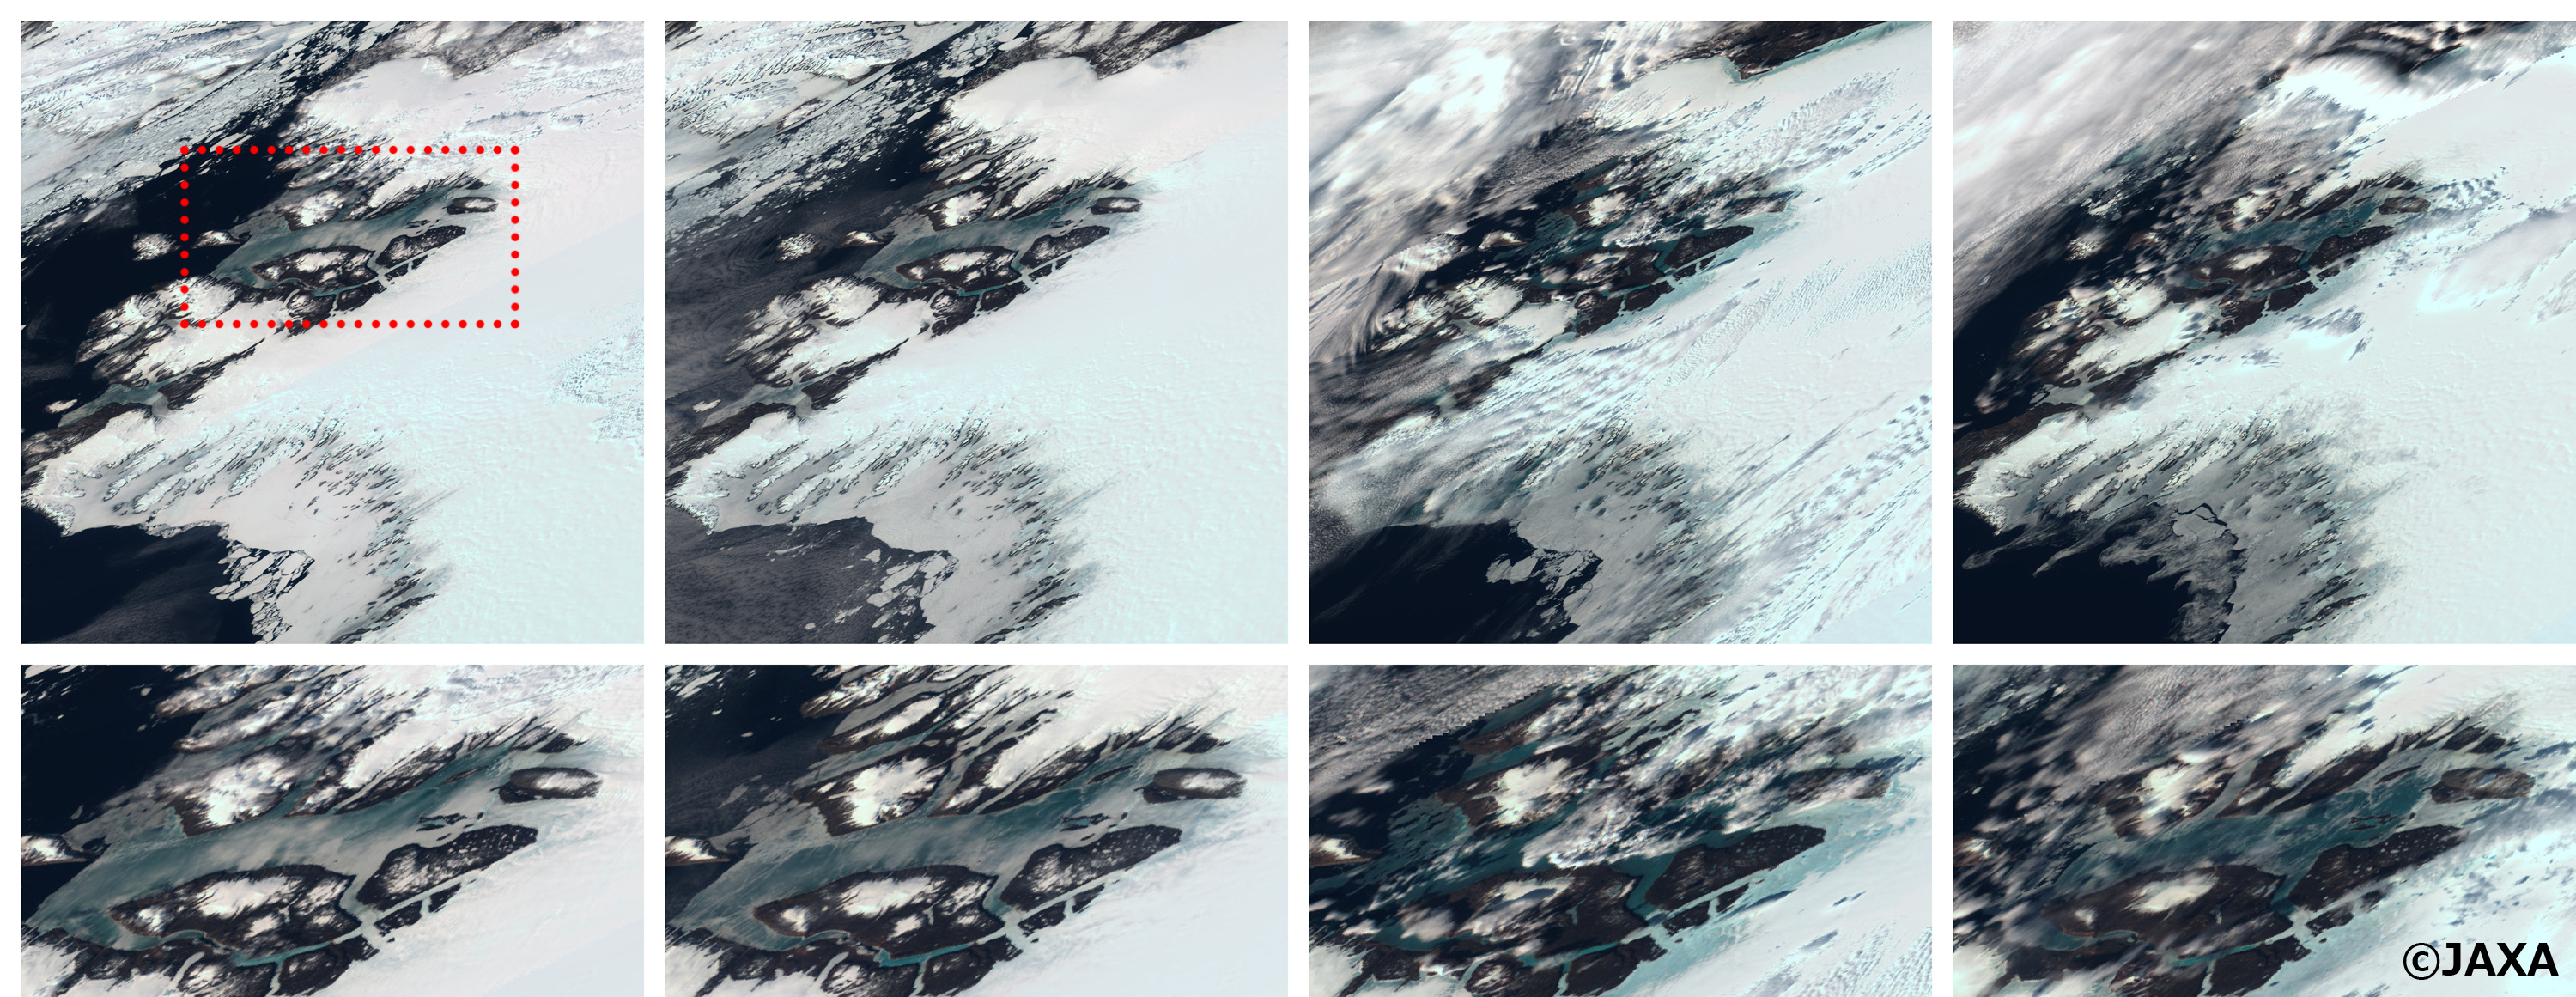
Figure 2. showed the condition of Qaanaaq fjord obtained by Global Change Observation Mission - Climate "SHIKISAI" (GCOM-C). It captured larger swaths than usual high-resolution satellites, such as Sentinel-2. Also, "SHIKISAI" (GCOM-C) can capture rapid changes due to its high-frequency observation. Sea ice area was shown white over the fjord in Figure 2-left, taken in June 7, 2019, as it was covered with snow. After about 10 days, melting sea ice surface and snow formed large melt ponds covering the whole fjord area.
By analyzing multiple satellites data, it can be clearly seen that such large melting phenomena is occurring not only in fjord of Qaanaaq, but also in other areas of the Greenland Ice Sheet.
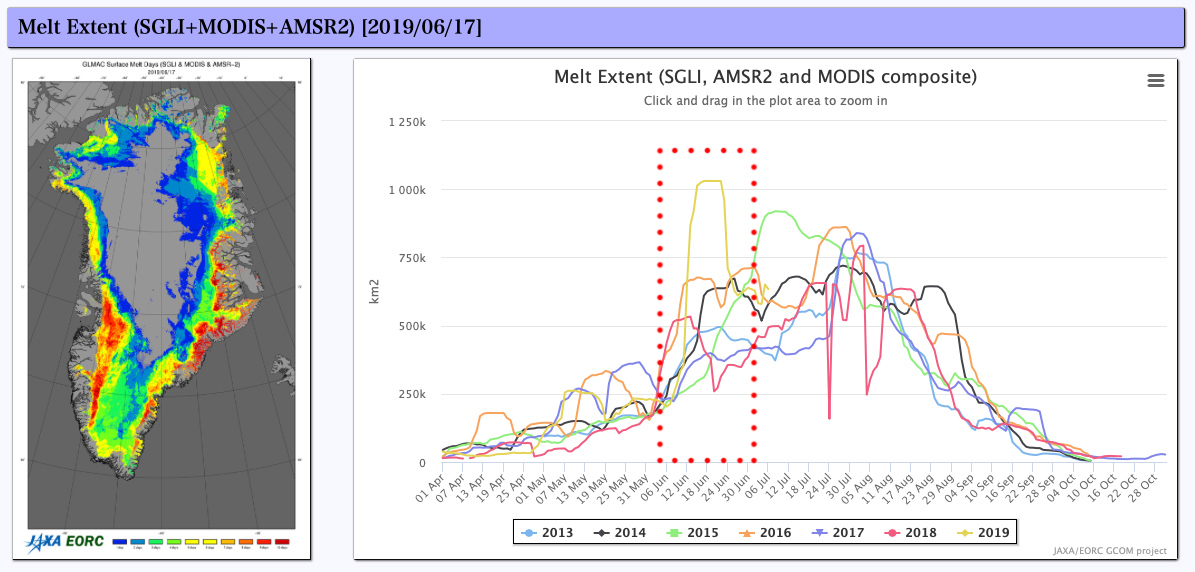
Figure 3. (left) showed the distribution in melting area of Greenland Ice Sheet operated by JASMES Greenland Ice Sheet Monitoring. The color code illustrated the number of melting days within a 10-day-period. Surface melting seemed to be occurred in large areas of the northeast and north, not just in the northwest where the Qaanaaq fjord with large melt ponds were located. Figure 3. (right) showed the change of melting area of ice sheet after 2013. Analysis by JAXA/EORC showed that melting areas of ice sheet had been the largest registered in recent years for the period of June 2019, shown in orange color in the red square. Melting extent of ice sheet had been rampant in mid-June and has greatly declined in July onwards. Comparing with previous years, the figure showed that the melting extent was within similar amounts. Therefore, the sudden surface melting events is likely to have been occurred in short-term periods.
JAXA/EORC integrates multiple satellites data for monitoring of Greenland ice sheets, namely from GCOM series. "SHIZUKU" (GCOM-W/AMSR-2) carries onboard a radiometer for microwave measurements of sea surface temperature, snow depths, among other applications, and its observation is inherently less affected by clouds. "SHIKISAI"(GCOM-C/SGLI), Terra/MODIS and Aqua/MODIS provide optical and thermal infrared observations by measuring surface reflectance and temperatures with high spatial resolution. "SHIKISAI"(GCOM-C) and "SHIZUKU"(GCOM-W) are complementary missions part of the Global Change Observation Mission program, with overall objective to provide sustained long-term observations and datasets for supporting research on global change. Therefore, ice sheets monitoring in Greenland are made possible with the combination of optical, thermal infrared and microwave observations provided by the sensors of "SHIKISAI"(GCOM-C) and "SHIZUKU"(GCOM-W).
Ice and snow surfaces have naturally high albedo, as sunlight is efficiently reflected. Moreover, they play important roles in balancing the global climate by blocking the transit of heat and moisture from ocean to the atmosphere. It has been reported great decline of Arctic sea ice, with more significant changes in recent years. Melting of the Greenland Ice Sheets is also expected to greatly affect world sea levels.
In order to contribute for the long-term monitoring of global environmental changes - including ocean ice and Greenland Ice Sheet -, JAXA/EORC provides data from "JASMES" (JAXA Satellite Monitoring for environmental Studies) and "JASMES Greenland Ice Sheet Monitoring". The data covers distribution of sea-ice concentration and sea-ice area information in the Arctic, as well as changes in melting area, bare ice area and dark colored ice area in the Greenland Ice Sheet. Moreover, EORC is cooperating with external institutions. Data is provided to users through "ViSHOP" on Arctic Data archive System - "ADS", operated by National Institute of Polar Research. EORC aims to continuously provide cryosphere monitoring within Polar regions by multiple satellites including GCOM constellation.
Explanation of the Images
Figure 1.
| Satellite | Global Change Observation Mission - Climate "SHIKISAI" (GCOM-C) (Left) Sentinel-2 (Right) |
|---|---|
| Sensor | Second generation GLobal Imager (SGLI) (Left) MultiSpectral Instrument (MSI) (Right) |
| Date | June 17, 2019 (Right) |
Figure 2.
| Satellite | Global Change Observation Mission - Climate "SHIKISAI" (GCOM-C) |
|---|---|
| Sensor | Second generation GLobal Imager (SGLI) |
| Dates | June 7, 10, 13 and 17, 2019 |


