Seen from Space 2012
A new record minimum of the Arctic sea ice extent
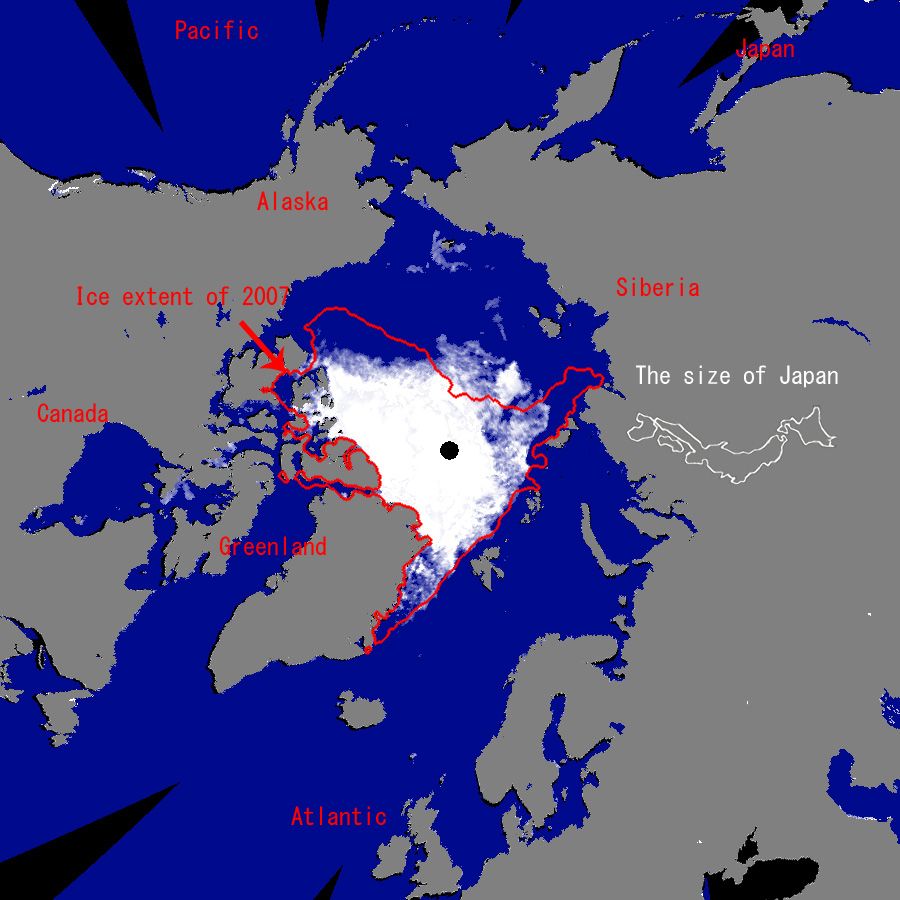
Melt season in the Arctic Ocean came in the summer of 2012. The Arctic sea ice is shrinking at an unprecedented rate this year and set a record minimum. A record minimum sea-ice coverage of 4.21 million sq km was observed by satellite on 24 August 2012, one month earlier than previous minimum record set on 24 September, 2007. 
Shrinking rate of the Arctic sea ice is still kept high. Every year the sea ice shrinking continues until around the middle of September. The annual minimum of sea ice extent this year is possible to be less than 4 million sq km.  Fig. 3 Daily rate of the Arctic sea ice extent variation The Figure 3 shows the daily rate of sea ice extent variation during May to August in 2003 to this year. Positive value indicates the extension of sea ice extent and negative value indicates the sea ice shrinkage. This summer sudden reduction of the sea ice extent occurred at the beginning of August. This event was coincident with the occurrence of the giant polar low over the Arctic Ocean which was captured by NASA’s MODIS sensor (Fig. 4). 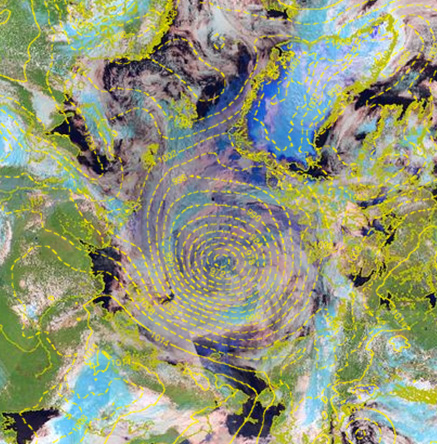 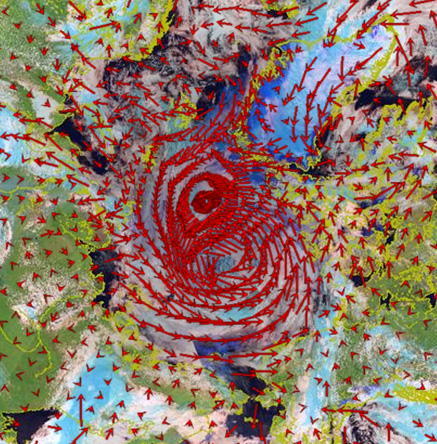 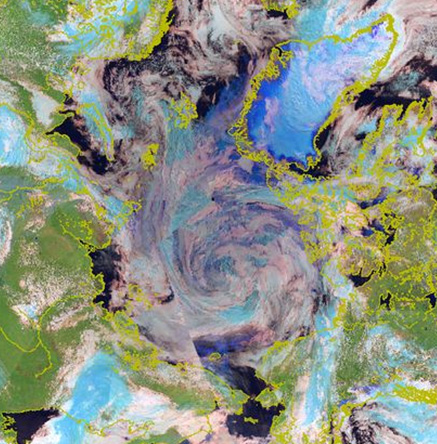  Fig. 4 Satellite image of giant polar low over the Arctic Ocean on 7 Aug. 2012
(Sea level pressure and wind vector data is provided by Japan Meteorological Agency) The size of the polar low is about that of the Japan islands. AMSR2 captured well the scene of the rapid sea ice reduction under the giant low system as seen in Fig. 5 (animation). The Arctic sea ice extent continued to decrease in the middle of August and at last set the absolute minimum record on 24 August. 
Fig .5 Animation of AMSR2 brightness temperature images
(Jul. 3-Aug. 24, 2012) The shrinkage of the Arctic sea ice will continue for a while till the middle of September. JAXA has continued to monitor the Arctic sea ice and to report the latest information. You can find the latest data and images of sea-ice extent in the Arctic Ocean as well as previous observation images on Arctic Sea-Ice Monitor in the IARC-JAXA information system (IJIS) maintained by JAXA and located at the International Arctic Research Center (IARC, Fairbanks, Alaska). (URL:http://www.ijis.iarc.uaf.edu/cgi-bin/seaice-monitor.cgi?lang=e) Explanation of the Images: (Fig. 1a)
(Fig. 1b)
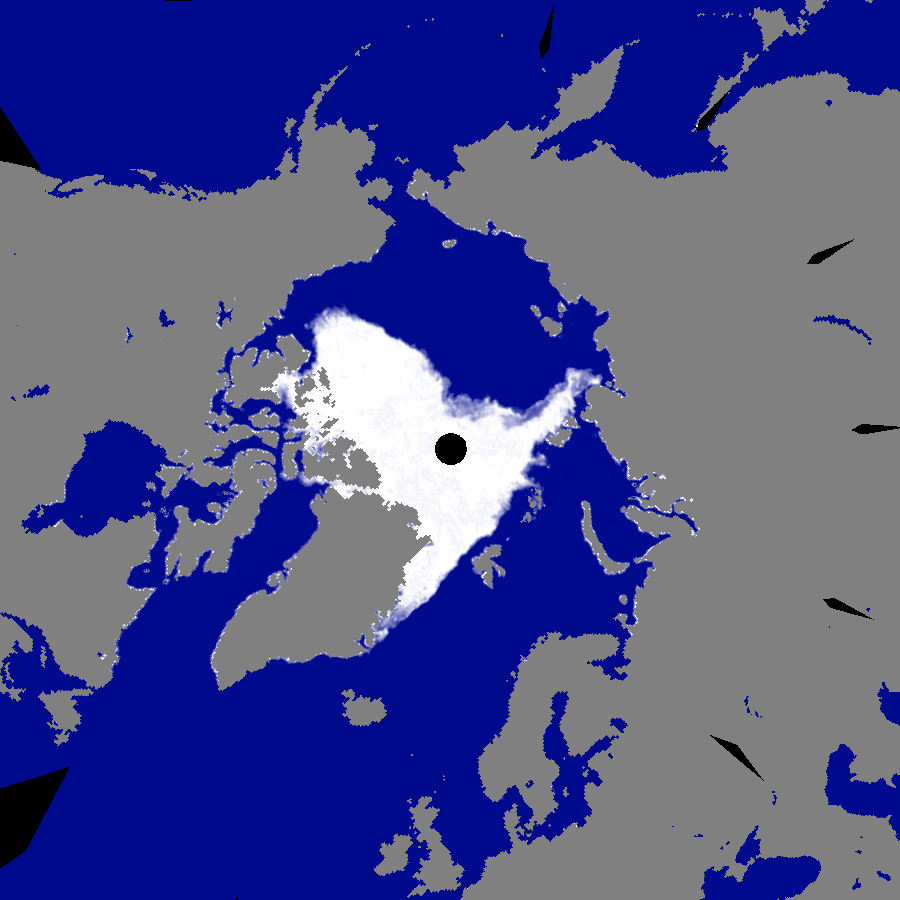
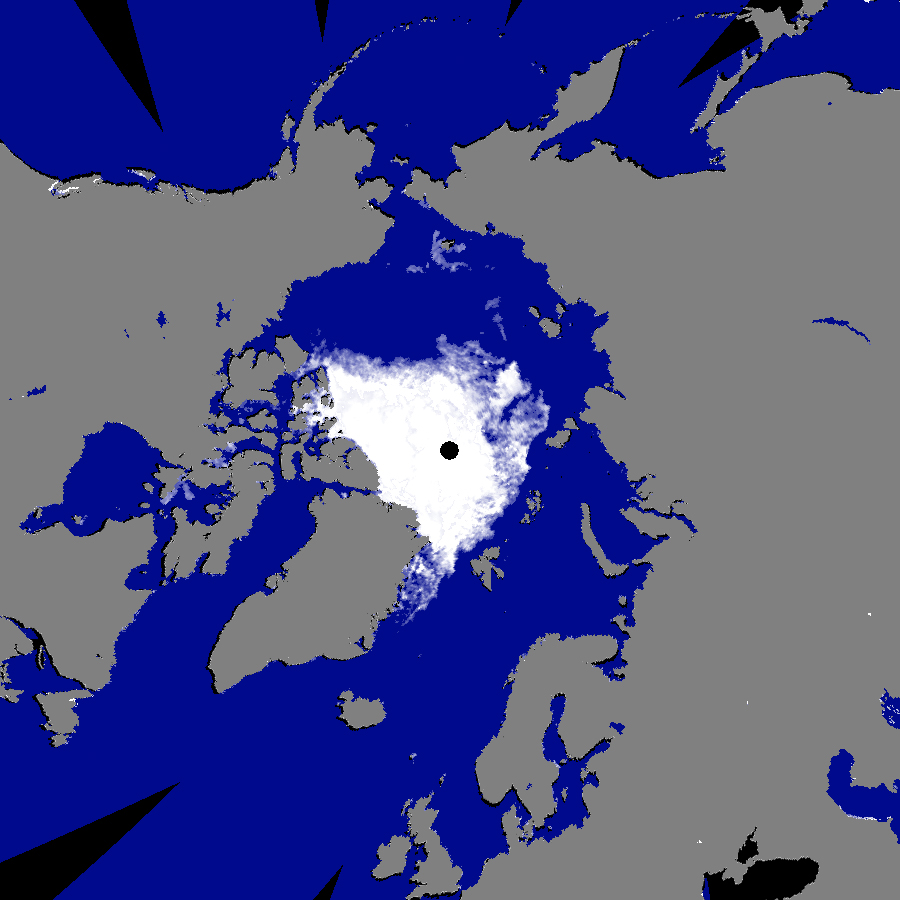
Figure 1 shows the calculated concentration of sea ice based on the algorithm developed by one of the Principal Investigators (PI) for AMSR2 algorithm development, Dr. Josefino C. Comiso from NASA GSFC. The calculation uses 36.5-GHz and 18.7-GHz horizontal and vertical polarization data of the AMSR-E or AMSR2. The spatial resolution of Fig. 1 data is approximately 25km. (Fig. 4)
Figures 4 shows RGB color composite of MODIS reflectance at band 7, 5, 2. The spatial resolution is approximately 5km. (Fig. 5)
Figure 5 shows animation of AMSR2 brightness temperature images. The RGB composite images using 36GHz-V、18GHz-V、89GHzPR (Polarization Ratio). The spatial resolution is approximately 5km. |