Seen from Space 2012
Sea ice coverage in the Southern Ocean

Fig. 1. Variation of sea ice coverage in the Southern Ocean from 2003 to 2010 observed by Advanced Microwave Scanning Radiometer for EOS (AMSR-E). Figure 1 shows the variation of sea ice coverage in the Southern Ocean observed by Advanced Microwave Scanning Radiometer for EOS (AMSR-E)*1 from 2003 to 2010. Since microwaves can penetrate clouds, sea ice can be observed even under adverse weather conditions. The colors in the image represent the concentration degrees*2 of the sea ice; darker red indicates denser ice. Ice coverage is lowest in March and highest in September when the Southern Ocean is in autumn and spring, respectively. Sea ice coverage indicated in the figure did not differ significantly during the eight years of observation. In contrast, sea ice in the Arctic Ocean has shown a decrease in accordance with the progression of global warming. An August 1, 2006, image displayed on our home page shows significant variation in sea ice that differs in coverage area and distribution patterns from that in the Southern Ocean. The reasons for the inconsistent nature of sea ice in these oceans are unclear. In warmer climates, sea ice is more likely to melt. Conversely, an increase in the amount of rain or snowfall results in thicker sea ice. However, if the temperatures in the Southern Ocean rise owing to an increase in atmospheric greenhouse gases concentration, the amount of precipitation is predicted to increase over the Antarctic Continent, and consequently, the sea ice will begin to rapidly melt. *1) The Advanced Microwave Scanning Radiometer for EOS (ASMR-E) was developed by the Japan Aerospace Exploration Agency (JAXA) and was onboard the 2002 launch of Aqua, NASA’s international Earth Observing System. This satellite is used to collect data on sea surface temperature, precipitation, soil moisture, and ice coverage in the Arctic and the Antarctic oceans. On October 4, 2011, AMSR-E automatically halted observation because its antenna rotation torque had reached its limit for maintaining rotation speed at 40 revolutions per minute to keep normal operating function. The Global Change Observation Mission 1st - Water "SHIZUKU" (GCOM-W1) was launched successfully on May 18, 2012(JST). The Advanced Microwave Scanning Radiometer 2 (AMSR2) on "SHIZUKU" (GCOM-W1) is a successor to the AMSR-E. 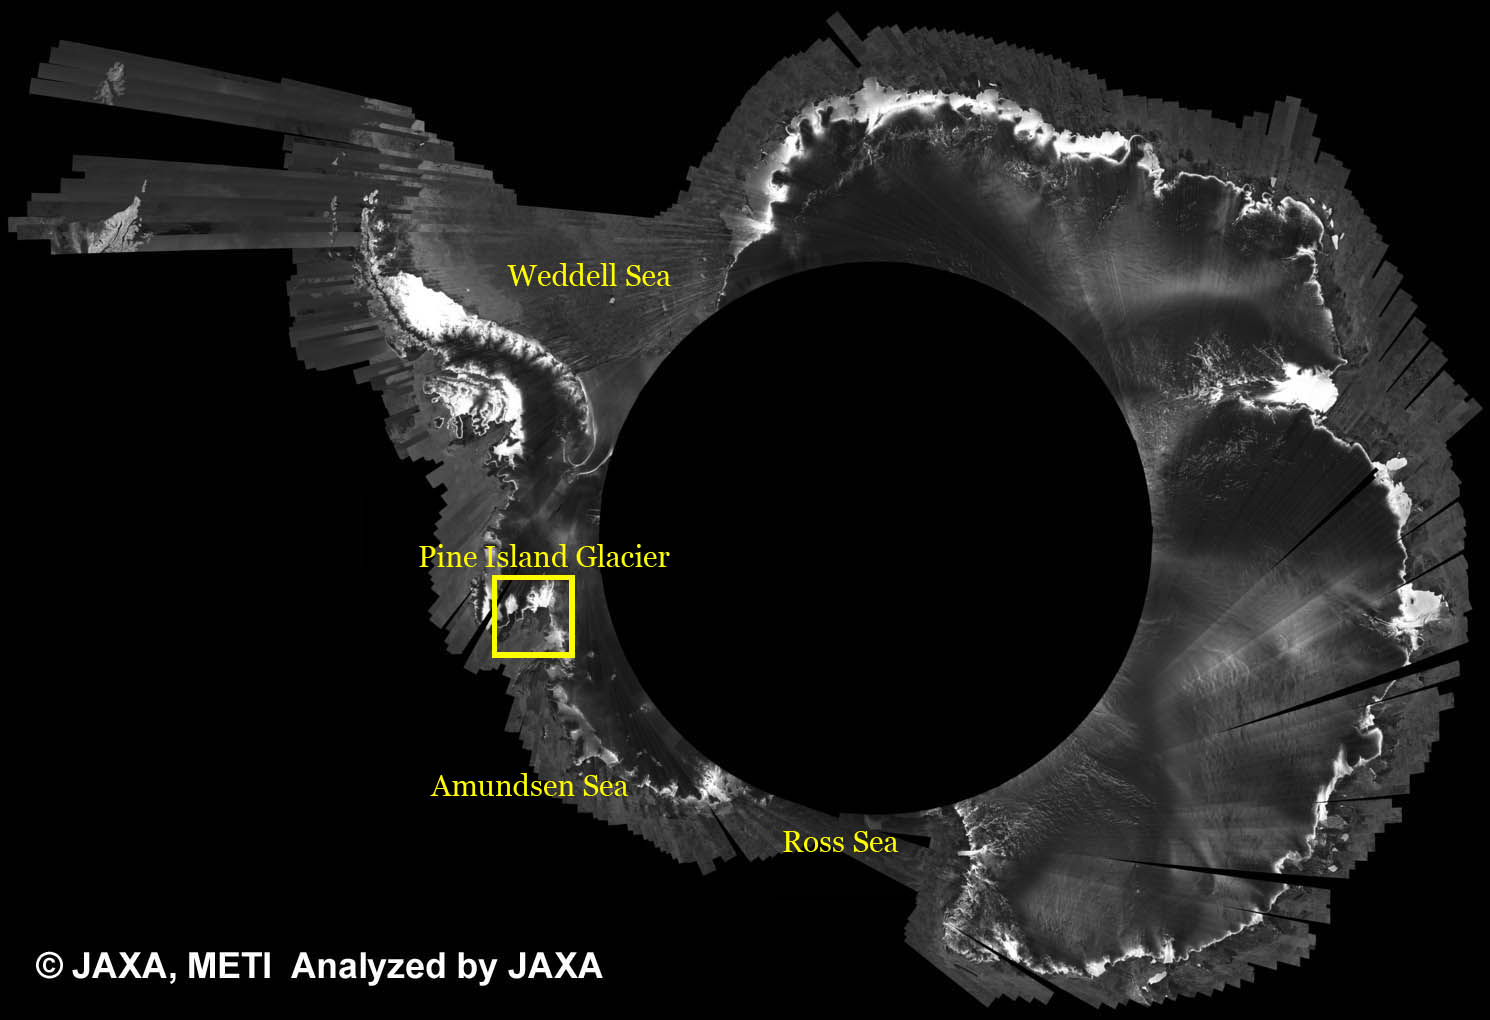 Fig. 2. Antarctica mosaic image of Phased Array type L-band Synthetic Aperture Radar (PALSAR) obtained from September 15–October 30, 2010. Figure 2 shows a September 15–October 30, 2010, browse mosaic image obtained by Phased Array type L-band Synthetic Aperture Radar (PALSAR) onboard the Daichi Advanced Land Observing Satellite (ALOS)*3. The resolution of the image is 500 m; the black area at its center contains no data. This image is posted on the International Polar Year (IPY) home page. *3) Advanced Land Observing Satellite (ALOS) operation ended May 12, 2011. ALOS accumulated 6.5 million images of worldwide coverage during its five-year operational period. ALOS recorded more than 400 images of the March 11, 2011, Great East Japan Earthquake and contributed to emergency disaster applications research by providing data to ten government agencies. In addition, archived ALOS imagery will be used in the Reducing Emissions from Deforestation and Forest Degradation Plus Conservation (REDD+) project. To investigate long-term changes in polar region ice, we used synthetic aperture radar (SAR), which can observe land coverage, including ice, under cloudy and dark conditions. Sea ice around the Southern Ocean undergoes seasonal expansion and contraction and includes detached glacier edges that drift as icebergs offshore. The images in Figure 3 show changes in Antarctica’s Pine Island Glacier that reflect such ice detachment. 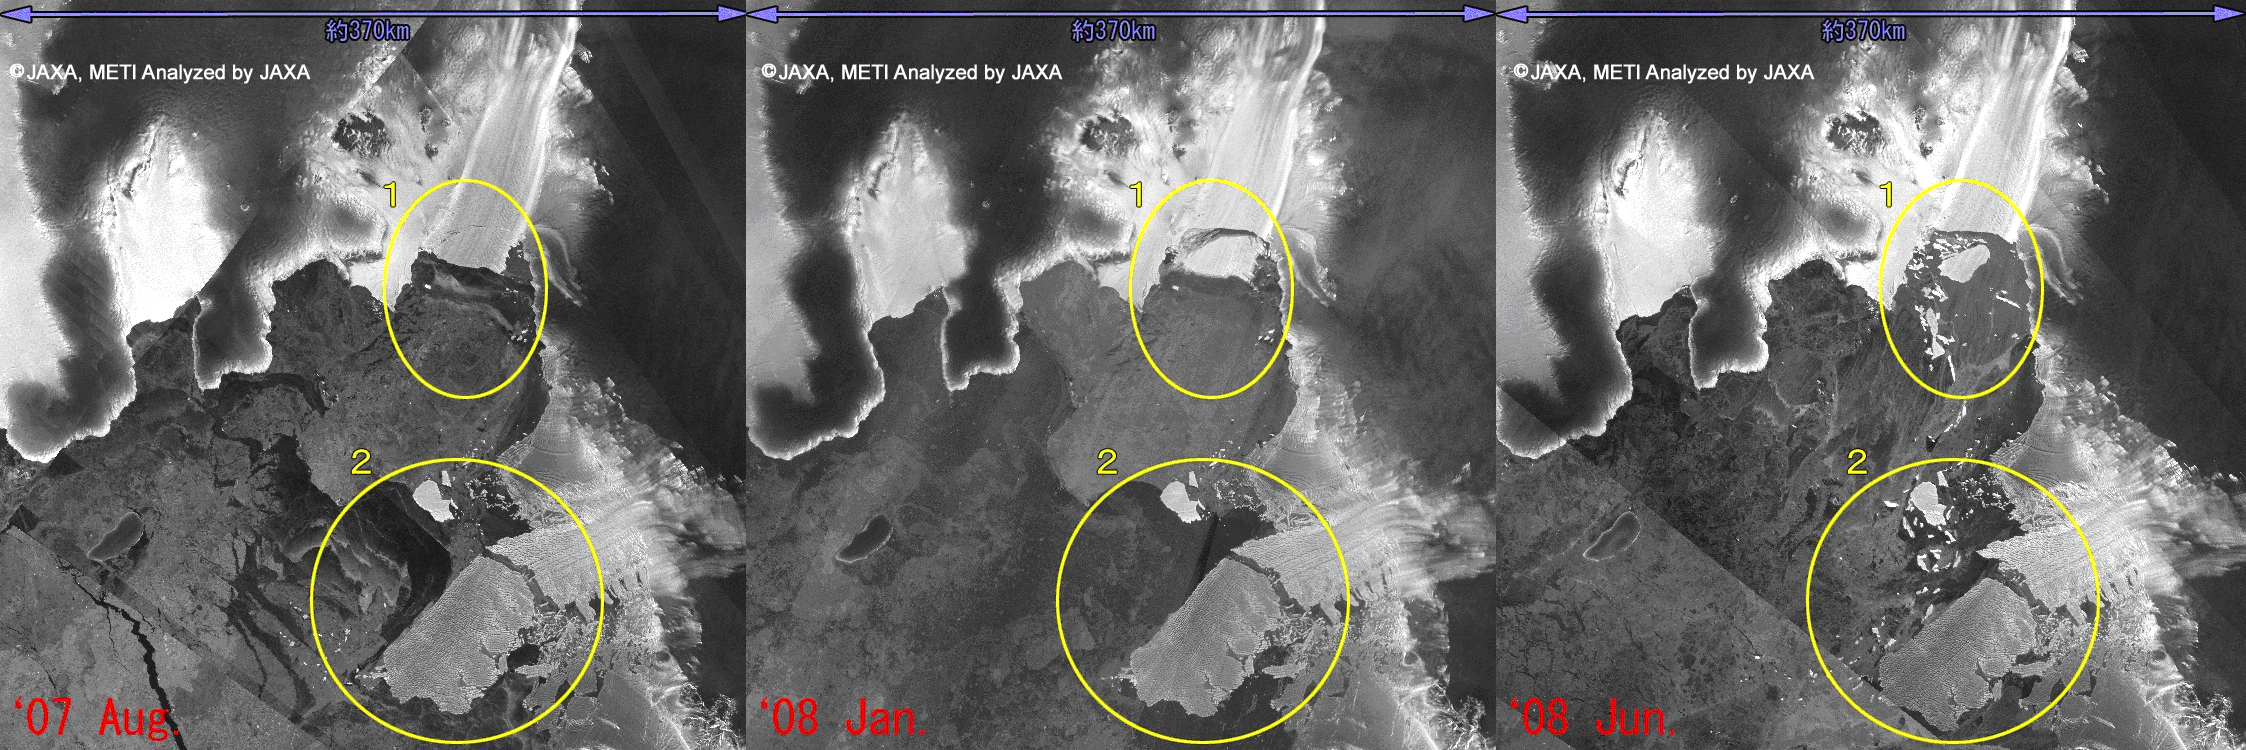 Fig. 3. Coastal changes observed in Antarctica’s Pine Island Glacier. Images were obtained during (a) August 2007, (b) January 2008, and (c) June 2008. 
Outflow of icebergsThe Antarctic continent undergoes rapid warming. Ice is created over the sea during winter to maintain contact between icebergs and land. Although the area of sea ice does not change remarkably in winter, adjoining ice shrinks as a result of global warming. Consequently, many icebergs begin to drift, and massive icebergs the sizes of very tall buildings are stranded in shallow regions. These icebergs could collide with and destroy seabed life. Explanation of the Images:
|


