ページの先頭です。
本文へジャンプする。
【Important Notices】This page is an archive page of information published in the past. Since the update has been completed, it may contain broken links or outdated information. For the latest information, please use the new site Earth-graphy (earth.jaxa.jp).
ここからサイト内共通メニューです。
サイト内共通メニューを読み飛ばす。
サイト内共通メニューここまで。
ここから本文です。

Seen from Space 2008

Arctic sea-ice second smallest on record

 
Fig. 1. Sea-ice concentration observed by AMSR-E on Sep. 23, 2008
Fig. 2. Seasonal variation of the Arctic sea-ice concentration captured by AMSR-E (as of Sep. 23, 2008)
Melt season in Arctic sea came in the summer of 2008. The sea-ice area did not reach the record low (4.255 million square kilometers) observed in 2007, but did shrink to the second-lowest area (4.708 million square kilometers) this year.
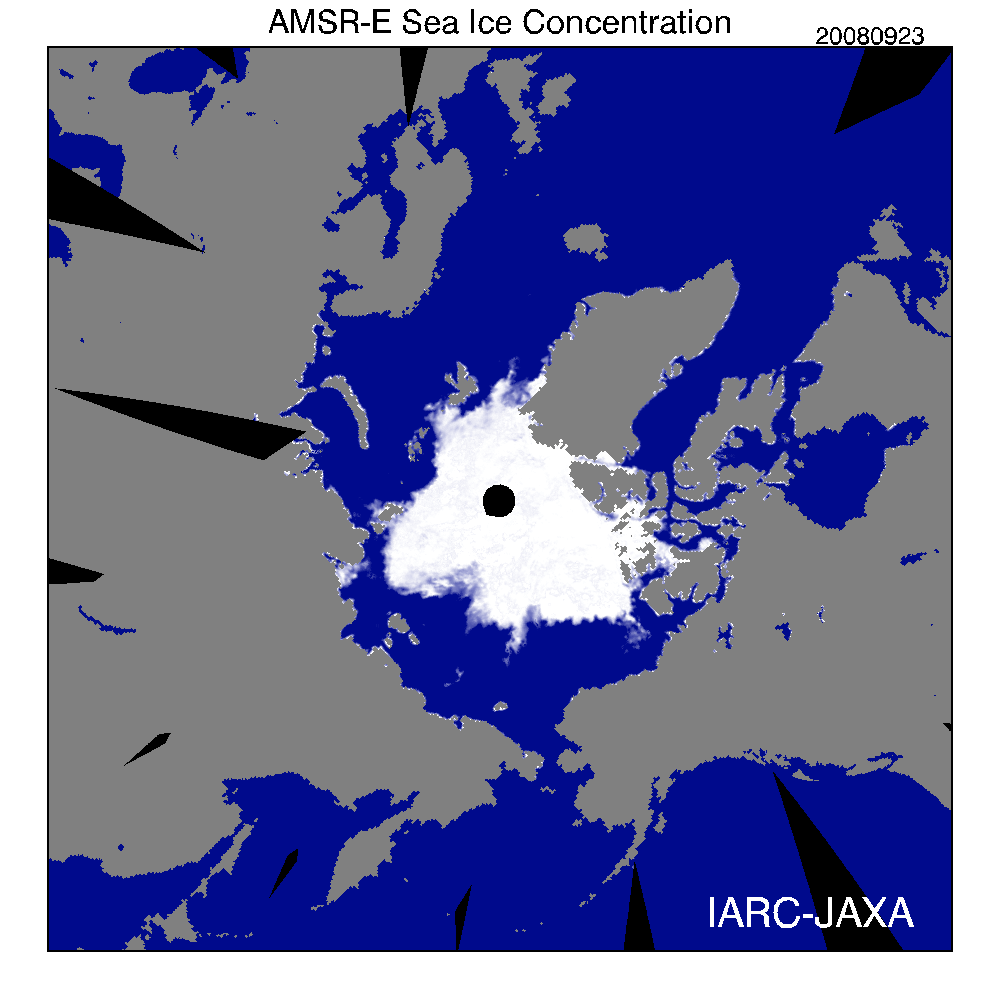
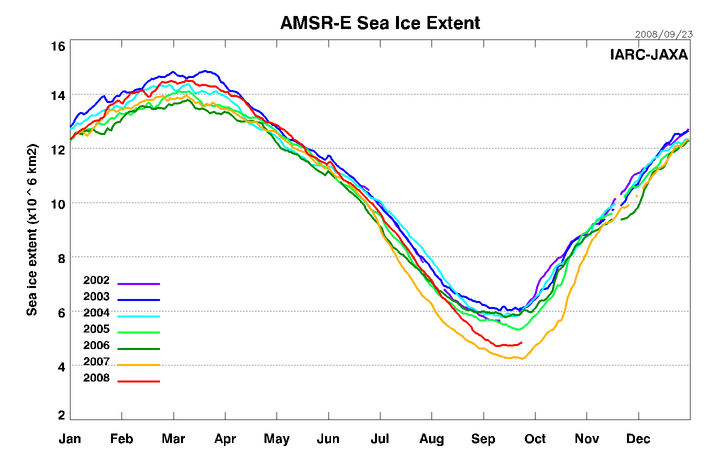
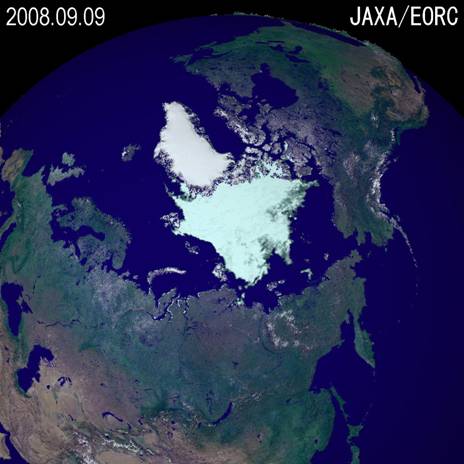
Figure 1 presents the distribution of Arctic sea observed by AMSR-E on September 23, 2008, and Fig. 2 depicts the seasonal variation of the Arctic sea-ice concentration observed daily from 2002 with respective colored lines every year. The orange line (2007) indicates a rapid decrease from the beginning of July. The sea ice subsequently reached the lowest area since satellite measurements began.

The red line (this year) suggests the same shrinking rate as in 2005 and 2006 up to the beginning of August, and still continuous rate up to September, although the melting rate was usually slow after mid August. As a result, annual minimum extent of sea-ice this year reached to an area slightly larger than that of the lowest record measured in 2007. An area of sea ice 1.6 times as great as the Japanese Archipelago was lost compared with the second previous record low measured in 2005.
The sea-ice area shrank at a constant rate for two weeks beginning on September 9, but the area was expected to increase because the edge of the sea ice began to freeze after the autumnal equinox.

Fig. 3. Lowest Arctic sea-ice area distribution in 2005 (left), 2007 (middle) and 2008 (right) captured by AMSR-E
Figure 3 presents the record low sea-ice distributions recorded in 2005, 2007 and 2008.
This year (2008) sea ice remained in the Siberian Sea after having disappeared in 2005 and 2007. Furthermore, the sea ice near Canada also disappeared, although the thick, old (multi-year) ice was usually dense. You can see that the edge of the sea ice retreated from Alaska to Canada and its area shrank. In addition, sea ice flowed into the Atlantic Ocean along the east bank of Greenland last year, but not this year.

The article Arctic Sea Ice getting thinner and thinner of this ‘Seen from SpaceEseries noted that the Arctic sea ice was very thin and fragile this spring. This summer’s weather was not more suited for melting sea-ice than that of last year with respect to sunshine, although fine weather continued for a very long time last year. Instead, the second lowest sea-ice record is considered due to the rapid thinning of the spring sea-ice seen within a recent few years. Thus, the Arctic sea ice is likely to get easier to melt under usual air and sea-water temperatures in summer.

JAXA has continued to monitor the Arctic sea ice and to report the latest information.
You can find the latest data and images of sea-ice extent in the Arctic Ocean as well as previous observation images on Arctic Sea-Ice Monitor in the IARC-JAXA information system (IJIS) maintained by JAXA and located at the International Arctic Research Center (IARC, Fairbanks, Alaska).


Explanation of the Images:
(Click the images twice to enlarge.)
Fig. 1
Satellite: EOS-Aqua (NASA)
Sensor: Advanced Microwave Scanning Radiometer for EOS (AMSR-E), (JAXA)
Date: September 23, 2008
Figure 1 depicts the calculated concentration of sea ice based on the algorithm developed by a Principal Investigator (PI) for AMSR/AMSR-E algorithm development, Dr. Josefino C. Comiso from NASA GSFC. The calculation uses 36.5-GHz and 18.7-GHz horizontally and vertically polarized data acquired by AMSR-E. The spatial resolution of Fig. 1 data is approximately 25km.

Fig. 3
Satellite: EOS-Aqua and Terra (NASA)
Sensor: Advanced Microwave Scanning Radiometer for EOS (AMSR-E; JAXA)
MODIS: Moderate Resolution Imaging Spectro-radiometer (NASA)
Date: AMSR-E: September 22, 2005, September 24, 2007, and September 9, 2008
MODIS: August 16 to September 15, 2005, 2007 and 2008
Spatial Resolution: 9km
Figure 3 presents a cloud-free composite image of land from MODIS and sea ice from AMSR-E during one month. The color composition was made by using three out of 36 channels on MODIS: channel 1 (620 to 670nm) for red, channel 2 (841 to 876nm) for green and channel 3 (459 to 479nm) for blue. The sea is also blue in this image.

Green: Forests
White: Snow or sea ice
Brown: Deserts

Related Sites:
AMSR/AMSR-E
Confirmed record minimum Arctic sea ice
Arctic sea-ice area smallest on record
Sea ice in the Arctic Ocean continues to recede. In 2005 it reached its smallest extent since observation began by spaceborne microwave radiometers.
Cryosphere, Seen from Space
本文ここまで。
image:Satellite Navigator
image:Satellite Applications and Operations Center(SAOC)
Earth Data Collection by JAXA Satellites
image:ページTOP