| |
 |
 |
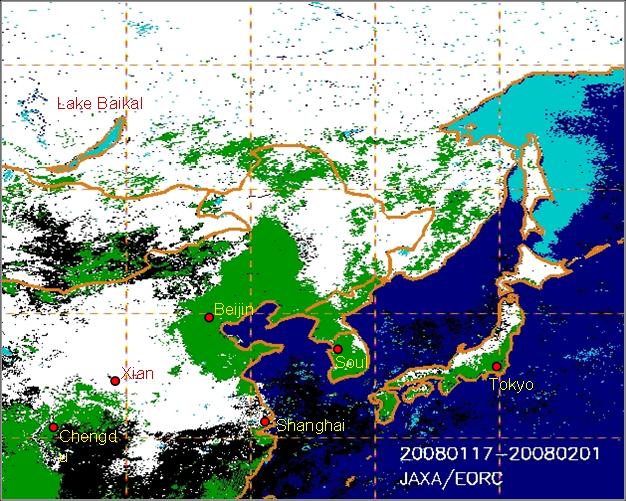
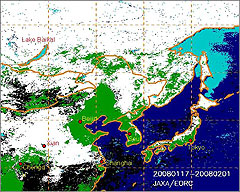
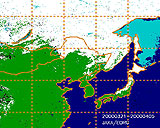
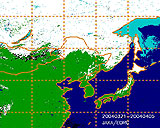
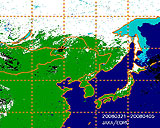
| Fig. 1. Snow cover extent in Eastern Asia (Jan. 17 to Feb. 1, 2008) |
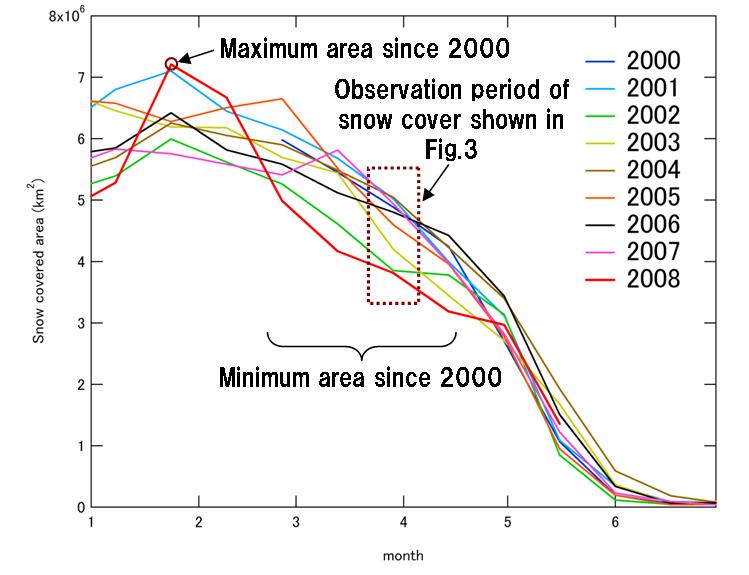
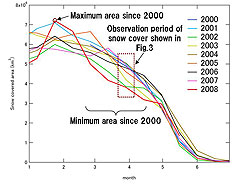
Fig. 2. Seasonal variation of the snow-covered area in Eastern Asia during 2000 to 2008. |
A severe cold wave hit south-east China this winter, hampering land traffic such as railways around Chinese New Year and thus preventing many people from returning to their home towns.
Figure 1 depicts the snow-cover extent in Eastern Asia as derived from reflectance data of the Moderate Resolution Imaging Spectroradiometer (MODIS) aboard NASA's Earth-observing satellite Terra acquired from January 17 to February 1, 2008. (White indicates snow cover; green, land without snow cover; blue, ocean or open water; and light blue, sea-ice cover. Black indicates that those regions were always cloudy during the observation period, and orange lines define the borders).
You can see that snow cover extends over a wide area from Xian to Shanghai in China. This severe cold wave hit central Asia, as well as China, from around the end of January to the beginning of February 2008.
Figure 2 indicates recent seasonal variations of snow-covered area in the Eastern Asia region depicted in Fig. 1. This figure demonstrates that the snow-covered area at the end of this January was the greatest since 2000. However, the air temperature suddenly increased after the middle of February due to the southerly inflow of warmth. The extended snow cover then rapidly shrank. As a result, the snow-covered area of Eastern Asia in March to April 2008 was the least in the past nine years.
 |
 |
 |
 |
 |
 |
 |
 |
 |
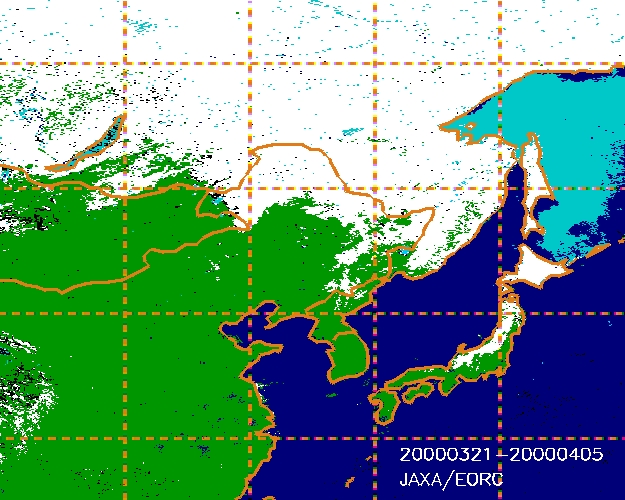
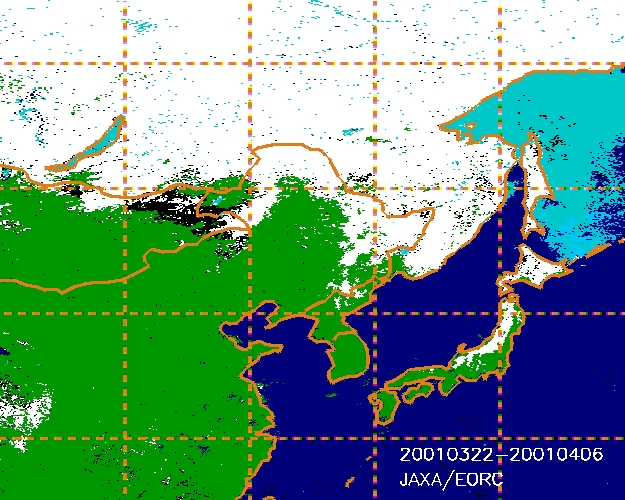
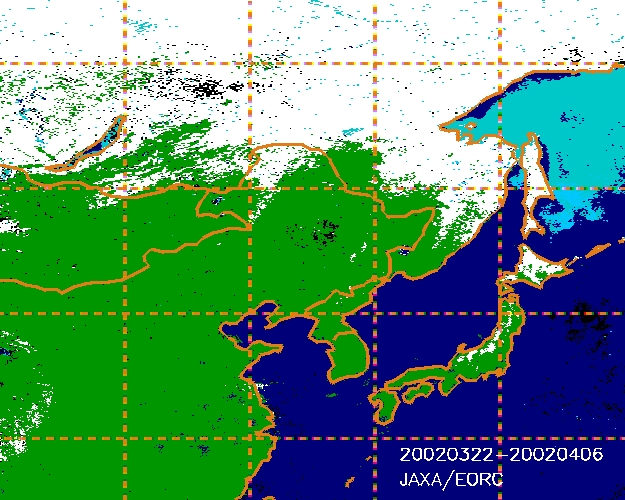
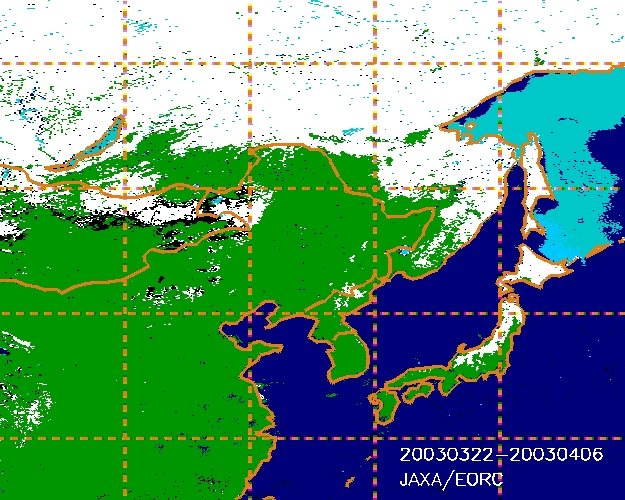
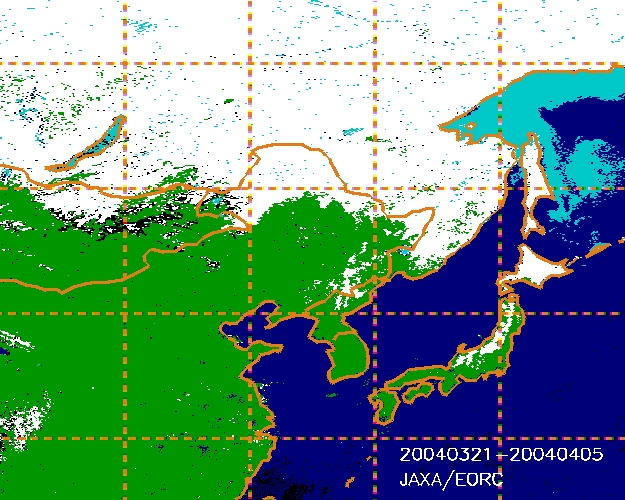
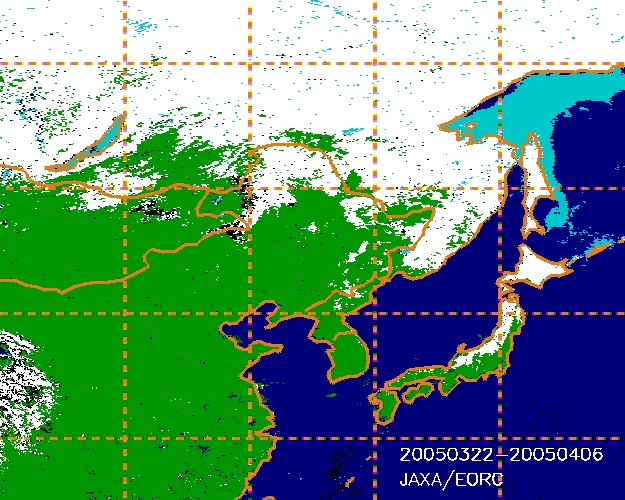
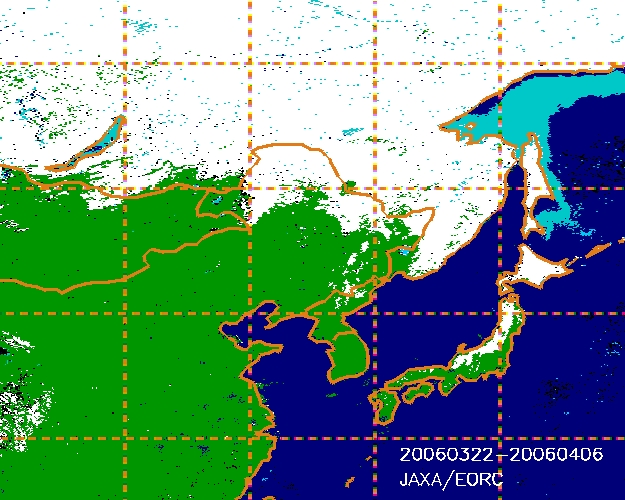
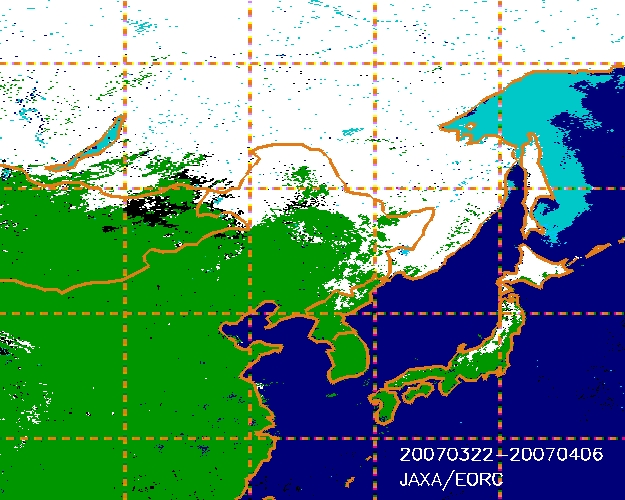
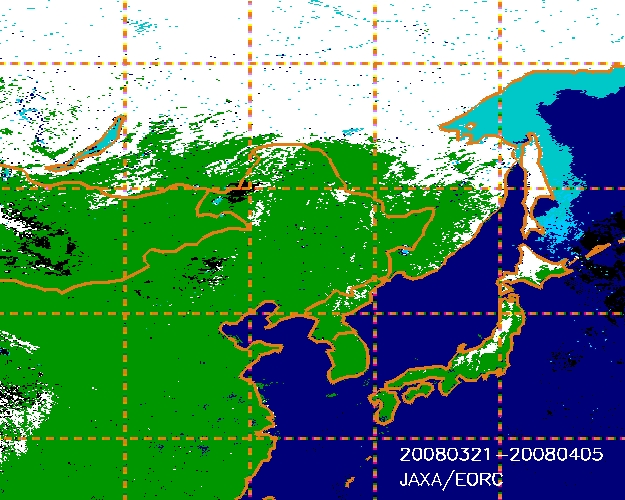
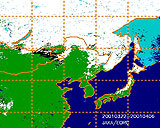
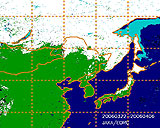
| Fig. 3. Year-to-year variation of snow-cover extent in Eastern Asia (Mar. 22 to Apr. 6, 2000 to 2008) |
Figure 3 illustrates the year-to-year variation of snow-cover extent in the spring around the end of March (the observation period shown as a broken-line box in Fig. 2). There was less snow cover around the border between China and Russia this year, which again suggests the rapid melting of snow after the middle of February. Similar conditions can be seen for 2002 and 2003, both of which were years of frequent forest fires in Eastern Asia.
 |
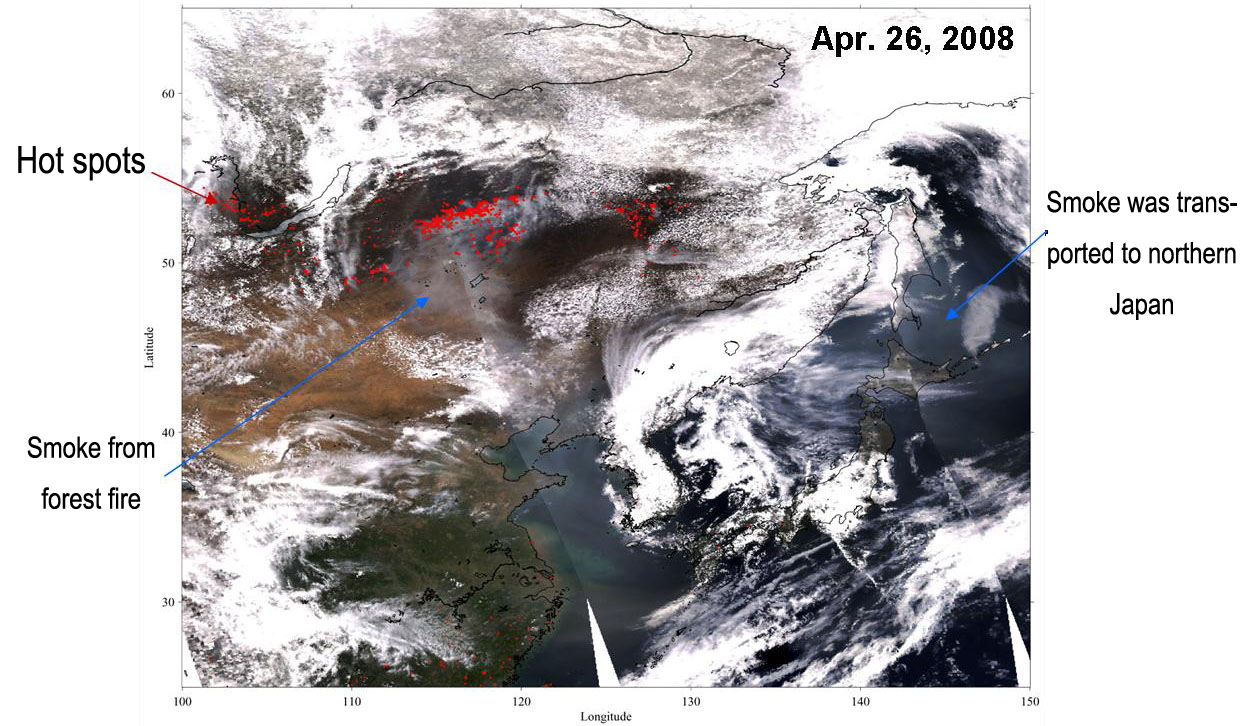
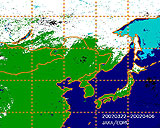
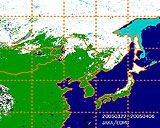
| Fig. 4. Spatial distribution of hot spots (red points) in Eastern Asia captured by Aqua/MODIS on Apr. 26, 2008. |
Figure 4 presents a true-color RGB composite image of Eastern Asia captured by MODIS aboard NASA's Earth-observing satellite Aqua on April 26, 2008. Hot spots (areas of abnormally high temperatures) are represented as red dots that were detected using brightness temperature data in thermal infrared channels. Similar to the years of less snow (2002 and 2003), many forest fires occurred around the border between Russia and China this year, too. The earlier shrinkage of snow cover is expected to make the land drier and cause frequent forest fires. You can see that smoke from forest fires is transported to the Korean Peninsula, Sakhalin, and northern Japan by seasonal wind blowing from northwest to southeast.
 |
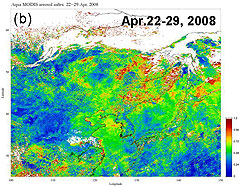 |
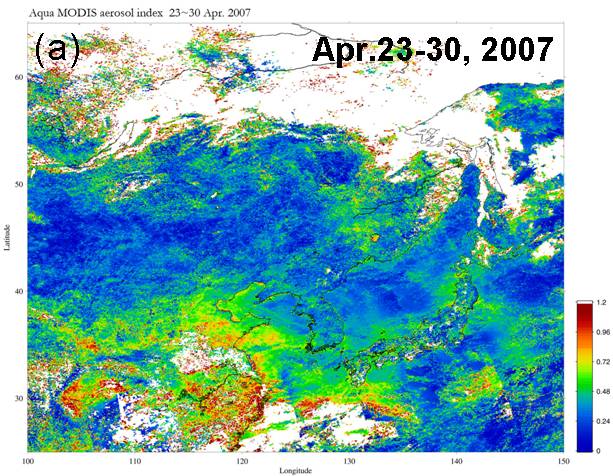
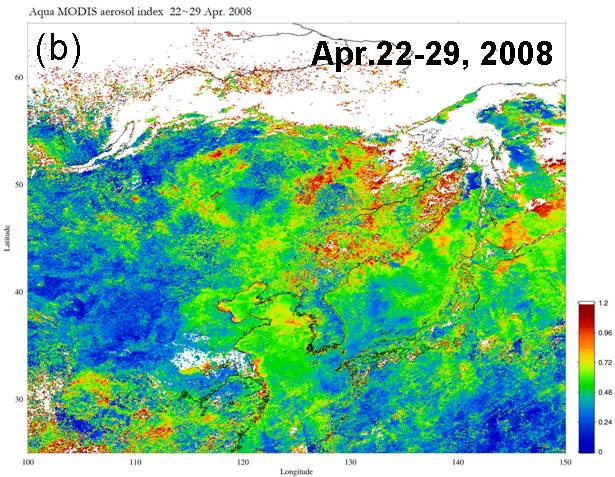
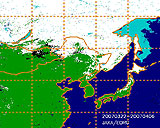
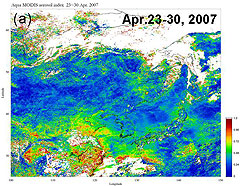
Fig. 5. Aerosol index retrieved from MODIS data captured during
(a) Apr. 23 to 30, 2007 and (b) Apr. 22 to 29, 2008. |
Figure 5 presents the spatial distribution of aerosol (atmospheric fine particles) around the end of April 2007 and 2008 as retrieved from MODIS data. Aerosol loading increases from blue to red. In 2008, much aerosol was emitted from the frequent forest fires and transported to wide areas including northern Japan. In contrast, much snow cover seems to inhibit forest fires in 2007, leading to low aerosol loading.
In this way, earlier melt onset and decay of snow cover in spring is considered to make forest fires more frequent and thus increase the emission of greenhouse gases such as CO2 and aerosols. These air pollutants impact global warming as well as the health of people living in Eastern Asia, including Japan.
JAXA continues to monitor the change of the Earth's environment by satellite observation.
Explanation of the Images:
Fig. 1
| Satellite: |
EOS-Terra (NASA) |
| Sensor: |
Moderate Resolution Imaging Spectroradiometer (MODIS) (NASA) |
| Date: |
January 17 to February 1, 2008 |
| Resolution: |
9km |
Snow cover was extracted from 16-day clear sky composite images using visible to near infrared channels' reflectances and brightness temperatures in thermal infrared channels.
Fig. 3
| Satellite: |
EOS-Terra (NASA) |
| Sensor: |
Moderate Resolution Imaging Spectroradiometer (MODIS) (NASA) |
| Date: |
March 22 to April 6, 2000 to 2008 |
| Resolution: |
9km |
Same as Fig. 1 except for the observation period (date and year).
Fig. 4
| Satellite: |
EOS-Aqua (NASA) |
| Sensor: |
Moderate Resolution Imaging Spectroradiometer (MODIS) (NASA) |
| Date: |
April 26, 2008 |
| Resolution: |
5km |
Fig. 5
| Satellite: |
EOS-Aqua (NASA) |
| Sensor: |
Moderate Resolution Imaging Spectroradiometer (MODIS) (NASA) |
| Date: |
(a) April 23 to 30, 2007. (b) April 22 to 29, 2008. |
| Resolution: |
5km |
Aerosol index was extracted for daily reflectance data only for clear regions using visible to near infrared reflectances and then averaged into an eight-day period. Red dots indicate hot spot (abnormally high temperature regions) detected using brightness temperatures in thermal infrared channels.
|
|