| |
 |
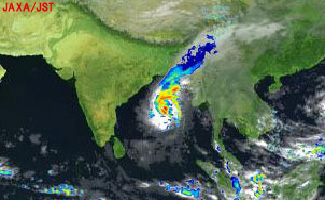 |
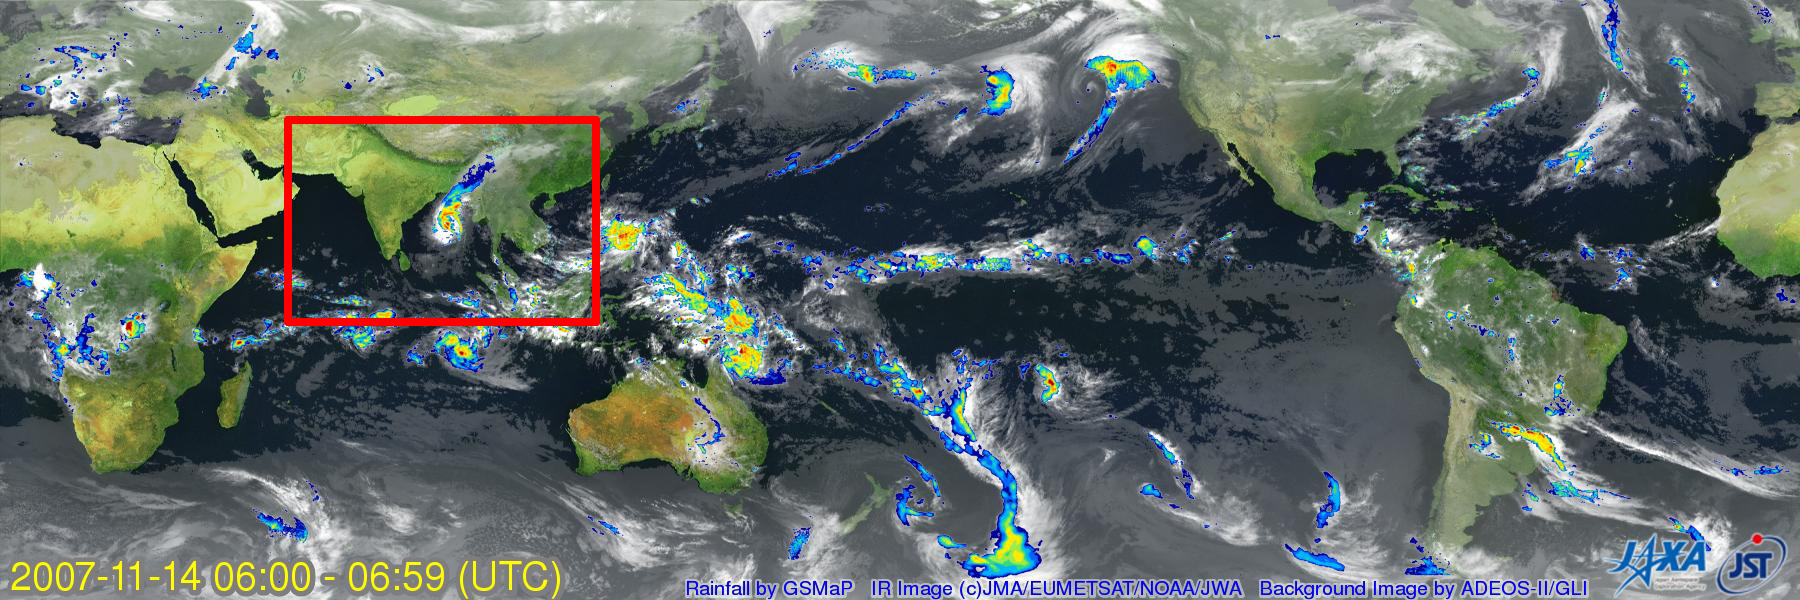
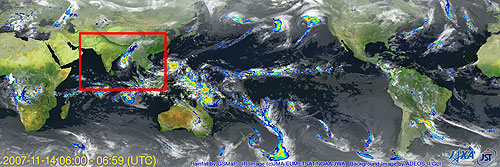
Fig. 1 Global Rainfall Map Image on November 14, 2007 (top)
Close-up image in the red frame in the top figure (bottom)
Rainfall distribution overlaid on cloud image*1
Global Rainfall Map (kmz, 2.5MB) as seen on Google Earth.
Movie on November 11 to 16, 2007 (WMV, 16MB) |
Fierce cyclone SIDR directly hit the coastal area of southern Bangladesh on November15, 2007. Officials in Bangladesh said over 2,000 people were killed on November 18, and some newspaper predicted the death toll would rise.
Figure 1 depicts the Global Rainfall Map*2 as observed at 0600 UTC, November 14, 2007, and the cyclone SIDR approaching Bangladesh in near-real time. The movie depicts SIDR traveling north in the Bay of Bengal.
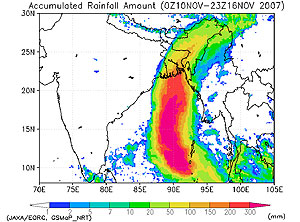 |
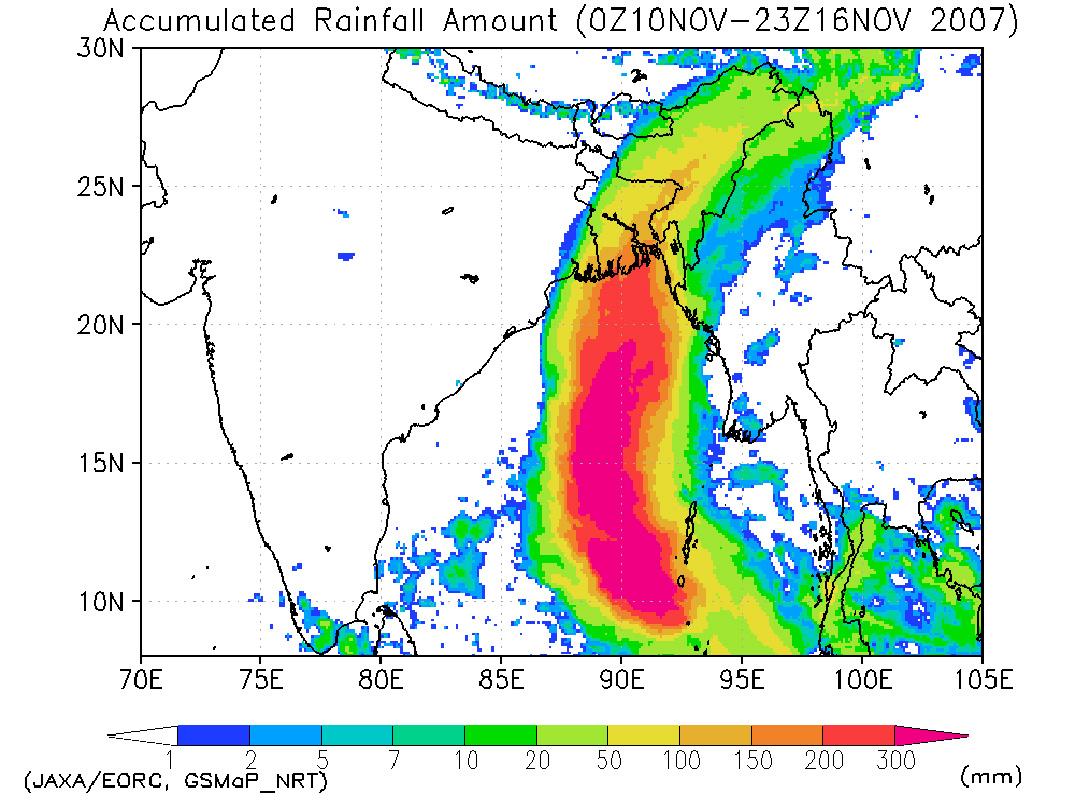
Fig. 2 Accumulated rainfall on November 10 to 16, 2007, calculated by near-real-time data of Global Rainfall Map (mm)
Movie on November 10 to 16, 2007 (GIF, 564KB) |
Figure 2 depicts the accumulated rainfall based on near-real-time hourly data from 10 to 16 November 2007. The accumulated rainfall intensity (yellow to red area) fit SIDR's path. In this figure, you can see SIDR passing east-northeast after landing in the coastal area of Bangladesh from the Bay of Bengal. The quantitative rainfall amount produced by the cyclone is also presented.
*1 Cloud images are provided by the Japan Meteorological Agency, EUMETSAT, NOAA and the Japan Weather Association.
*2 JAXA EORC have provided hourly high-resolution Global Rainfall Map in Near-Real Time (about four hours after observation) using data observed by TRMM and other satellites since this November.
The rainfall amount from the "Global Rainfall Map in Near-Real Time by JAXA EORC" is calculated by an algorithm developed by the Global Satellite Mapping of Precipitation (GSMaP) project sponsored by the Japan Science and Technology Agency (JST). The main feature of the GSMaP algorithm is utilization of various attributes derived from TRMM PR, the first spaceborne precipitation radar. Our cost for providing the rainfall data (four hours after the observation) is competitive for a global rainfall product using microwave radiometers.
Frequent rainfall data and information for Asia, where cyclones and weather disasters occur frequently, is now available from several satellite systems.
Explanation of the Images:
Figs. 1 to 2 (Click the images twiceto enlarge them.)
*3 TRMM is joint project of NASA, NICT and JAXA.
| Satellite: |
DMSP |
| Sensor: |
SSM/I |
| Date: |
0600 to 0659 (UTC) November 14, 2007 (Fig. 1),
November 10 to 16, 2007 (Fig. 2) |
| Satellite: |
Geostationary Meteorological Satellites *4 |
| Sensor: |
IR *4 |
| Date: |
0600 to 0659 (UTC) November 14, 2007 (Fig. 1),
November 10 to 16, 2007 (Fig. 2) |
*4 IR images were provided by the Japan Meteorological Agency, EUMETSAT, NOAA and the Japan Weather Association.
Fig. 1 Background image
|
|