| |
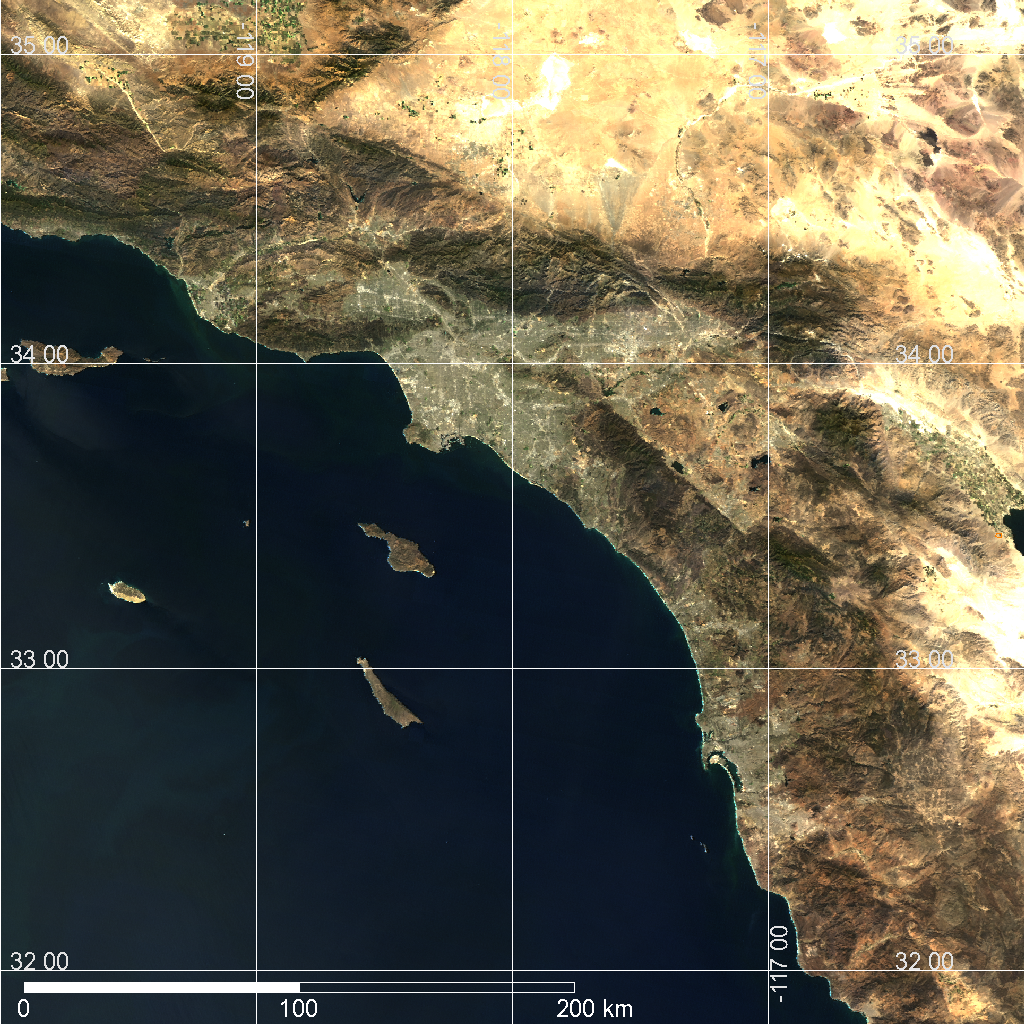
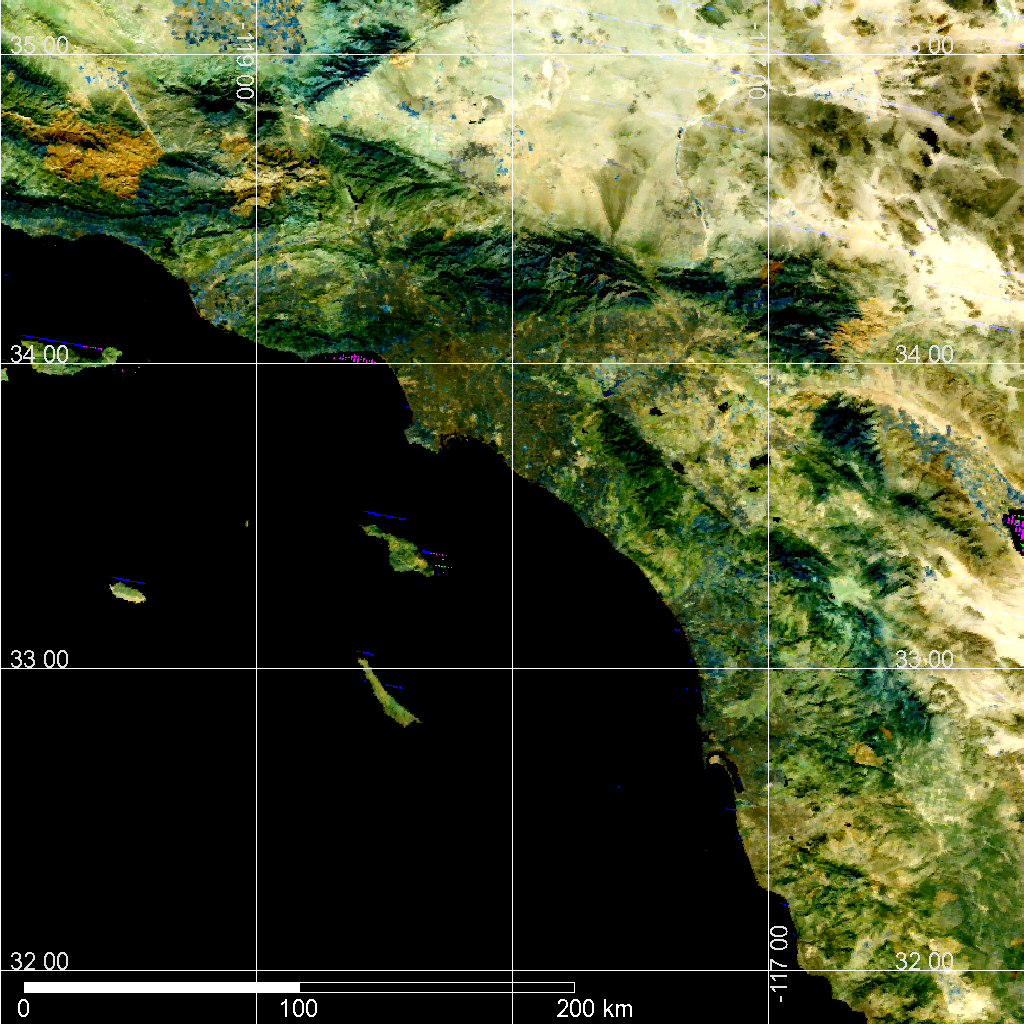
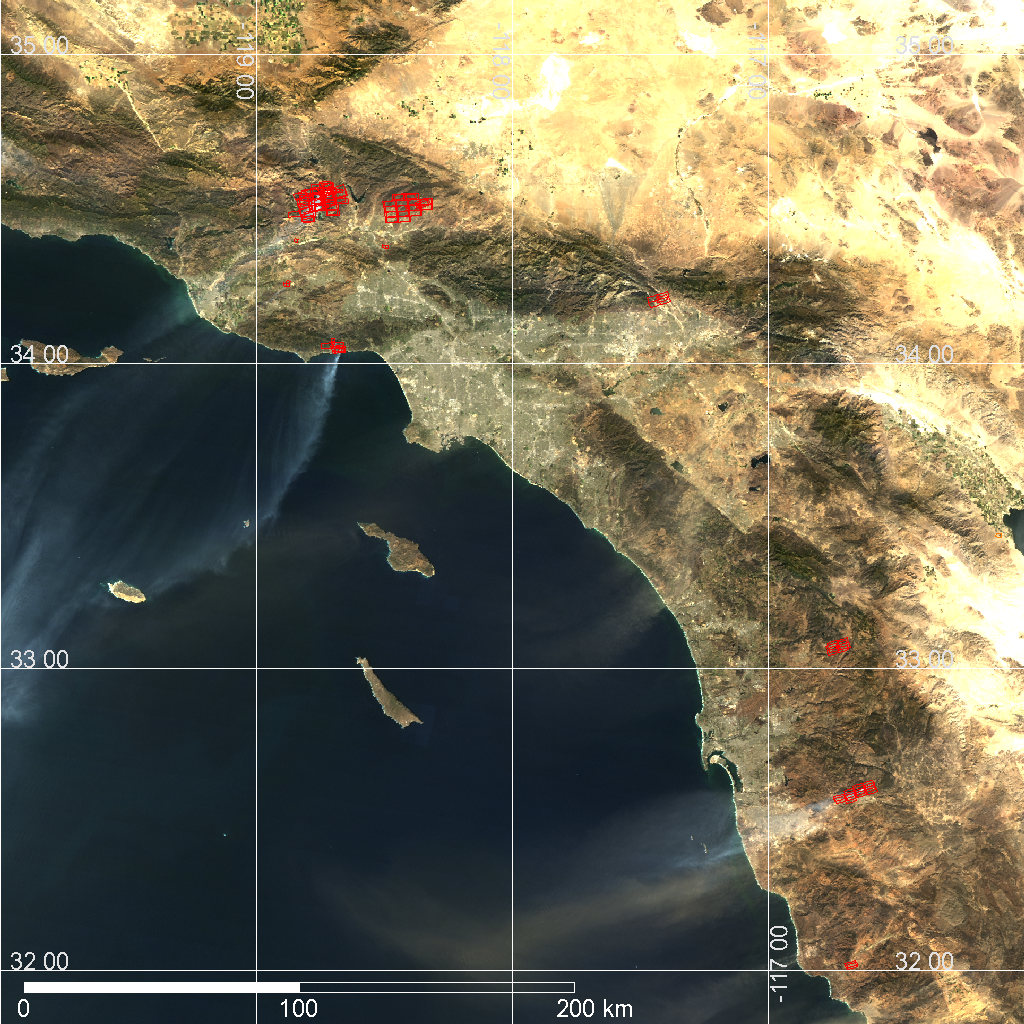
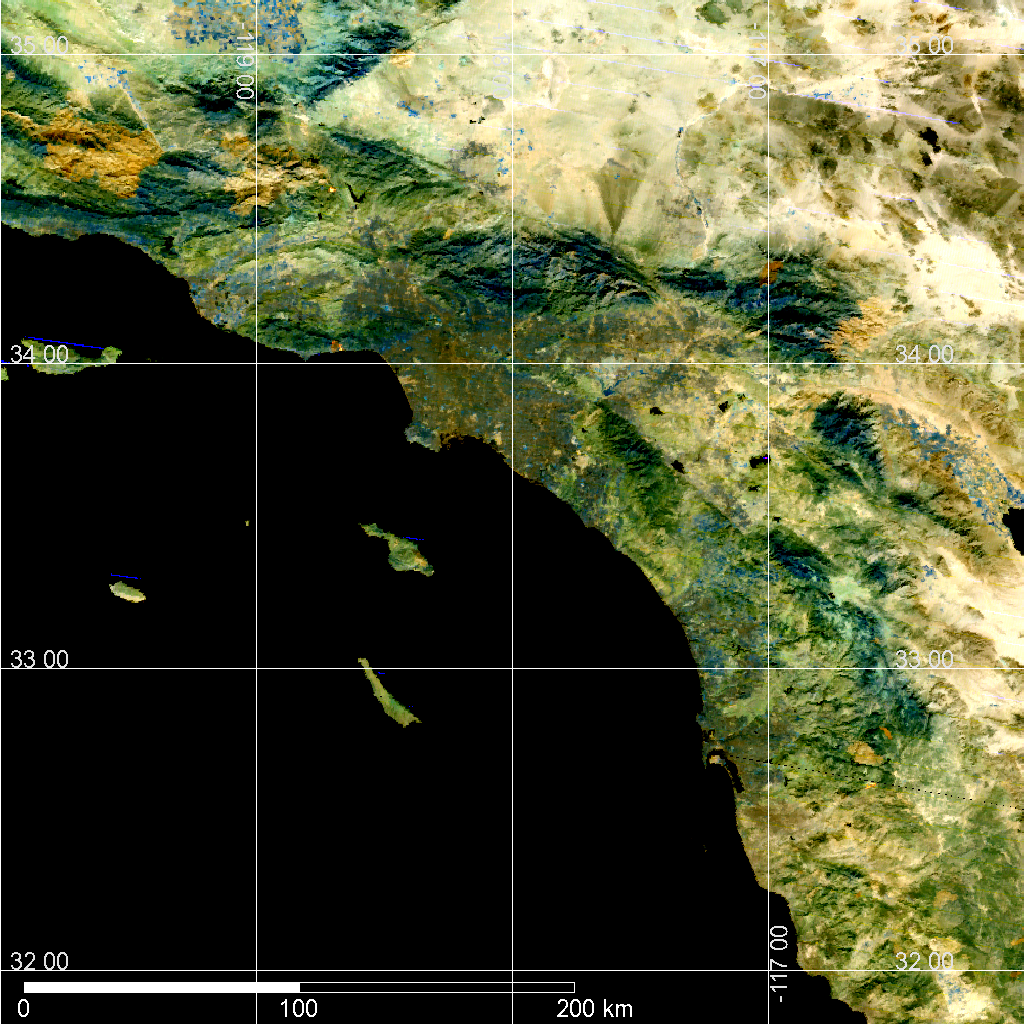
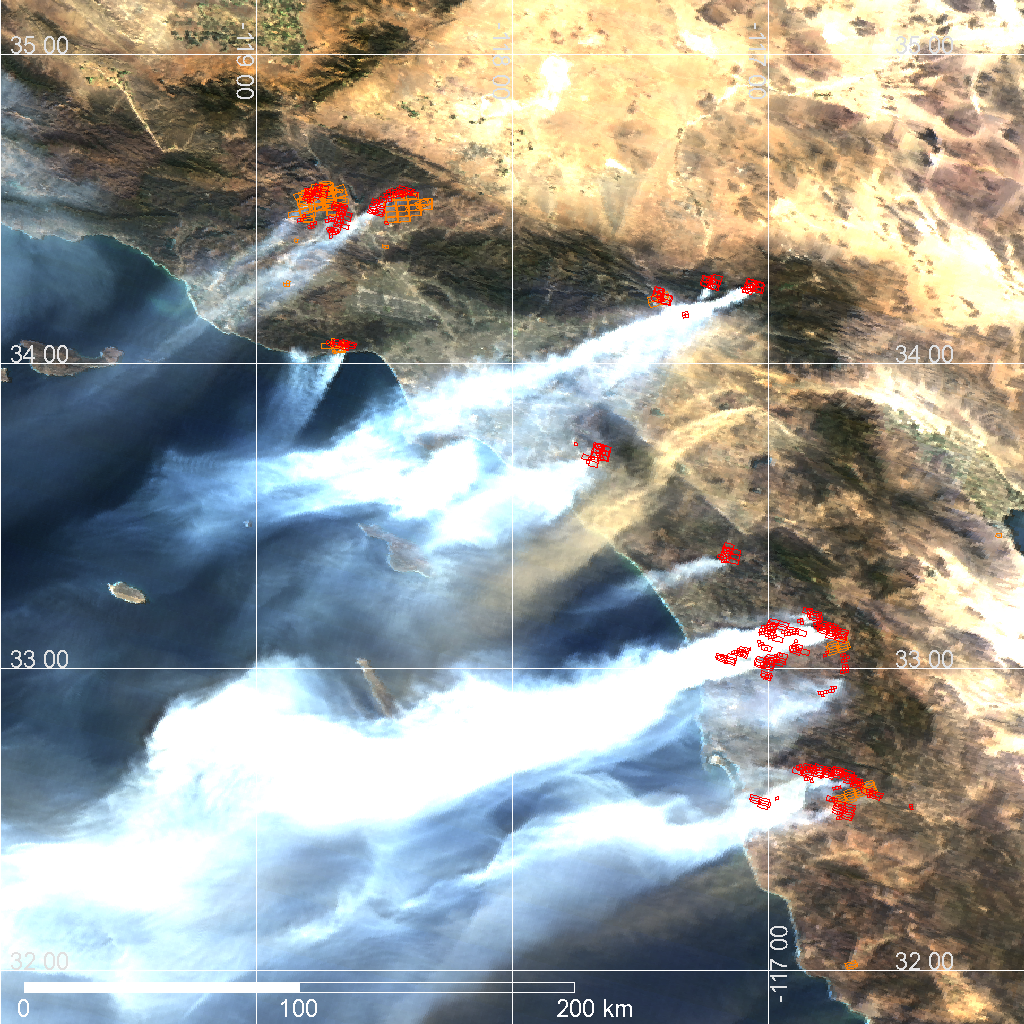
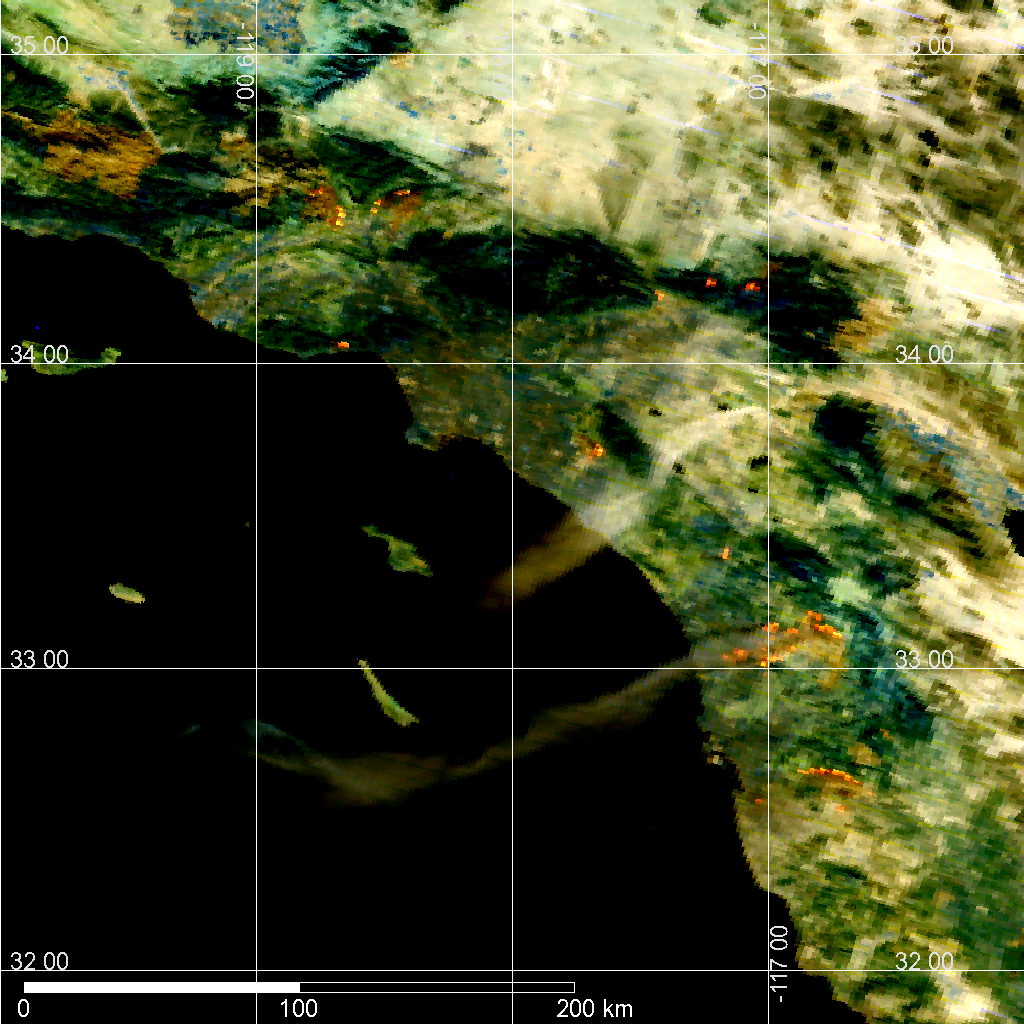
Wild fires broke out in southern California from October 20 to 23, 2007, burning 2,090 square kilometers including 2,000 residences in only one week. The burned area almost corresponds to the entire area of Tokyo (2,187 square kilometers). Figures 1 (a, b and c) present MODIS images overlapped by reddish signs of hotspots (detected fires). In these figures, you can see the wild fires spreading day by day and a smoke plume trail 300km long on October 23. Figures 1 (d, e and f) are MODIS images using short wavelength infrared. Orange spots indicate burning areas; these spots emit strong infrared radiation that penetrates smoke plumes. Wild fire detection algorithms detect these signs from infrared radiation.
 |
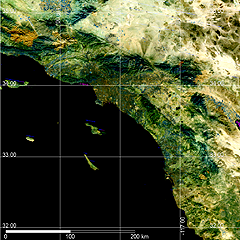 |
| Fig. 1-a October 19, 2007 |
Fig. 1-d October 19, 2007 |
 |
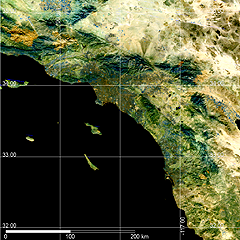 |
| Fig. 1-b October 21, 2007 |
Fig. 1-e October 21, 2007 |
 |
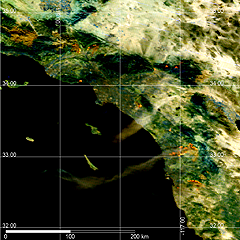 |
| Fig. 1-c October 22, 2007 |
Fig. 1-f October 22, 2007 |
Figs. 1-a, b and c MODIS RGB True color images overlapped by detected hotspots (red squares, hotspots on same day; orange squares, hotspots by one day before)
Figs. 1-d, e and f: MODIS false color images using short wavelength infrared (The ground surface is visible through smoke plume. Orange pixels show strong infrared emission from burning area.) |
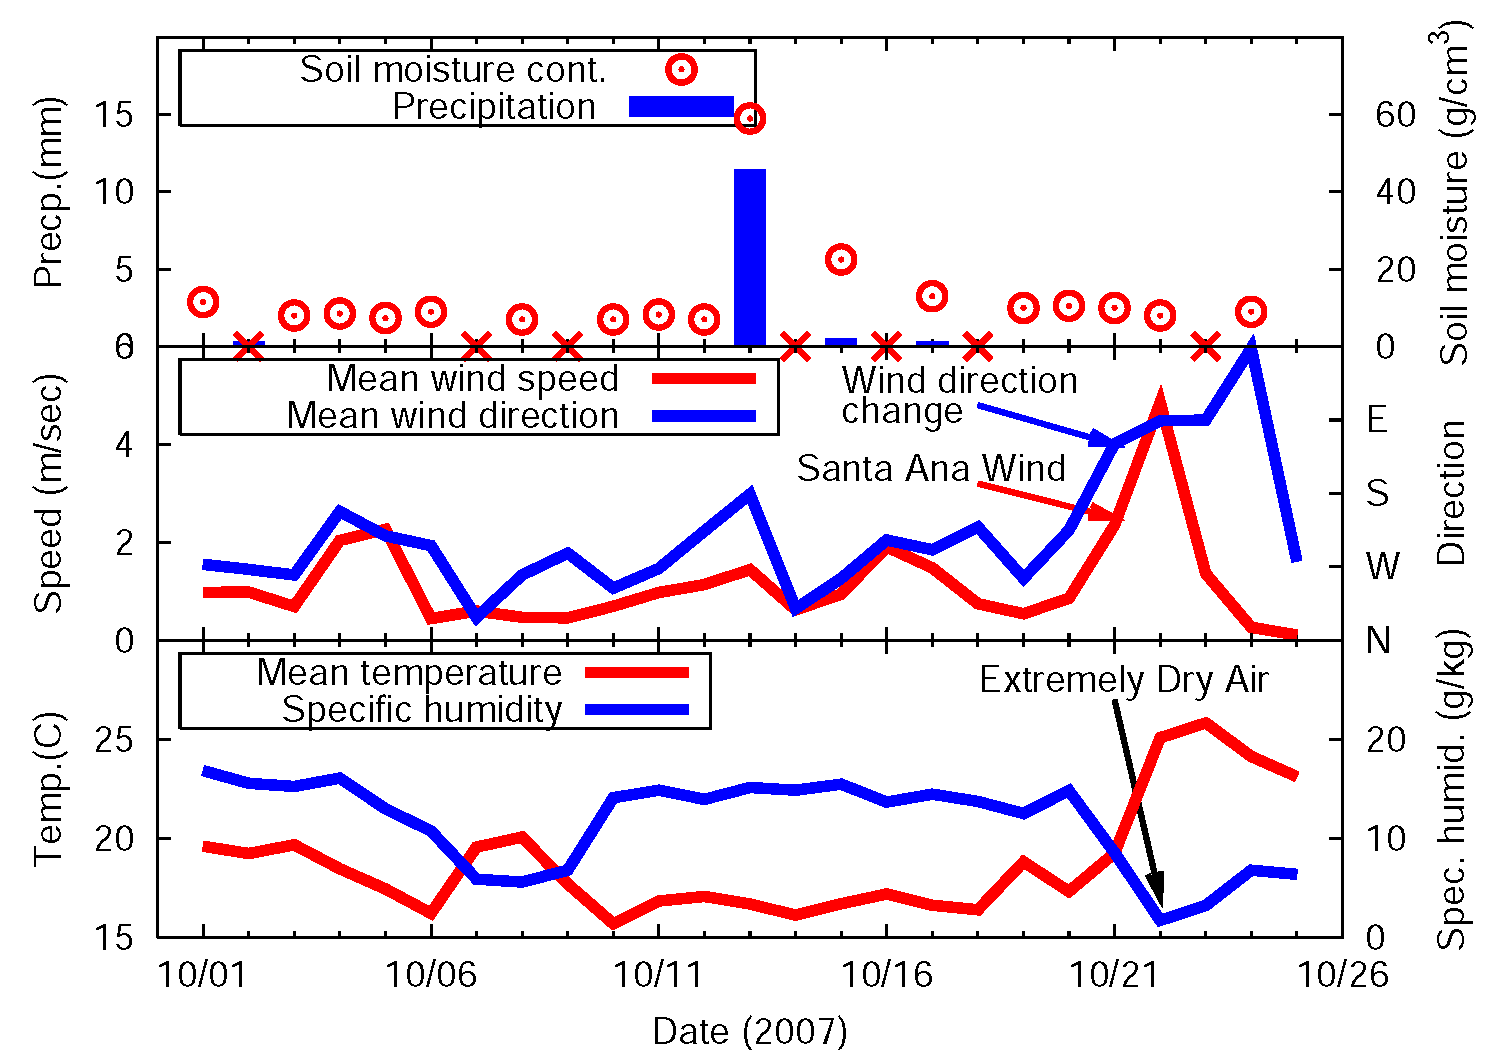
Why did the fires spread so rapidly? We would like to look into meteorological data and soil moisture content data, related to moisture of vegetation. Figure 2 presents the soil moisture content estimated by AMSR-E on NASA's Aqua satellite and meteorological data acquired at Carlsbad Palomar Airport, 12km from the fire scar of Witch fire.
This region is basically dry; however, after rainfall on October 13, soil moisture content dropped to just 10% on October 19 according to the top row of Fig. 2. The second row indicates that the wind direction changed to easterly (blue arrow) and the wind blew strongly (red arrow) from October 21. Finally, the bottom row shows that the specific humidity dropped rapidly to one-eighth with the change of wind direction. Extremely dry and strong easterly wind continued for three days, enabling the wild fire to spread widely in this short period. There could be huge wild fires when such extremely dry strong winds prevail. This dry easterly wind is called the Santa Ana Wind. An anticyclone in Nevada or Utah blows extremely hot and dry easterly wind down to southern California.
It would be a benefit of middle resolution Earth observation sensor to grab a time series of state of phenomena day by day.
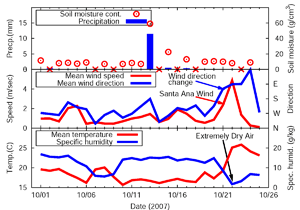 |
Fig. 2 Soil moisture content estimated by AMSR-E aboard NASA's Aqua satellite and meteorological data acquired at Carlsbad Palomar airport, 12km from fire scar of Witch fire
Top: Precipitation (blue bars) and estimated soil moisture content (red circles; red crosses indicate missing observation)
Middle: Wind velocity (red lines) and wind direction (blue lines)
Bottom: Air temperature (red lines) and specific humidity (weight ratio of water vapor in atmosphere, blue lines)
|
Explanation of the images:
Fig. 1- a to f (Click the images twice to enlarge them.)
| Satellite: |
EOS-Terra (NASA) |
| Sensor: |
Moderate Resolution Imaging Spectroradiometer (MODIS; NASA) |
| Date: |
October 19, 21 and 23, 2007 |
| Resolution: |
500m |
Figs. 1-a, b and c
Color composition was made by combining three visible channels; channel 1 (620 to 670nm) for red, channel 4 (545 to 565nm) for green, and channel 3 (459 to 479nm) for blue. The image appears as though seen with the naked eye.
Figs. 1-d, e and f
Color composition was made by combining three short wavelength infrared channels; channel 7 (2,105 to 2,155nm) for red, channel 4 (1,628 to 1,652nm) for green, and channel 3 (1,230 to 1,250nm) for blue. Because of the false colors made by infrared, colors are not natural. However, forests are greenish, and intense wild fires are orange.
Fig. 2 (Click the image twice to enlarge it.)
|
 |
|