| |
 |
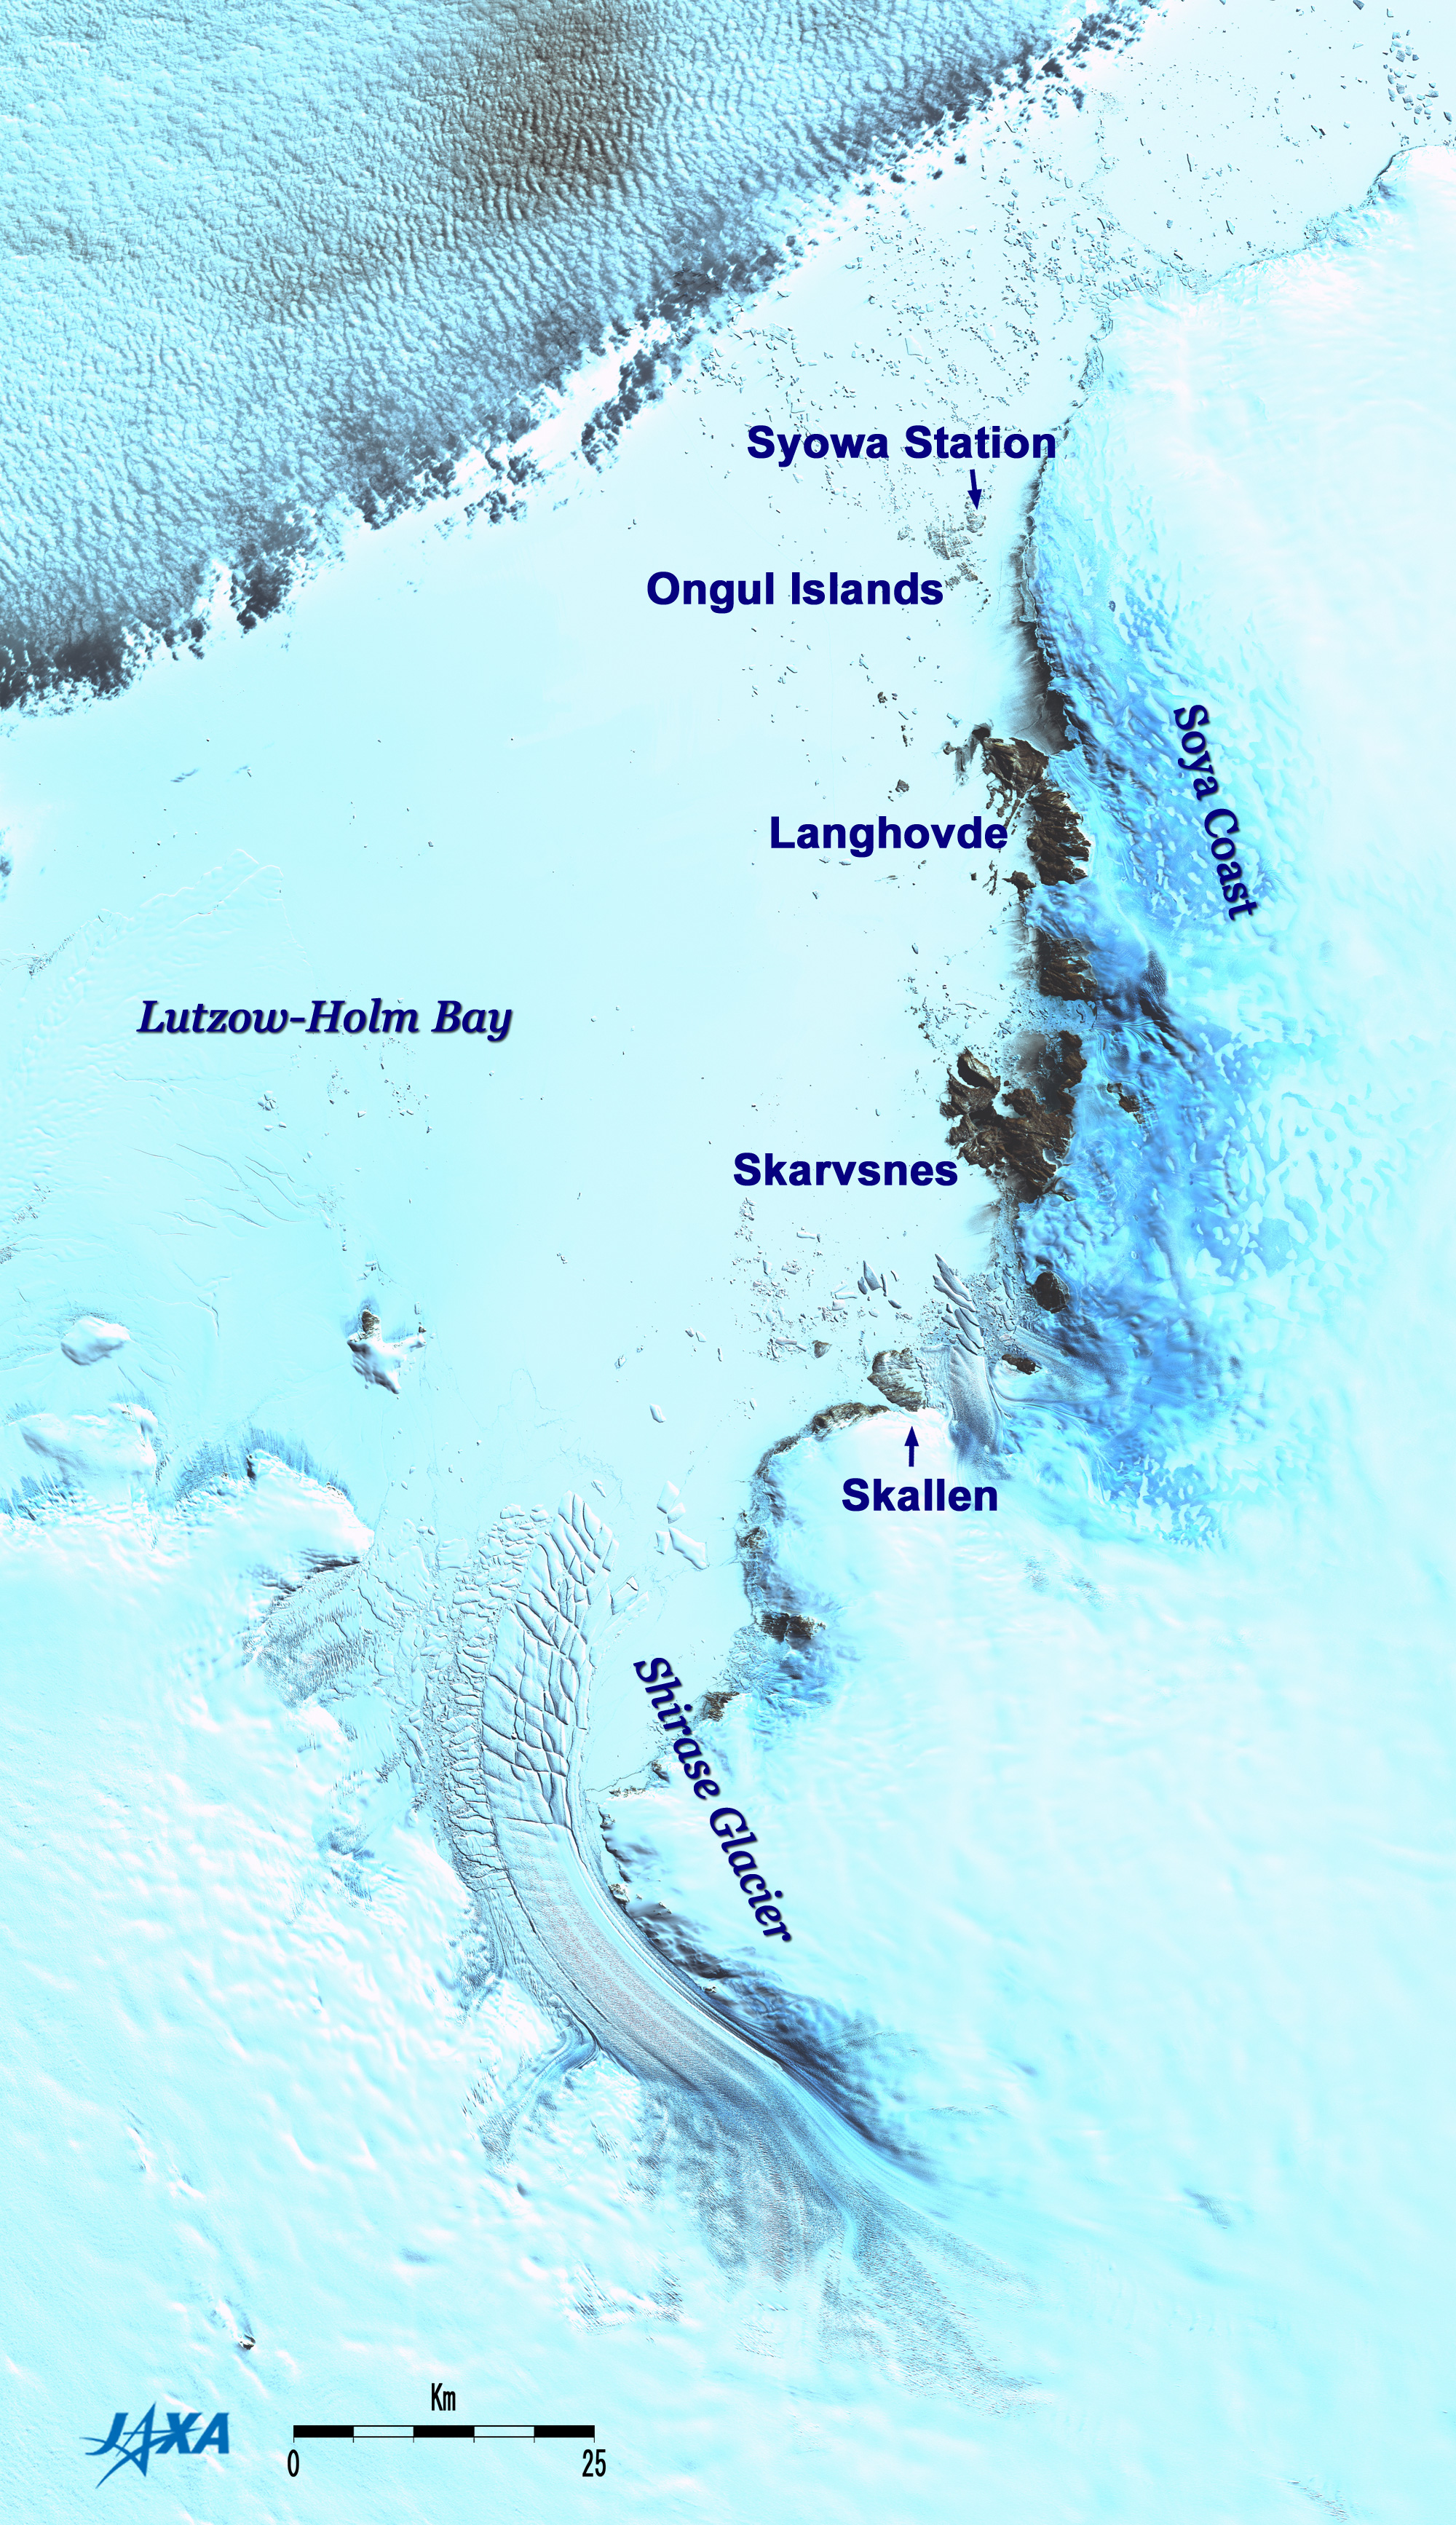
Fig. 1 Wide area image around Shirase Glacier
Shirase Glacier (kmz, 1.68MB, Low Resolution) as seen on Google Earth. |
Figure 1 is a wide area image around Shirase Glacier in Antarctica observed in March 2007. The snow-covered Ongul Islands, location of Syowa Station, can be dimly seen at the top of the figure; Shirase Glacier is located about 100km south of the islands. Langhovde, Skarvsnes and Skallen are peninsulas with rock-exposed areas. The center of the figure is the frozen Lutzow-Holm Bay; the upper left depicts a cloud-covered open sea area that isn't frozen. The area from the right to the lower left of the figure is part of Antarctica and is covered with thick snow and ice.
Shirase Glacier is 11km wide near its mouth, and 85km long, including a glacial tongue extending to Lutzow-Holm Bay. The stripes of the glacier are blurred upstream, but you can find that some flows join. The downstream, where the stripes are clearly visible, floats on the sea instead of being supported by the ground*1. The cracks, which begin to form in the glacier near the mouth, are clearly visible in the glacial tongue and look like arranged tiles. The pieces that appear to be tiles will become table-shaped icebergs in the future.
 |
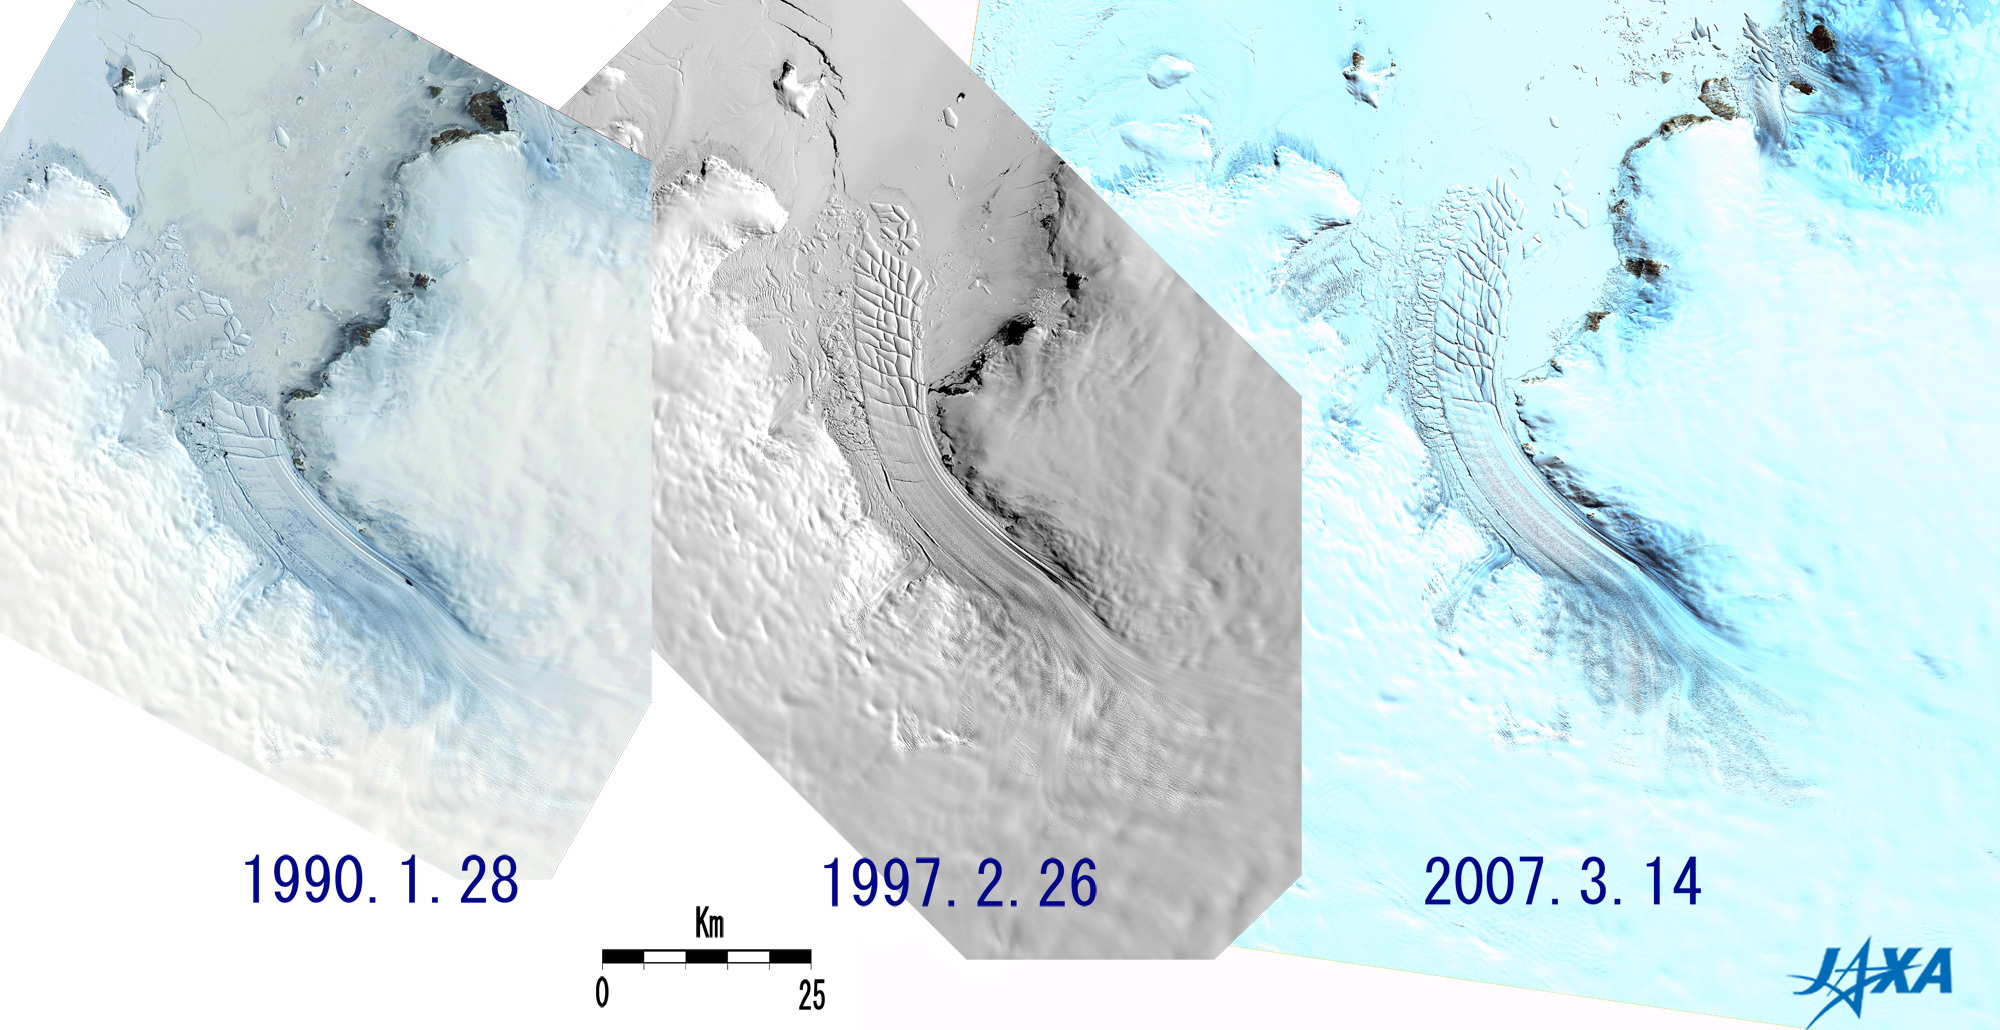
| Fig. 2 Change of Shirase Glacier observed by optical sensors |
Figure 2 depicts Shirase Glacier in 1990, in 1997 and in 2007 as observed by optical sensors. There is hardly a glacial tongue in the 1990 image but some icebergs that seem to be remnants of the glacial tongue can be seen in the offing. In the 1997 image, you can see a 20km long glacial tongue and the icebergs, which are separating from the glacial tongue in the offing. The glacial tongue extends about 30km in the 2007 image. These images indicate that the glacial tongue in Shirase Glacier changes significantly year-by- year.*2
Figure 3 presents Shirase Glacier as observed by synthetic aperture radar in January 1994 to July 1998, and August 2006 to August 2007. If you watch this animation carefully, you can understand that the glacial tongue stretches slowly from January 18, 1994 to February 22, 1998. The tip of the glacial tongue stretched 10.2km in the last four years and one month, about 2.5km per year on average. This is very fast for glaciers, and Shirase Glacier is known as one of the fastest glaciers in Antarctica.
In the image acquired on April 7, 1998, the sea ice off the glacial tongue drifted away, and the open sea surface appears black. The 17km long glacial tongue had been clearly swept away by May 18, 1998.
The figure depicts the glacial tongue extending again from August 11, 2006, to August 3, 2007. During this period, the tip of the glacial tongue extended about 2.1km.
Additionally, you can find that the glacial tongue extended roughly to the right from August 2006 to August 2007, although it stretched relatively straight from April 1994 to February 1998. The ocean current in Lutzow-Holm Bay and the sea-surface wind are believed to have influenced this.
The ice sheet (compacted thick snow and ice) covering Antarctica is maintained by a balance between the quantity of accumulated thick snow and the quantity of glaciers and icebergs flowing away. Therefore, we should watch change in Shirase Glacier carefully to investigate how global warming influences the ice sheet in Antarctica.
Explanation of the Images:
Figure 1 and Fig. 2 right; Click the images twice to enlarge them.
AVNIR-2 has four observation bands. Figure 1 and Fig. 2 right were composed by assigning red to near-infrared Band 4 (760 to 890nm), green to visible Band 3 (610 to 690nm), and blue to visible Band 2 (520 to 600nm). In these images, snow, ice and clouds are white or light blue; exposed rocks are dark brown; and the open sea surface is blackish.
Fig. 2 left; Click the image twice to enlarge it.
These images were produced by assigning red to the near-infrared band (720 to 800nm), green to the visible band (610 to 690nm), and blue to the visible band (510 to 590nm). You can interpret the resulting images in the almost same way as the above AVNIR-2 images.
Fig. 2 center; Click the image twice to enlarge it.
AVNIR has a panchromatic band (520 to 690nm), by which the monochrome high-ground-resolution images are acquired, in addition to the multi-bands, by which color images are acquired.
Fig. 3
| Satellite: |
Japanese Earth Resources Satellite -1 (JERS-1) (Fuyo-1) |
| Sensor: |
Synthetic Aperture Radar (SAR) |
| Date: |
0545 (UTC) on January 18, 1994
0542 (UTC) on August 25, 1994
0575 (UTC) on February 17, 1995
0550 (UTC) on September 25, 1995
0551 (UTC) on March 19, 1996
0554 (UTC) on September 12, 1996
0553 (UTC) on March 7, 1997
0554 (UTC) on August 30, 1997
0558 (UTC) on February 22, 1998
0559 (UTC) on April 7, 1998
0554 (UTC) on May 18, 1998
0601 (UTC) on July 4, 1998
|
| Frequency: |
1,275 MHz (L-band) |
| Ground resolution: |
18m |
| Map Projection: |
Universal Transversal Mercator (UTM) |
Synthetic aperture radar can observe the Earth's surface day or night and in all weather. The acquired images are monochrome and the targets, which strongly reflected the radar signal transmitted from the synthetic aperture radar, appear bright.
Fig. 3
We developed PALSAR by improving the features and performances of the sy
nthetic aperture radar (SAR) that flew aboard JERS-1. The acquired images are monochrome and look the same as the JERS-1/SAR images. |
 |
|